 |
||
|
||
| ||
Contents
Synthetic tests in D3D RightMarkThe version of the synthetic benchmark package D3D RightMark Beta 4 (1050), which we used, and its description are available on the web site http://3d.rightmark.org A list of video cards:
At first let's find out the conformity of claimed characteristics (8 pixels per clock, etc) with reality. So:
Pixel Filling TestPeak performance of texelrate, FFP mode, for various numbers of textures applied to one pixel: 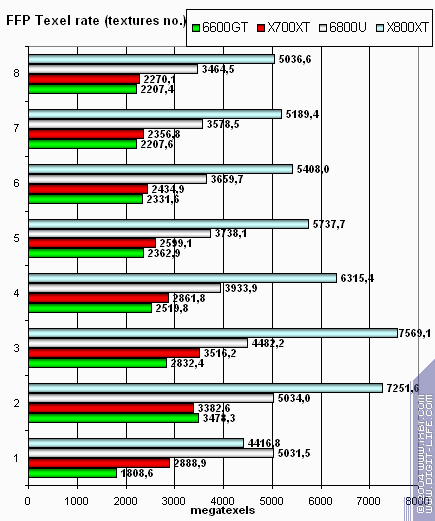
The fillrate and pixelrate of frame buffer, FFP mode, for various number of textures applied to one pixel: Sterling 8 pipelines and the capacity to write up to 8 pixels per clock. Thus we see the advantage over NV43, but only in case of one texture or without texturing. In most real applications the number of textures is over or equal to two and the cards demonstrate similar results. Let's see how the fill rate depends on a shader version.
As we expected - no surprises, which is typical of all latest chips. A large memory passband and the capacity to write 8 pixels per clock allow X700 to outscore 6600 in simplest tests. As the shader length or the number of textures increase to reasonable values, this difference disappears. Writing to the frame buffer:
Texture fetching:
Thus, no surprises, the expected advantage of X700 with one-texture filling has proved to be true. Geometry Processing Speed TestThe simplest shader - maximum throughput for triangles: 
More complex shader - one simple point light source: 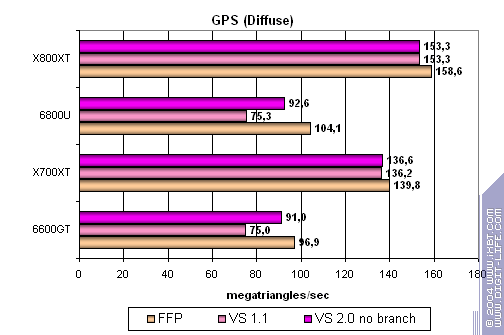
Let's complicate the task even further: 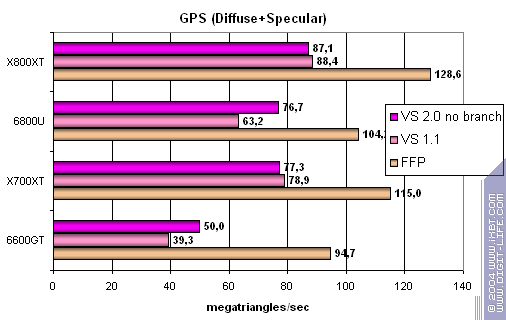
And now the most complicated task, three light sources, for comparison without branching, with static and dynamic control: 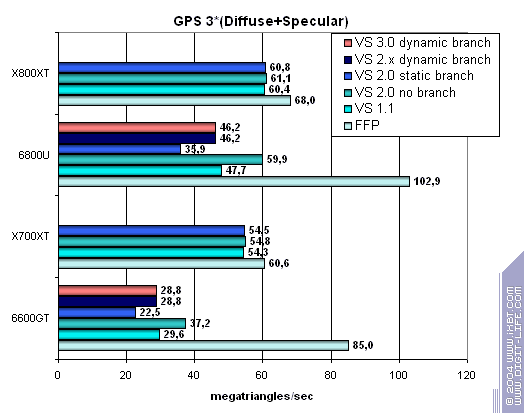
As for geometry, X700 demonstrates phenomenal for its class results - it outscores even 6800 Ultra, to say nothing of its direct competitor 6600 GT. The question is to what extent this huge geometric potential will be revealed, required, and used by applications. None of the modern games needs this triangle throughput. What concerns DCC applications, we have already mentioned before the importance of a driver (especially OpenGL) and other aspects, where 6600 looks more advantageous. Be that as it may, we congratulate ATI - they have set a new standard of geometric performance. We haven't witnessed such a stunning victory over a direct competitor in synthetic tests for a long time. Pixel Shaders TestThe first group of shaders (1.1, 1.4 and 2.0) is rather easy to execute in real time: 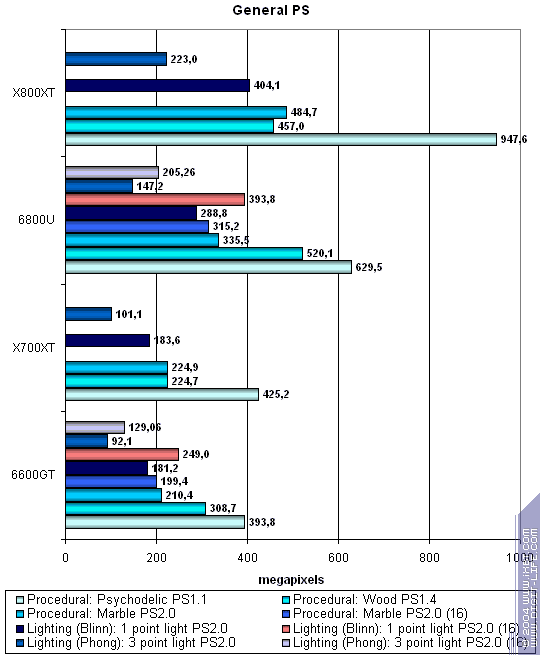
And now let's have a look at complex shaders: 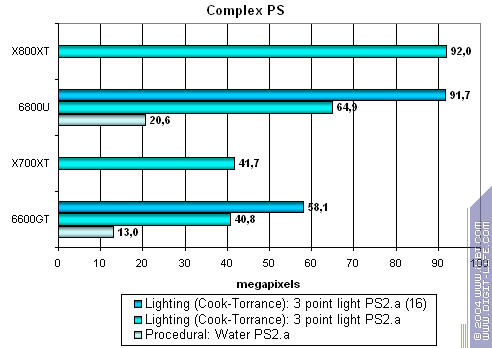
Thus, concerning pixel shaders: An obvious parity here - X700 neither loses nor outscores 6600 GT. But in this case you should pay attention to such secondary factors as the SM3 support and other extra features of the latest NVIDIA architectures. From this point of view the X700 results do not look that impressive - ATI could have turned the advantage of simplicity to the advantage of performance, but this time it didn't happen. Other things being equal, the NVIDIA product will look better because of its technological advantage. HSR TestFirstly, peak efficiency (without textures and with textures) depending on the geometry complexity: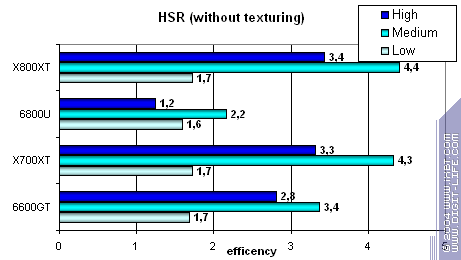
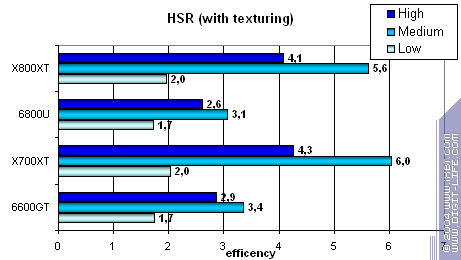
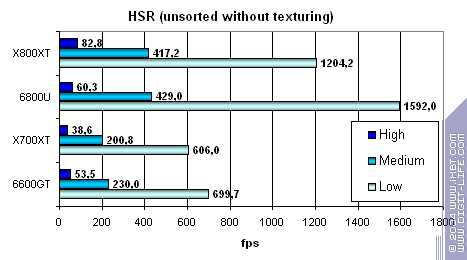
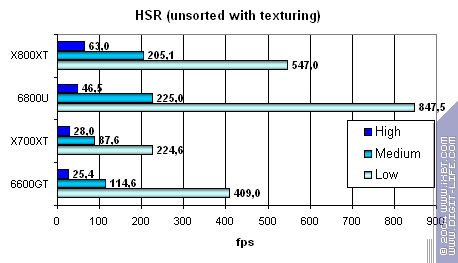
Conclusion: No peculiarities, behavior of the HSR system is quite characteristic for ATI, which is noticeably (but not fatally) more effective and more adaptable due to an additional hierarchy level than that from NVIDIA. Point Sprites TestIt's quite logical that ATI wins in case of large sprites - the effect of 8 units responsible for blending and writing values to a frame (remember that sprites are usually used to render particle systems, which practically always means alpha-blending). In case of small sprites, the competing chips look practically equal - the bottleneck is the drivers and DirectX. MSAA Test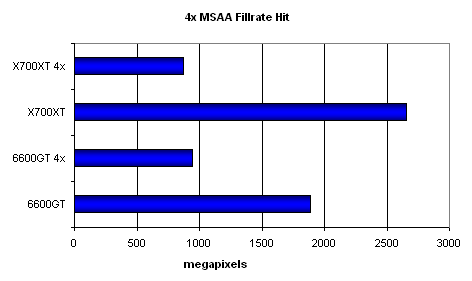
4x MSAA equalizes X700 and 6600GT in their capacities, at least in this simple test.
Note that in case of 2x, practically gratuitous for both chips, X700 may (potentially) look a tad stronger in simple one-texture tasks.
Synthetic tests in 3DMark03: Fillrate Multitexturing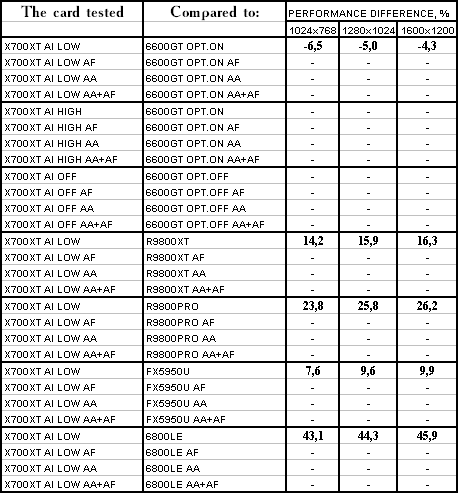 Synthetic tests in 3DMark03: Vertex Shaders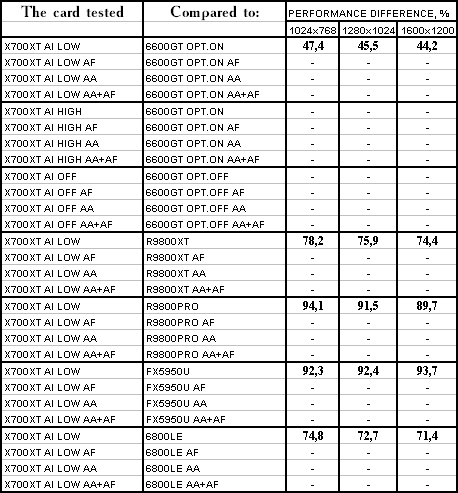 Synthetic tests in 3DMark03: Pixel Shaders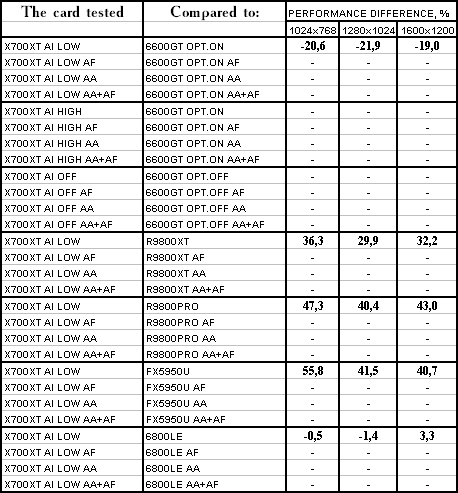 3D Mark tests once more confirm our assumptions. Synthetic test conclusionsChips are equal in many aspects. Other things being equal, it is not to ATI's advantage - NVIDIA products possess larger overclocking potential and higher architectural advantage. Two main differences:
Thus, it's impossible to single out a solid leader, we have noted and commented on all major interesting moments. Now let's proceed to practical tests and see whether they confirm our assumptions: [ The previous part (1) ][ The next part (3) ]We express our thanks to ATI
for the video cards provided to our lab. Write a comment below. No registration needed!
|
|
Platform · Video · Multimedia · Mobile · Other || About us & Privacy policy · Twitter · Facebook
Copyright © Byrds Research & Publishing, Ltd., 1997–2011. All rights reserved.