 |
||
|
||
| ||
|
||
|
||
| ||
Time flies, everything matures. Not so long ago we tested operation of the professional accelerators in the SPECviewperf, and today we have a new version of this test. This test has changed much, that is why it makes no sense to compare versions. Go to profcards-04-2002-part6.shtml to get the old results. The seventh version of the SPECviewperf consists of 6 tests. Visit http://www.spec.org/ to get more detailed information on this test and download it. And here I will briefly describe each subtest. So, the first test is called 3ds max Viewset. 3ds max Viewset (3dsmax-01)  The 3dsmax-01 viewset was created from traces of the graphics workload generated by 3ds max 3.1. To insure a common comparison point, the OpenGL plug-in driver from Discreet was used during tracing. The models for this viewset came from the SPECapc 3ds max 3.1 benchmark. Each model was measured with two different lighting models to reflect a range of potential 3ds max users. The high-complexity model uses five to seven positional lights as defined by the SPECapc benchmark and reflects how a high-end user would work with 3ds max. The medium-complexity lighting models uses two positional lights, a more common lighting environment. The viewset is based on a trace of the running application and includes all the state changes found during normal 3ds max operation. Immediate mode OpenGL calls are used to transfer data to the graphics subsystem. As with the SPECapc test, tests are weighted 1/3 smooth shaded, 1/3 facet shaded, and 1/3 wireframe.
DesignReview Viewset (drv-08) 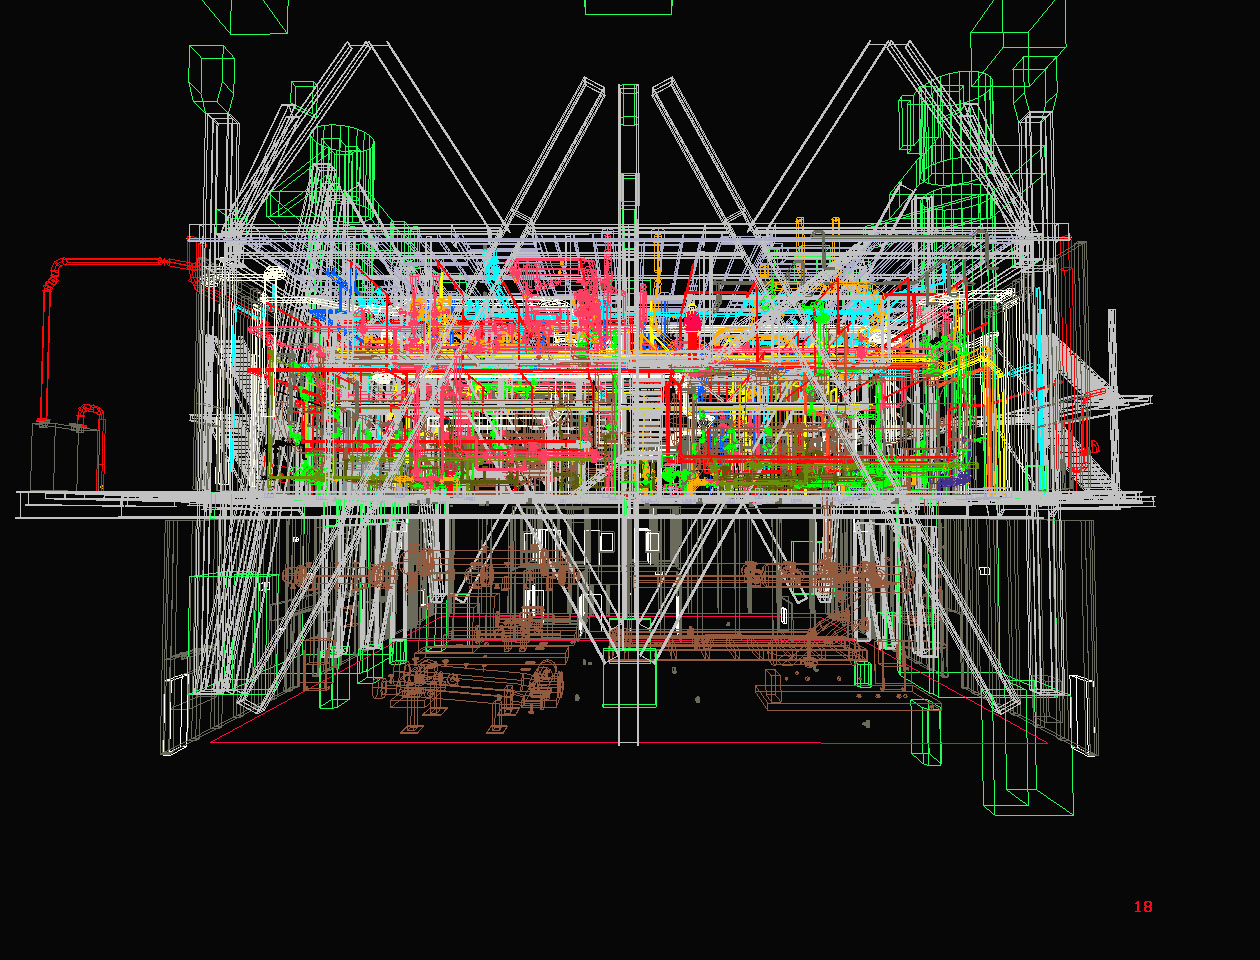 DesignReview is a 3D computer model review package specifically tailored for plant design models consisting of piping, equipment and structural elements such as I-beams, HVAC ducting, and electrical raceways. It allows flexible viewing and manipulation of the model for helping the design team visually track progress, identify interferences, locate components, and facilitate project approvals by presenting clear presentations that technical and non-technical audiences can understand. On the construction site, DesignReview can display construction status and sequencing through vivid graphics that complement blueprints. After construction is complete, DesignReview continues as a valuable tool for planning retrofits and maintenance. DesignReview is a multi-threaded application that is available for both UNIX and Windows NT. The model in this viewset is a subset of the 3D plant model made for the GYDA offshore oil production platform located in the North Sea on the southwest coast of Norway. A special thanks goes to British Petroleum, which has given the SPECopcSM subcommittee permission to use the geometric data as sample data for this viewset. Use of this data is restricted to this viewset. DesignReview works from a memory-resident representation of the model that is composed of high-order objects such as pipes, elbows valves, and I-beams. During a plant walkthrough, each view is rendered by transforming these high-order objects to triangle strips or line strips. Tolerancing of each object is done dynamically and only triangles that are front facing are generated. This is apparent in the viewset model as it is rotated. Most DesignReview models are greater than 50 megabytes and are stored as high-order objects. For this reason and for the benefit of dynamic tolerancing and face culling, display lists are not used. The updated drv-08 shaded model contains 367178 vertices in 42821 primitives. Vertex arrays are used to send the data to mirror the current release of the Design Reivew application. The color and material changes are taken directly from the GYDA model. The wire frame model contains 1599755 vertices in 94275 primitives. There are 5 tests specified by the viewset that represent the most common operations performed by DesignReview. These tests are as follows:
Data Explorer Viewset (dx-07)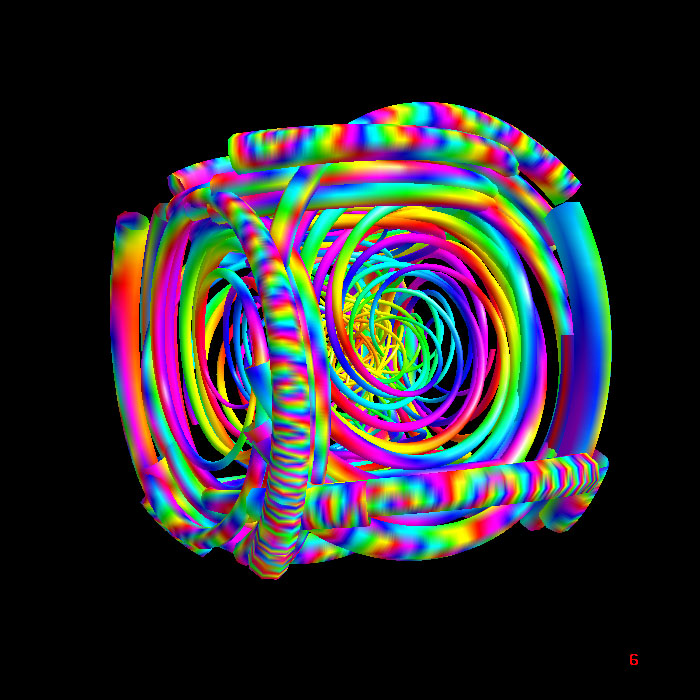 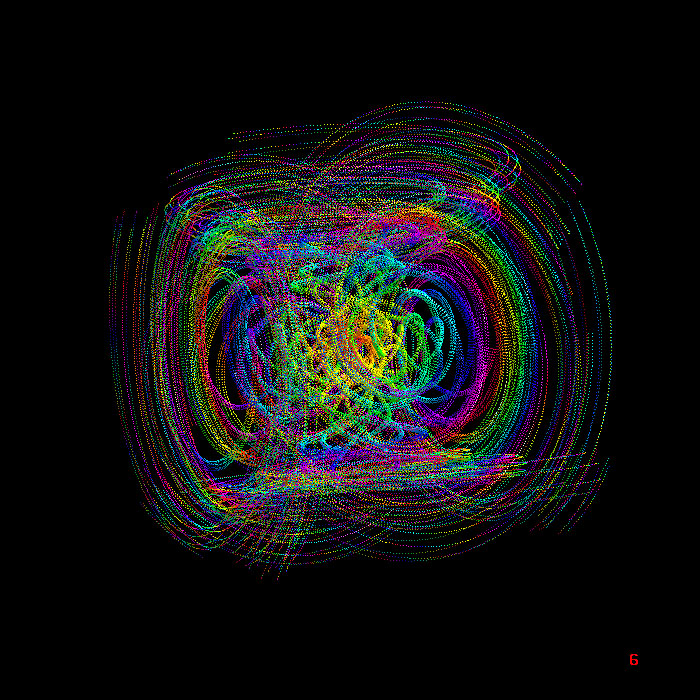 The IBM Visualization Data Explorer (DX) is a general-purpose software package for scientific data visualization and analysis. It employs a data-flow driven client-server execution model and is currently available on Unix workstations from Silicon Graphics, IBM, Sun and Hewlett-Packard. The OpenGL port of Data Explorer was completed with the release of DX 2.1. The tests visualize a set of particle traces through a vector flow field. The width of each tube represents the magnitude of the velocity vector at that location. Data such as this might result from simulations of fluid flow through a constriction. The object represented contains about 3,000 triangle meshes containing approximately 100 vertices each. This is a medium-sized data set for DX. Test WeightingAll tests assume z-buffering with one light in addition to specification of a color at every vertex. Triangle meshes are the primary primitives for this viewset. While Data Explorer allows for many other modes of interaction, these assumptions cover the majority of user interaction. The first version of this viewset included indirect rendering to handle the client/server model of X-Windows-based systems. In this version, tests with indirect rendering have been removed to allow the viewset to be fully ported to Windows NT and OS/2 environments.
Lightscape Viewset (light-05)  The Lightscape Visualization System from Discreet Logic represents a new generation of computer graphics technology that combines proprietary radiosity algorithms with a physically based lighting interface. LightingThe most significant feature of Lightscape is its ability to accurately simulate global illumination effects. The system contains two integrated visualization components. The primary component utilizes progressive radiosity techniques and generates view-independent simulations of the diffuse light propagation within an environment. Subtle but significant effects are captured, including indirect illumination, soft shadows, and color bleeding between surfaces. A post process using ray tracing techniques adds specular highlights, reflections, and transparency effects to specific views of the radiosity solution. InteractivityMost rendering programs calculate the shading of surfaces at the time the image is generated. Lightscape's radiosity component precalculates the diffuse energy distribution in an environment and stores the lighting distribution as part of the 3D model. The resulting lighting "mesh" can then be rapidly displayed. Using OpenGL display routines, Lightscape takes full advantage of the advanced 3D graphics capabilities of SGI workstations or PC-based OpenGL-compliant graphic acceleration boards. Lightscape allows you to interactively move through fully simulated environments. Progressive RefinementLightscape utilizes a progressive refinement radiosity algorithm that produces useful visual results almost immediately upon processing. The quality of the visualization improves as the process continues. In this way, the user has total control over the quality (vs. time) desired to perform a given task. At any point in the solution process, users can alter the characteristic of a light source or surface material and the system will rapidly compensate and display the new results without the need for restarting the solution. This flexibility and performance allow users to rapidly test various lighting and material combinations to obtain precisely the visual effect desired. There are four tests specified by the viewset that represent
the most common operations performed by the Lightscape Visualization System:
Pro/Engineer Viewset (proe-01)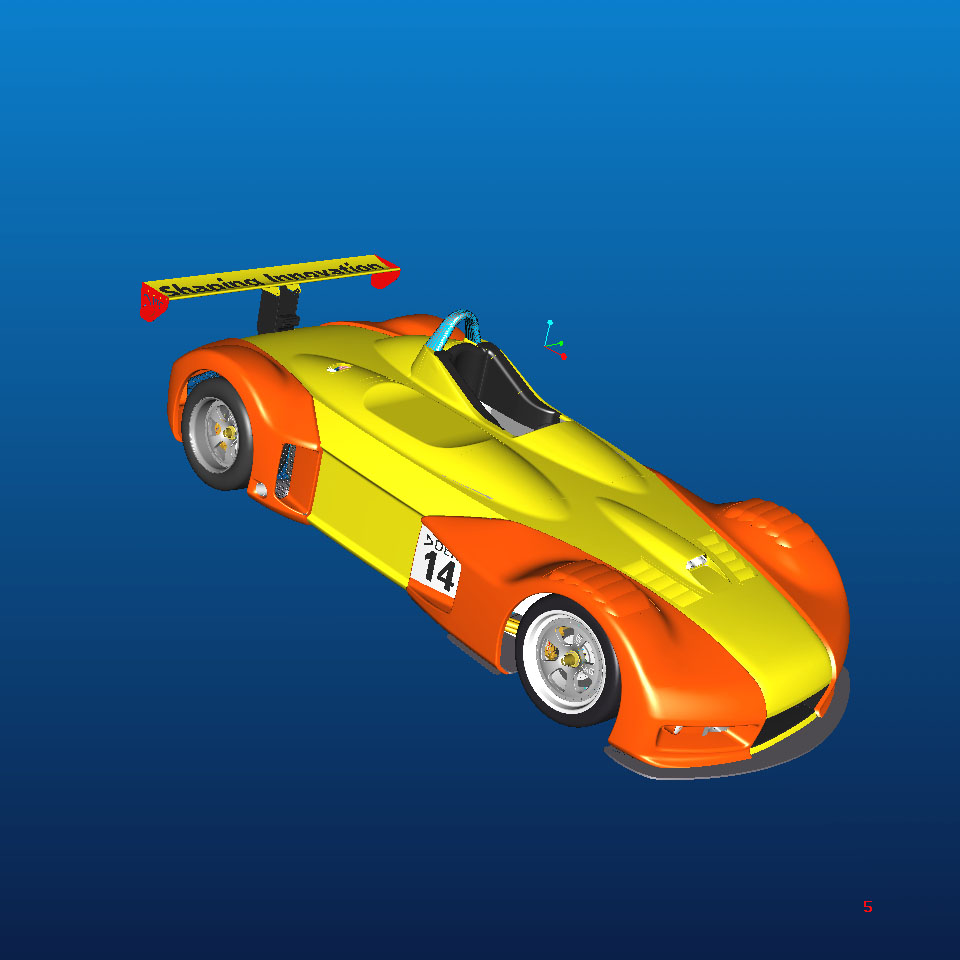 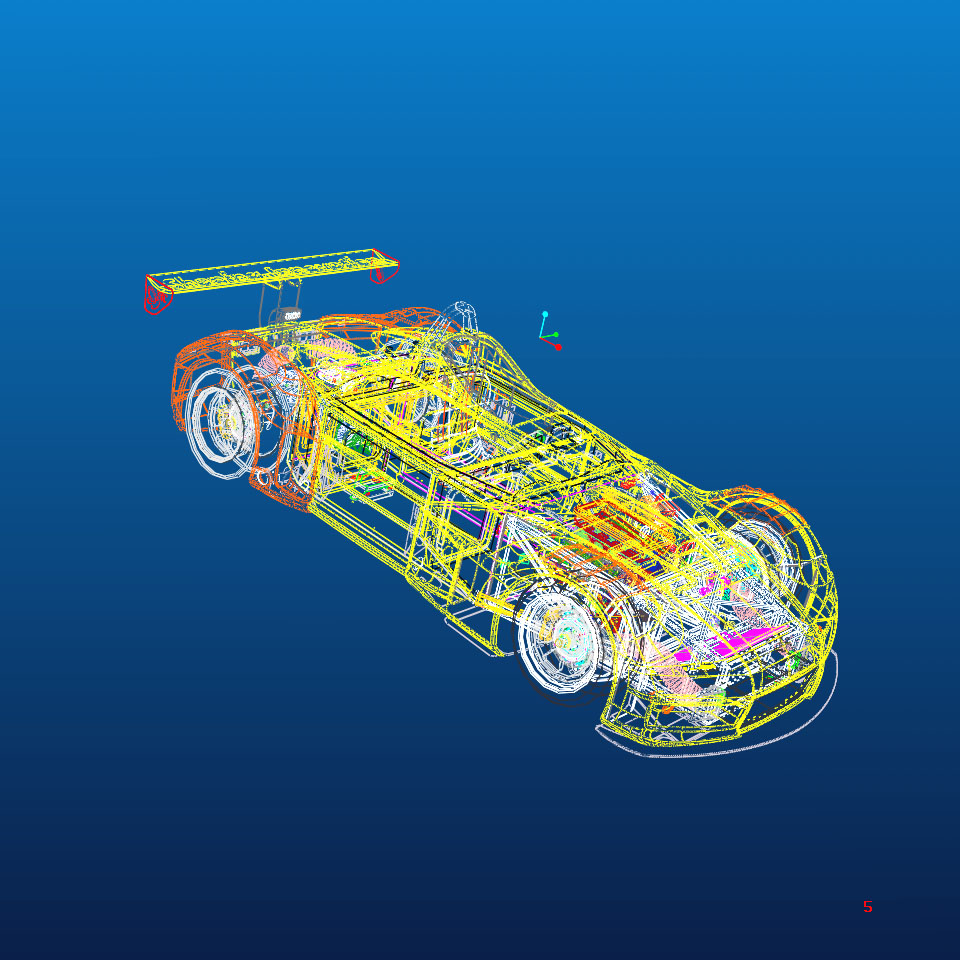 The proe-01 viewset was created from traces of the graphics workload generated by the Pro/ENGINEER 2001 application from PTC. Two models and three rendering modes are measured during the test. PTC contributed the models to SPEC for use in measurement of the Pro/ENGINEER application. The first of the models, the PTC World Car, represents a large model workload composed of 3.9 to 5.9 million vertices. This model is measured in shaded, hidden-line removal, and wireframe modes. The wireframe workloads are measured both in normal and antialiased mode. The second model is a copier. It is a medium-sized model made up of 485,000 to 1.6 million vertices. Shaded and hidden-line removal modes were measured for this model. This viewset includes state changes as made by the application throughout the rendering of the model. For example, the PTC World Car shaded frames include more than 100 MBytes of state and vertex information per frame. Examples of the included state are matrix changes, material, light state, line stipple, etc. All state changes are derived from a trace of the running application. The state changes put considerably more stress on graphics subsystems than the simple geometry dumps found in older viewsets. Mirroring the application, draw arrays are used for the shaded tests and immediate mode is used for the wireframe. The gradient background used by the Pro/E application is also included to better model the application workload. Tests are weighted 1/3 wireframe and 2/3 shaded.
Unigraphics Viewset (ugs-01)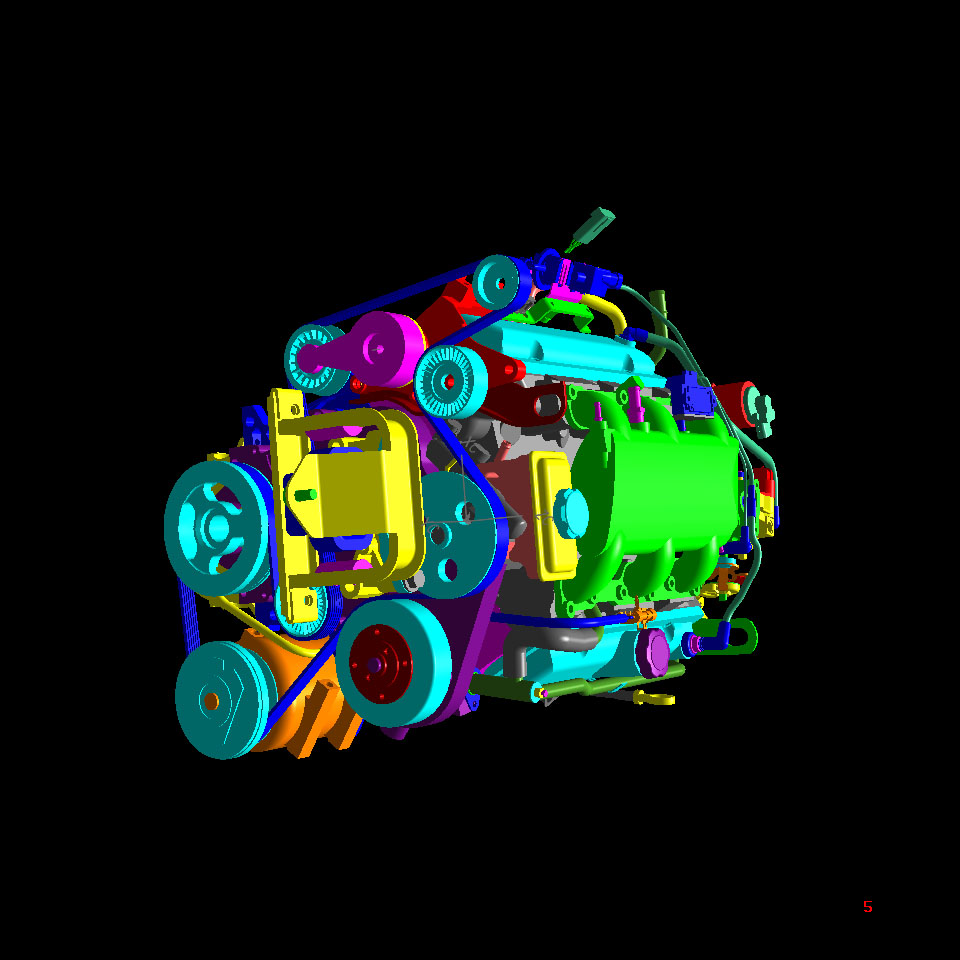  The ugs-01 viewset was created from traces of the graphics workload generated by Unigraphics V17. The engine model used was taken from the SPECapc for Unigraphics application benchmark. Three rendering modes are measured -- shaded, shaded with transparency, and wireframe. The wireframe workloads are measured both in normal and antialised mode. All tests are repeated twice, once rotating in the center of the screen and then moving about the frame to measure clipping performance. The viewset is based on a trace of the running application and includes all the state changes found during normal Unigraphics operation. As with the application, OpenGL display lists are used to transfer data to the graphics subsystem. Thousands of display lists of varying sizes go into generating each frame of the model. Tests are weighted 1/3 wireframe and 2/3 shaded.
The following cards were used in the tests:
Apart from these main accelerators I also used NVIDIA GeForce 3 and NVIDIA GeForce 4 4600 based cards, as well as SoftQuadroDCC and SoftQuadro 4 900 XGL models. The testbed is based on the Pentium 4 2200 MHz:
The additional platform is based on the Pentium III 1000 MHz:
None of the cards failed in the tests, and none of the tests hung. All the tests were carried out under the Windows XP Professional. We installed drivers on the virgin operating system and then fulfilled the tests. For the Quadro and GeForce lines we used the drivers 28.32, for the FireGL 2 - ver.20.82, for the FireGL 8800 - ver.30.30 and finally for the Wildcat - ver.06.05.03.2. Everywhere in the drivers, where it was possible, we disabled vsync. And here are the scores.  The Quadro 4 line has a very good potential. Although the scores are quite low in general, the cards on this chip are leading. The low scores mean just that this test makes all cards work at their full capacity. Below you will see additional tests which make details clear. 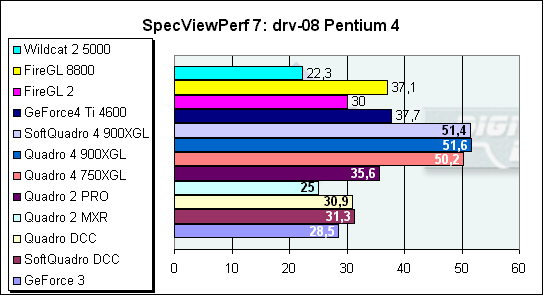 The Quadro 4 based cards are the best again. As you can see, the SoftQuadro goes almost on a par with the Quadro 4, and the SoftQuadro DCC is even a bit more efficient than the current Quadro DCC. The ATI cards stick to the golden mean - between the flagship and the junior models from NVIDIA. The Wildcat showed nothing interesting here.  This test is much tougher for the game accelerators. The difference
between the professional cards and gaming ones is well seen. The results are predictable.
The newly released cards are doubtless winners. The technological progress is
on all its glory! :) 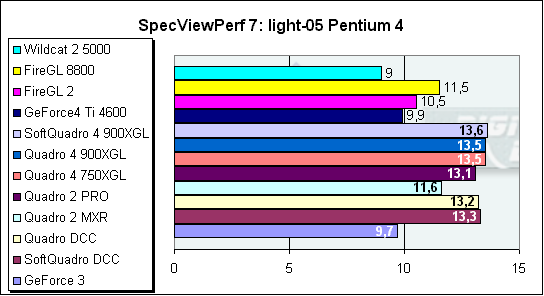 This very beautiful test gives a real chance to the other cards. But the situation hasn't changed in general.  In this test the figures look much better. The test is more modern - the overall load on the accelerators has increased, and fps has fallen a tad. The palm goes to the ATI's FireGL 8800.  The SpecViewPefr is not a gaming test. And the game cards and the SoftQuadro have nothing to oppose to their elder siblings. The Quadro 4 900XGL remains the leader. The FireGL 8800 is beside it. To find out how strong is the effect of the processor on the
results I tested the NVIDIA's line on a weaker computer. Why the Quadro? Because
this line is the most complete in our lab. I used the previous-generation processor
clocked at 1 GHz. Here are the scores:  The results mean that scalability of this test is excellent. The more powerful the card, the better the score.  In this test more powerful cards are weaker than the weaker ones because the former models stand idle waiting for a new portion of data from the processor.  This test is again processor-independent and well scalable.  This is the most beautiful test which gives a chance to all cards. Look at the results of the senior accelerators. Starting from the Quadro DCC the whole operation depends on a processor. In this test only the weakest accelerators depend on an accelerator. This is the most processor-dependent test.  Here the processor's effect is not huge.  Likewise, the processor doesn't have a great effect. ConclusionThis is a worthy test for worthy cards. The developers of this
version of the SPECviewperf have reached the balance which defines quality and
speed of operation of the card. The test doesn't depend much on a processor making
video accelerators work. The new algorithms and optimizations of the tests show
the following layout. The NVIDIA's Quadro 4 based cards excel. The ATI FireGL
8800 is somewhere close to them; it is followed by the FireGL 2 and then by
all the rest which perform shoulder to shoulder. The game cards show that they
are not able to cope with tasks meant for professional use.
Write a comment below. No registration needed!
|
Platform · Video · Multimedia · Mobile · Other || About us & Privacy policy · Twitter · Facebook Copyright © Byrds Research & Publishing, Ltd., 1997–2011. All rights reserved. |


