 |
||
|
||
| ||
|
||
|
||
| ||
"There is such term as Art of Testing"
 CONTESTS
General informationAs we mentioned it lots of times, the release of the new API DirectX 9.0 couldn't pass unnoticed, especially because there is a line of video cards supporting DX9. The first part is devoted to testing the line consisting of 5 cards in a great deal of gaming benchmarks (none of them is able to work under the DX9 yet, that is why it was mostly the estimation of the R9500-9700 line as a whole). But before will you have a look at the reviews dealing with the RADEON 9500-9700 video cards. Theoretical materials and reviews of video cards which concern functional
properties of the VPU
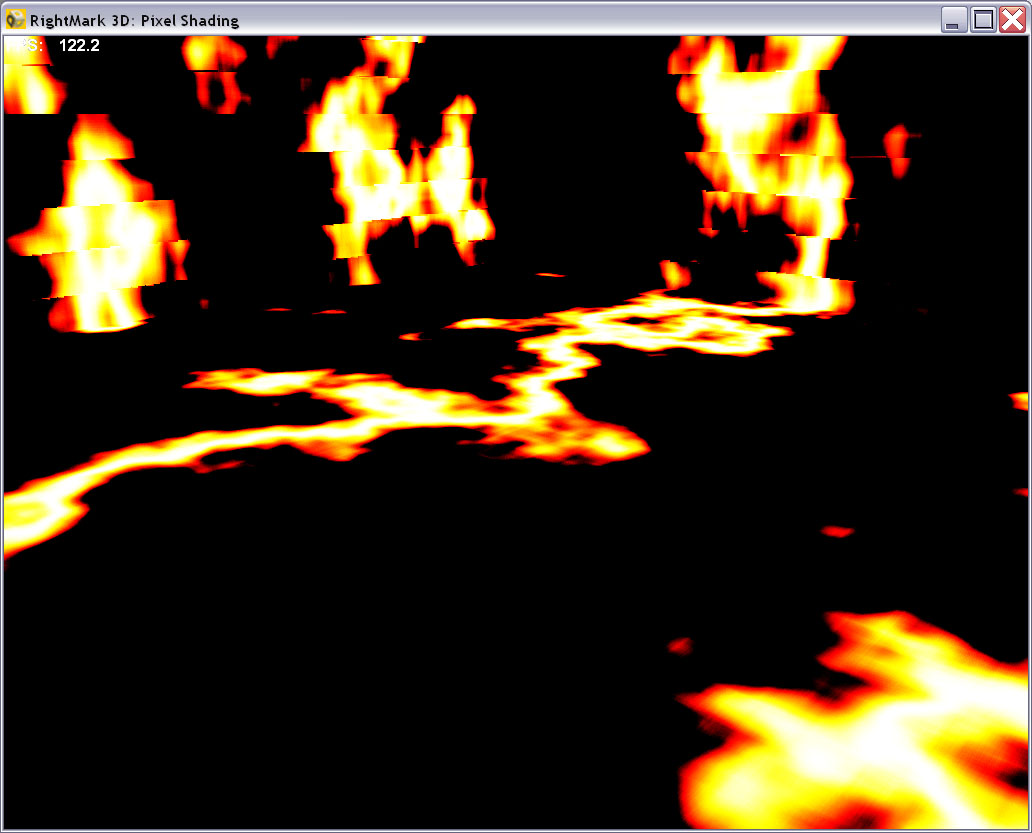
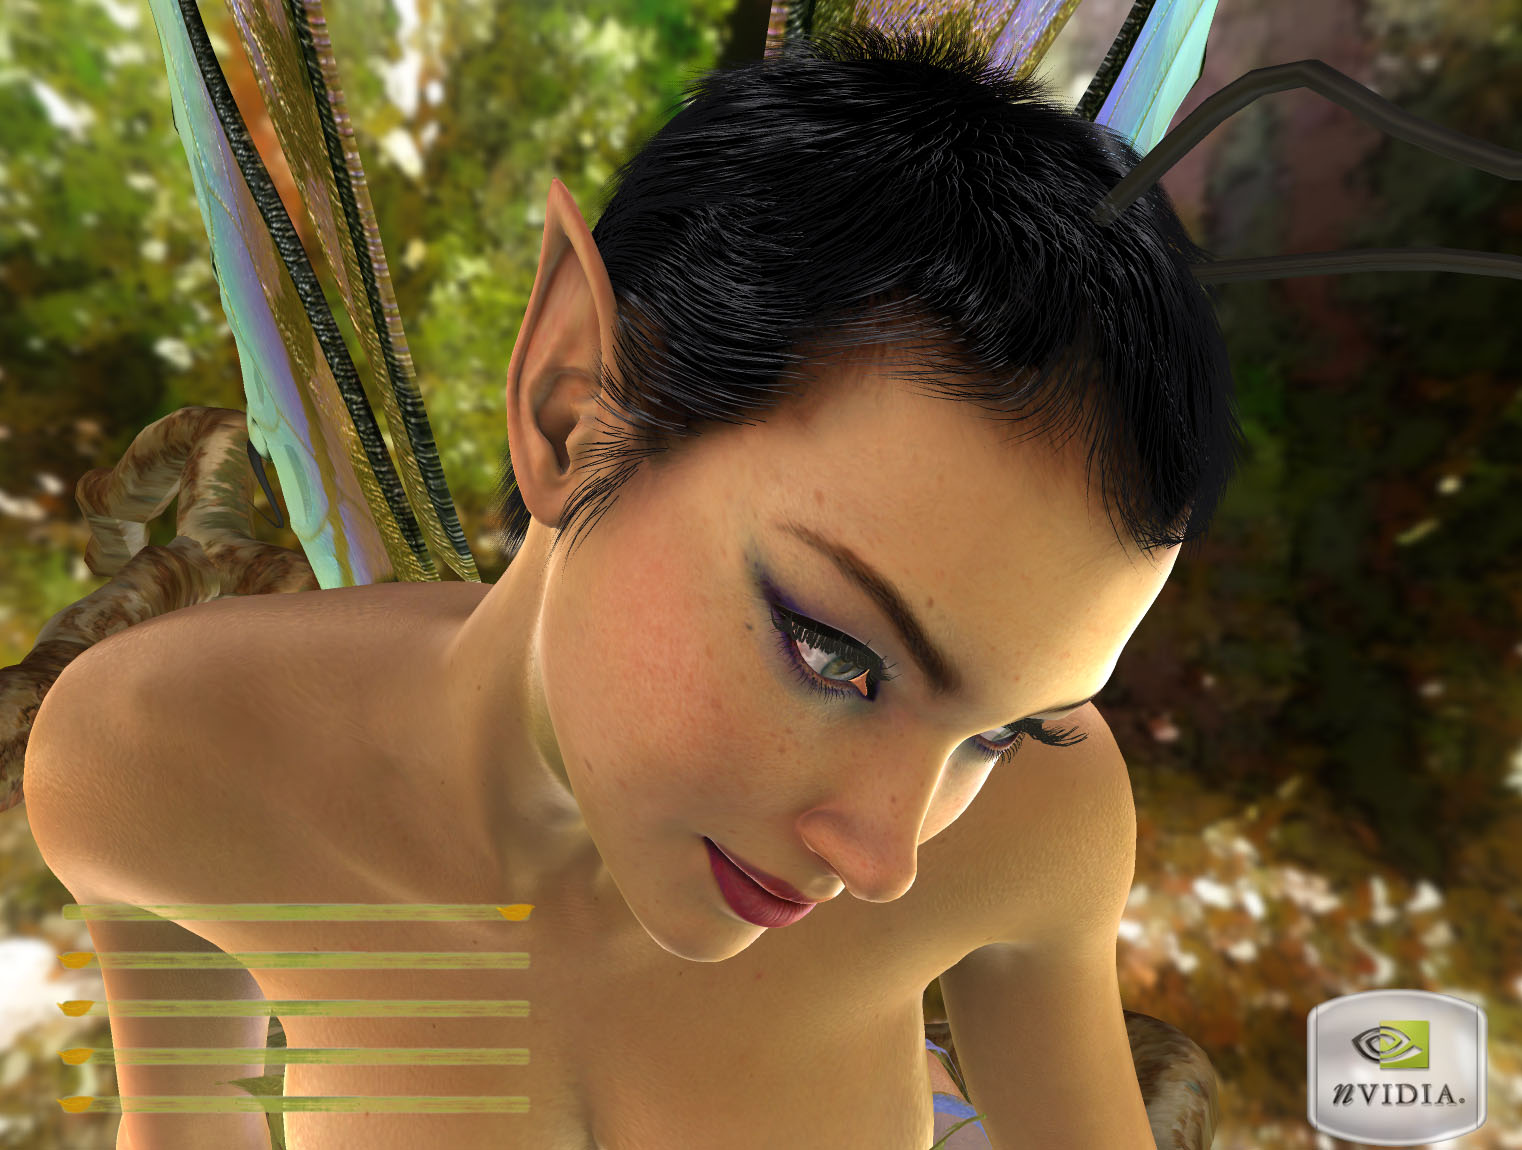
Today we will study the cards tested in some synthetic tests from the new RightMark3D packet which will soon be brought to the Internet medium (a fragment of one of the test scenes is shown above). This packet is meant for DX9 cards though some tests can run on the DX81 cards as well. Here are the price niches the cards belong to:
All the cards are given a detailed description to in the first park. New synthetic tests for DX9Today we will describe and obtain the first test results with the suite of synthetic tests we are currently developing for the API DX9. The test suite from the RightMark 3D which is under development now includes the following synthetic tests at this moment:
Today we will deal with the first five tests and estimate data obtained on the ATI's and NVIDIA's accelerators. So, we have two aims - to estimate performance of the accelerators under the API DX9 and performance of the RightMark 3D synthetic tests in different situations. The last item is important to reveal the degree of applicability, repeatability and soundness of results of our synthetic tests that we are going to use widely for benchmarking various DX9 accelerators and make available for free download for our readers and all enthusiasts of computer graphics. But first of all, there is a small digression about the ideological test issues: Philosophy of the synthetic testsThe main idea of all our tests is focusing on performance of one or another chip's subsystem. In contrast to real applications which measure effectiveness of accelerator's operation in one or another practical application integrally, synthetic tests stress on separate performance aspects. The matter is that a release of a new accelerator is usually a year away from applications which can use all its capabilities effectively. Any those users who want to be on the front line with technology have to buy one or another accelerator almost blindly, warmed only with results of the tests carried out on outdated software. No one can guarantee that the situation won't change with the games they are waiting for. Apart from such enthusiasts which take such risk, there are some other categories of people in such a complicated situation:
So, synthetic tests allow estimating performance and capabilities of separate subsystems of accelerators in order to forecast accelerator's behavior in some or other applications, both existing (overall estimation of suitability and prospects for a whole class of applications) and developing, provided that a given accelerator demonstrates peculiar behavior under such applications. Description of the RightMark 3D synthetic testsPixel FillingThis test has several functions, namely:
The test draws a pyramid whose base lies in the monitor's plane and the vertex is moved away to the maximum: 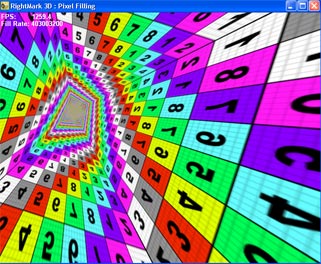 Each of its four sides consists of triangles. A small number of triangles allows to avoid dependence on geometrical performance which has nothing to do with what is studied. 1 to 8 textures are applied to each pixel during filling. You can disable texturing (0 textures) and measure only the fill rate using a constant color value. During the test the vertex moves around at a constant speed, and the base rotates around the axis Z:  So, the pyramid's sides take all possible angles of inclination in both planes, and the number of shaded pixels is constant and there are all possible distances from the minimal to the maximum. The inclination of the shaded plane and the distance to the shaded pixels define many filtering algorithms, in particular, anisotropic filtering and various modern realizations of trilinear filtering. By rotating the pyramid we put the accelerator in all conditions which can take place in real applications. It allows us to estimate the filtering quality in all possible cases and get weighted performance data. The test can be carried out in different modes - the same operations can be accomplished by shaders of different versions and fixed pipelines inherited from the previous DX generations. That is why you can find out the performance gap between different shader versions. A special texture with different colors and figures eases investigation of quality aspects of the filtering and its interaction with full-screen anti-aliasing. Mip levels can have different colors: 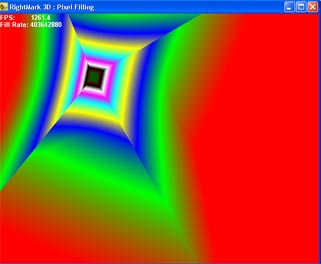 so that you can estimate the algorithm of their blending and selection. Here are the adjustable test parameters:
The test gives its results in FPS and FillRate. The latter plays two roles. In the no-texture mode we measure exactly the frame buffer write speed. In this respect, this parameter defines the number of pixels filled in per second - Pixel FillRate. In the texture mode it indicates the number of sampled and filtered texture values per second (Texturing Rate, Texture Fill Rate). Here is an example of a pixel shader used for filling in case of the most intensive version of this test (PS/VS 2.0, 8 textures): ps_2_0 dcl t0
dcl_2d s0
texld r0, t0, s0
mov r11, r0
mov oC0, r11 Geometry Processing SpeedThis test measures the geometry processing speed in different modes. We tried to minimize the influence of filling and other accelerator's subsystems, as well as to make geometrical information and its processing as close to real models as possible. The main task is to measure the peak geometrical performance in different transform and lighting tasks. At present, the test allows for the following lighting models (calculated at the vertex level):
The test draws several samples of the same model with a great number of polygons. Each sample has its own parameters of geometrical transformation and relative positions of light sources. The model is extremely small (most polygons are comparable or smaller than a screen pixel): 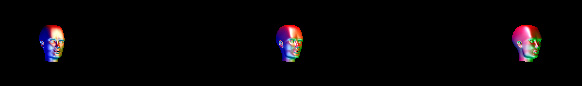 thus, the resolution and filling do not affect the test results: 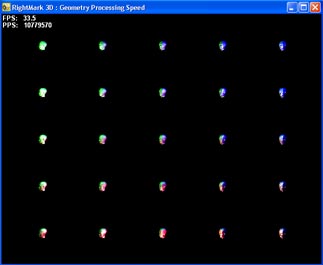 The light sources move in different directions during the test to underline various combinations of the initial parameters. There are three degrees of scene detailing - they influence the total number of polygons transformed in one frame. It's necessary to make sure that the test results do not depend on a scene and fps at all. Here are the adjustable test parameters:
The test results are available in FPS and PPS (Polygons Per Second). Here is an example of a vertex shader (VS 2.0) used for transformation and calculation of lighting according to quantity of diffuse-specular lights set externally in this test: vs_2_0 dcl_position v0
//
m4x4 oPos, v0, c16 //
m4x4 r10, v0, c8 // transform position to world space
nrm r7, r0 // normalize normal add r0, -r10, c2 // get a vector toward the camera position nrm r6, r0 // normalize eye vector mov r4, c0 // set diffuse to 0,0,0,0 mov r2, c0 // setup diffuse,specular factors to 0,0
//
loop aL, i0 add r1, c[40+aL], -r10 // vertex to light direction
dst r9, r0.wwww, r1.wwww // (1, d, d*d, 1/d)
mul r1, r1, r1.w // normalize the vertex to the light vector add r0, r6, r1 // calculate half-vector (light vector + eye vector) nrm r11, r0 // normalize half-vector dp3 r2.x, r7, r1 // N*L
sge r3.x, c[80+aL].y, r9.y // (range > d) ? 1:0
lit r5, r2 // calculate the diffuse & specular
factors
mul r0, r5.y, c[30+aL] // calculate diffuse color
mul r0, r5.z, c[60+aL] // calculate specular
color
endloop mov oD0, r4 // final color Hidden Surface RemovalThis test looks for techniques of removal of hidden surfaces and pixels and estimates their effectiveness, i.e. effectiveness of operation with a traditional depth buffer and effectiveness and availability of early culling of hidden pixels. The test generates a pseudorandom scene of a given number of triangles: 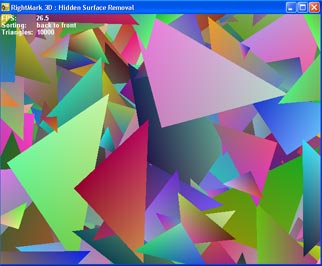 which will be rendered in one of three modes:
In the second case the test renders all pixels in turn, including hidden ones, in case the accelerator is based on the traditional or hybrid architecture (a tile accelerator can provide optimization in this case as well, but remember that the sorting will take place anyway, even though on the hardware or driver levels). In the first case the test can draw only a small number of visible pixels and the others can be removed yet before filling. In the third case we have some sort of a middle similar to what the HSR mechanism can encounter in real operations in applications that do not optimize the sequence of scene displaying. To get an idea on the peak effectiveness of the HSR algorithm it's necessary to collate the results of the first and second modes (the most optimal first mode with the least convenient second one). The comparison of the optimal mode with the unsorted one (i.e. the first and third) will give us an approximate degree of effectiveness in real applications. The scene rotates around the axis Z in the test to smooth away any potential peculiarities of different early HSR algorithms which are primarily based on the frame buffer zoning. As a result, the triangles and their verges take all possible positions. You can also change the number of rendered triangles to see how the test depends on other chip's subsystems and drivers. We can expect improvement of the results as the number of triangles grows up, but on the other hand, the growth is justified only up to a certain degree after which the influence of other subsystems on the test can start going up again. That is why this parameter was brought in to estimate quality of the test regarding the number of triangles. Here are the adjustable parameters:
Pixel ShadingThis test estimates performance of various pixel shaders 2.0. In case of PS 1.1 the speed of execution of shaders translated into the stage settings could be easily defined, and it was needed to have only a test like Pixel Filling carried out with a great number of textures, in case of PX 2.0 the situation looks much more complicated. Instruction per clock execution and new data formats (floating-point numbers) can create a significant difference in performance not only when the accelerator architectures differ, but also on the level of combination of separate instructions and data formats inside one chip. We decided to use an approach similar to the CPU benchmarking for testing performance of pixel processors of modern accelerators, i.e. to measure performance of the following set of pixel shaders which have real prototypes and applications:

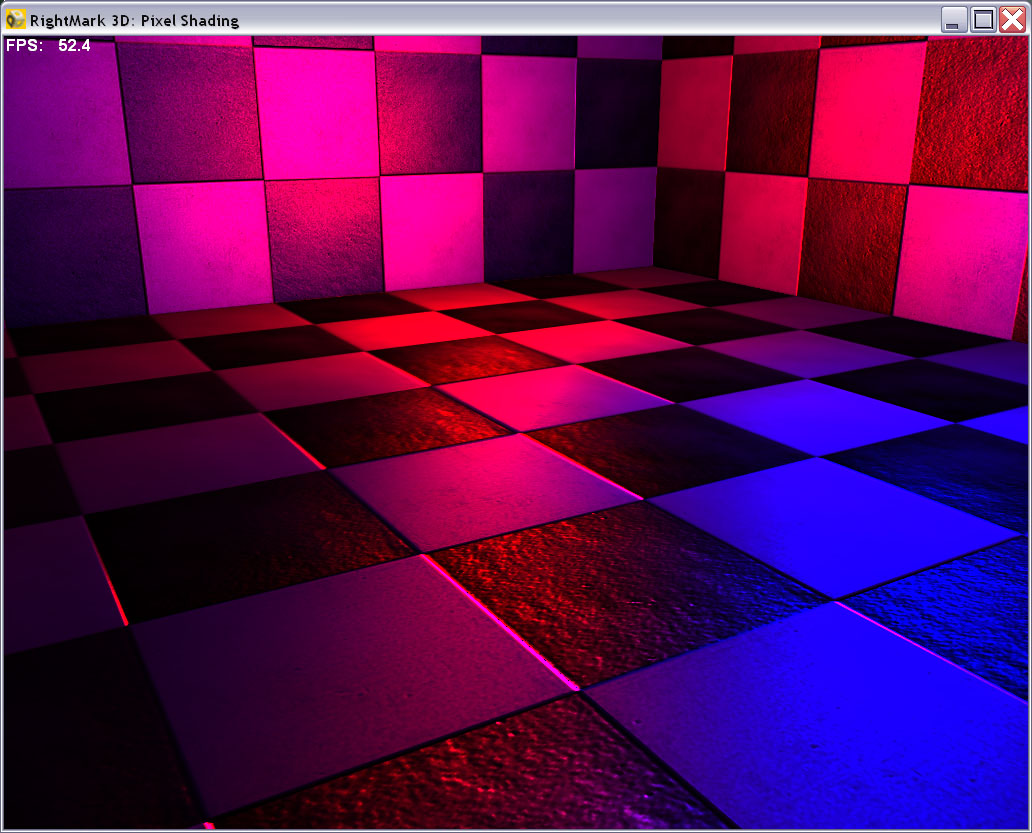
 Two last tests implement the procedure textures (pixel color values are calculated according to a certain formula) which are an approximate mathematical model of the material. Such textures take little memory (only comparatively small tables for accelerated calculation of various factors are stored there) and support almost infinite detailing! They are easy to animate by changing the basic parameters. It's quite possible that future applications will use exactly such texturing methods as capabilities of accelerators will grow. The geometrical test scene is simplified, and dependence on the chip's geometrical performance is almost eliminated. Hidden surface removal is absent as well - all surfaces of the scene are visible at any moment. The load is laid only on the pixel pipelines. Here are adjustable parameters:
Below are the codes of some shaders. Per-pixel diffuse with per-pixel attenuation for 2 light sources: ps_2_0 //
dcl t0 // Diffuse Map
dcl t3.xyzw // Position (World Space) dcl t4.xyzw // Tangent
//
dcl_2d s0 // Sampler for Base Texture
//
texld r1, t1, s1
//
// Attenuation add r3, -c0, t3 // LightPosition-PixelPosition
// Light Direction to Tangent Space mul r3, r3, r5.x // Normalize light direction dp3 r8.x, t4, -r3 // Transform light direction to tangent space
// Half Angle to Tangent Space add r0, -t3, c25 // Get a vector toward the camera
add r0, r11, -r3 // Get half angle
// Diffuse dp3 r2.x, r1, r8 // N * L
mul r9, c10, r9.x // * Light Color // Specular dp3 r2.x, r1, r7 // N * H
mul r10, c12, r10.x // * Light Color //
// Attenuation add r3, -c1, t3 // LightPosition-PixelPosition
// Light Direction to Tangent Space mul r3, r3, r5.x // Normalize light direction dp3 r8.x, t4, -r3 // Transform light direction to tangent space
// Half Angle to Tangent Space add r0, -t3, c25 // Get a vector toward the camera
add r0, r11, -r3 // Get half angle
dp3 r7.x, t4, r11 // Transform half angle to tangent space
// Diffuse dp3 r2.x, r1, r8 // N * L
mad r9, c11, r2.x, r9 // * Light Color // Specular dp3 r2.x, r1, r7 // N * H
mad r10, c13, r2.x, r10 // * Light Color //
texld r0, t0, s0
mul r9, r9, r0 // Diffuse Map
// Finalize mov oC0, r9 Fire procedure texture: ps_2_0 def c3, -0.5, 0, 0, 1
dcl v0 dcl t0.xyz
dcl_volume s0
texld r0, t0, s0
Point SpritesThis test measures performance of just one function: displaying of pixel sprites used for creating systems of particles. The test draws an animated system of particles resembling a human body: 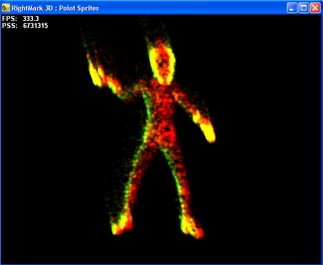 We can adjust a size of the particles (which will affect the fillrate), enable and disable light processing and animation. In case of a system of particles geometry processing is very important, that is why we didn't separate these two aspects - filling and geometrical calculations (animation and lighting) but made possible to change a load degree of one or another body part by changing sprite size and switching on/off their animation and lighting. Here are adjustable parameters:
Stay with usIn the near future we will finish debugging and publish the first results of the 7th test which, first of all, measures quality of the drivers and how effectively data and parameters are delivered to the accelerator. Soon all synthtic tests will be able to use not only Assembler shader versions but also those which are compiled from a higher-level language with the Microsoft (HLSL) compiler and the NVIDIA's one - CG+CGFX. The most pleasant event is the approaching release of the first beta version of the RightMark 3D packet. In the beginning the first beta version will provide only synthetic tests for free use. Practical estimationNow comes the most interesting part where we will show and comment the data obtained on the accelerators of two main families - ATI RADEON 9500/9700 and NVIDIA GeForce 4 4200/4600. Test system and driversTestbed:
In the tests we used ATI's drivers 6.255 (CATALYST 3.0a), DirectX 9.0. VSync was off in the drivers. The results of the following video cards are used for comparison:
Pixel Filling
 As the resolution grows up, the scores of the top RADEONs based on R300 are increasing coming close to the theoretical level. The NV25 based solutions get frozen at the certain level starting from 1024x768 apparently determined by the memory bandwidth (or rather its shortage). The losses connected with AA are less dramatic of the senior RADEONs, but they are greater of the RADEON 9500 even as compared with the aging NVIDIA's solutions. Interestingly, for the AA modes the ATI's solutions have optimal performance at 1280x1024, after which the frame buffer affects badly because even when twice compressed at MSAA 4x takes a lot of memory.  The picture looks similar, though the peak values are lower. Let's see how the measured data correlate with the theoretical limits calculated with the core frequency and number of pipelines:
The test results are very close to the theoretical maximum values, which proves the test's appropriateness. Note that the NVIDIA's solution are much closer to the maximum than the ATI. The competitive stream affected the RADEON 9500 PRO most of all because of the scarce memory throughput and only two controllers, as a result, the local bus overflows. The GeForce4 Ti 4600 shines in this test.  While NVIDIA performs well, at least, up to 4 textures can be applied in a pass, the ATI's solutions decrease their performance a bit as the number of textures go up, which is typical of the new generation. Now instead of the stages we have a pixel pipeline, that is why each new texture costs a new instruction.
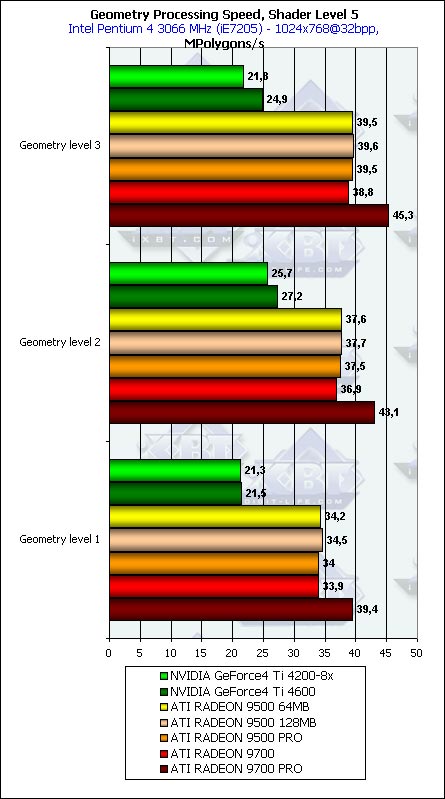
It's well seen that in case of a great number of textures (future applications) ATI doesn't depend much on memory (compare the last column for 9500 PRO and 9700), but is affected much by the number of pipelines and core's clock speed; it's clear that it's needed to enable the pipelines and overclock the core.  The results remain almost the same - all the chips are optimized for 32-bit textures long ago and unpack compressed textures without any delays. But in future reviews, including the GeForce FX, we will take a look at comparatively new floating-point formats of the rendering and texture buffer, where we can have a real surprise (considering the influence of the format on the processing speed). 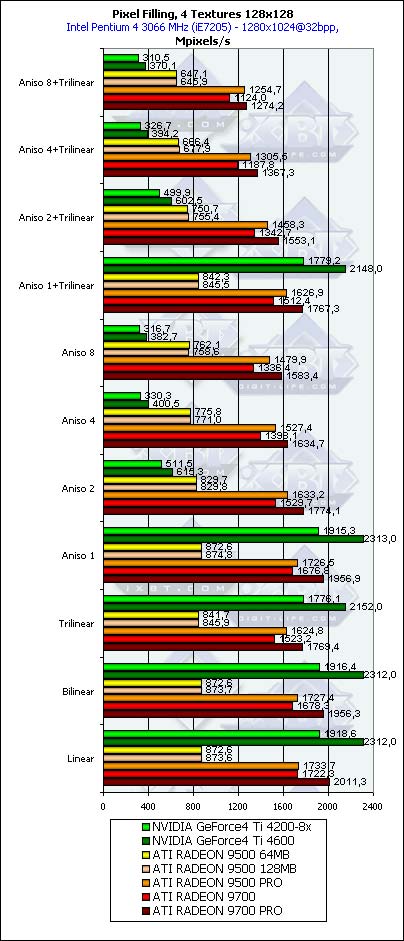 With the significant anisotropy settings the NVIDIA's solutions start losing their performance. It was discussed in depth in our previous reviews. What I want to say is that our test showed quite expected results. Soon we will see how the GeForce FX works in the anisotropy mode. Geometry Processing Speed
 The chips show repeatable, peak performance results. The ATI's scores do not depend on the shader version (or T&L hardware emulation - on the FFT (Fixed Function Transformation) diagram). 104 million vertices per second is quite a lot. This figure nicely correlates with the peak value given by ATI. Note that the results depend only on the core's performance, that is why in none of the junior R300 based models the performance of geometrical processes is not understated. The hardware emulation of T&L of the NVIDIA's products is a bit more effective than the similar, actually microscopical (2 instructions - multiplication of matrices 4x4 and one copying of the result) vertex shader. Note also that the NVIDIA's products lose markedly because of only two vertex processors against 4 of ATI. So, the test showed the unprecedented results (at least, in the version of 3D Mark 2001) making the gap between the specified and obtained performance.  Now the T&L hardware emulation of ATI is less efficient than the vertex shader 1.1. And it's comparable in performance with the VS 2.0. As you can see, the second version is not free at all - the loops used cause the performance drop. Moreover, the drop is greater than we could expect from one loop instruction per several tens of usual instructions. Especially considering that the loops on the R300 are unrolled into a linear shader code by the chip's drivers, such losses look really strange. Here is the first question for the ATI drivers developers. Is everything OK, and if it is, then what causes the performance drop? It's also unclear why the RADEON 9700 falls behind all versions of the 9500 (marginally but constantly) but only in the fixed T&L (FFT) emulation modes and in the VS 1.1. Meanwhile, with more complicated shaders the NVIDIA's solutions perform better, especially in the hardware T&L (FFT) emulation modes - NVIDIA is still able to shine with the one-year-old one in new and old games. 
 The picture repeats, except the fact that here the FFT performs better for both than the vertex shader. The RADEON 9700 keeps on performing strangely. 
  Almost no dependence, only a bit of it on the simplest model, in the highest resolution. We have checked again the desired fact of precise and narrow focusing of the described synthetic tests. 
 Nothing strange except the expected performance drop during the software emulation of VS 2.0 on the NV25 based solutions which do not support this version on the hardware level. 
  As expected, the more polygons in a model, the higher the scores, but the dependence is quite weak and starting from the second level we can consider it sufficient. It's interesting that the NVIDIA's chips (probably, the vertex caches and other aspects of balancing affect?) reach the optimal results at the middle detail level, while the ATI models keep on growing up - they are meant for more complicated scenes. The difference in the designing time shows that the concept of an ideal scene differs for them. Hidden Surface Removal
 Isn't it shocking? There is more food for thought for owners of the RADEON 9500 which want to increase performance of their cards on the software level. Is there a way to enable 4 pipelines without touching the HSR? Well, we are working on it.
 Even when the scene is originally unsorted, there is some gain. It's seen best of all in case of a small number of polygons. So, if you want to use the benefits of the HSR (though half of the chips have it disabled) you should sort the scene before rendering so that you can get a considerable performance increase (several times). In case of the unsorted scene the HSR makes an effect, but it's intangible (just tens of percents). However, portal applications do sort scenes before rendering, and most modern FPS engines belong to them. That is why the game with HSR is worth the candle and, first of all, for games of this class. So, however that may be, we witness again that the most accelerators tested today have the HSR disabled forcedly. It turns out that when you get the RADEON 9500 and read in its specification about HyperZ or get the GeForce4 Ti 4600 and read about EarlyZ Cull you are deceived. 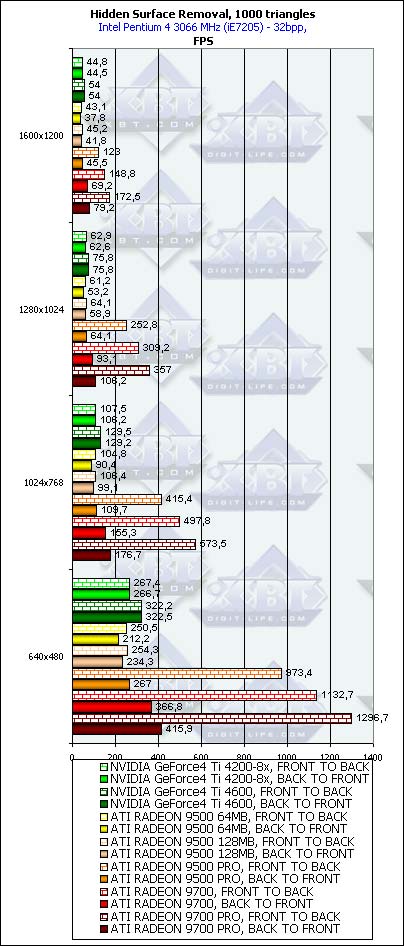
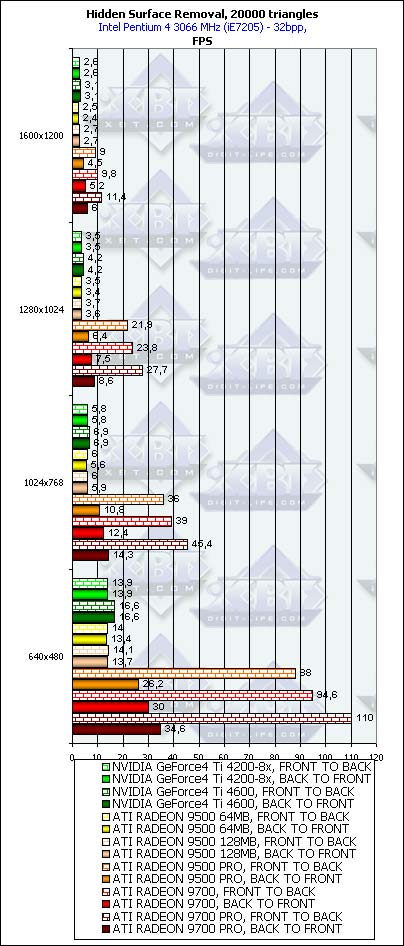 The conclusion is that the HSR works best of all in low resolutions. The explanation is simple - the removed blocks as a rule have a fixed size (say, 8x8), and in higher resolutions the number of blocks to be removed for the same entirely hidden triangle is greater, that is why the HSR effectiveness decreases. This has an effect even in case of the hierarchical buffer of the RADEON. Probably, in future versions of accelerators the developers should use several base block sizes changing them for different resolutions or simply increase this size making users of new accelerators use LCD monitors at, at least, 1280x1024. 
  Pixel ShadingThis test is only for ATI because the hardware support of PS 2.0 is the minimal requirement of this test. On the good old GeForce4 Ti 4600 coupled with the 2 GHz Pentium 4 the software emulation of the PS 2.0 results in approximately one frame per two seconds, in the minimal window.
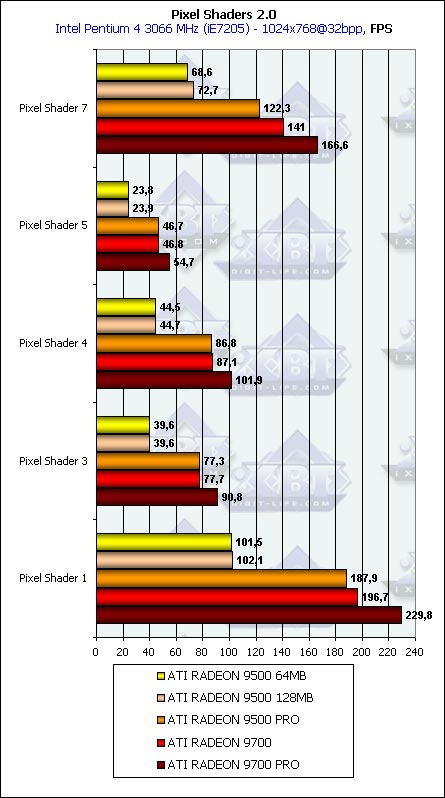 Well, the clock speed and the number of pipelines are on the first place. The memory bus doesn't influence much, and the effect takes place only for some shaders (first and seventh). 200 frames against 0.5 is a good argument at least for those who use pixel shaders of the new version of games. We'll see how the GeForce FX will perform. 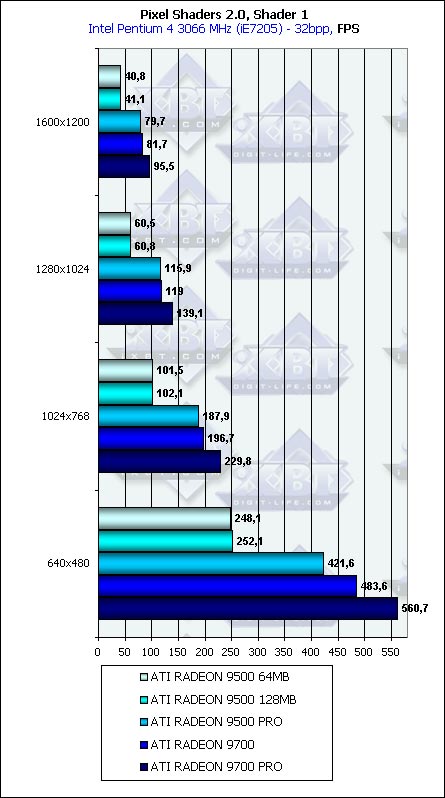
 
 Well, this is a good dependence. The memory bus has almost no effect because of the reasons mentioned above - the main parameters for more or less complicated pixel shaders are core frequency and number of pipelines. The shift from filling to calculations we were promised with the advent of DX9 is well seen. Point Sprites

 As expected, it's noticeable only with small sprites whether lighting is on or off, after that it's limited by the fillrate (starting at the size of 8). So, for rendering systems consisting of a great number of particles the optimal size is less than 8. By the way, NVIDIA performs better in this respect than ATI - the performance drop is not so noticeable, and up to the size of 8 you can consider it monotonous and rather small. ATI loses courage between 4 and 8. The peak values are reached without lighting and come to a bit over 20 million sprites per second for the RADEON 9700 PRO and a bit over 10 for the GeForce4 Ti 4600. At the size of 2 and 4 both ATI and NVIDIA are limited only by the geometrical performance which, in case of simple tasks, must be twice better for ATI. Well, this is what we can witness. Also note that the pixel sprites are not a cure-all at all - the figures are quite close to those which can be obtained with usual polygons. However, pixel sprites are more handy for programmers and, in first turn, for all possible systems of particles.  Well, the contribution of the animation is not great but noticeable, irrespective of the VS version. 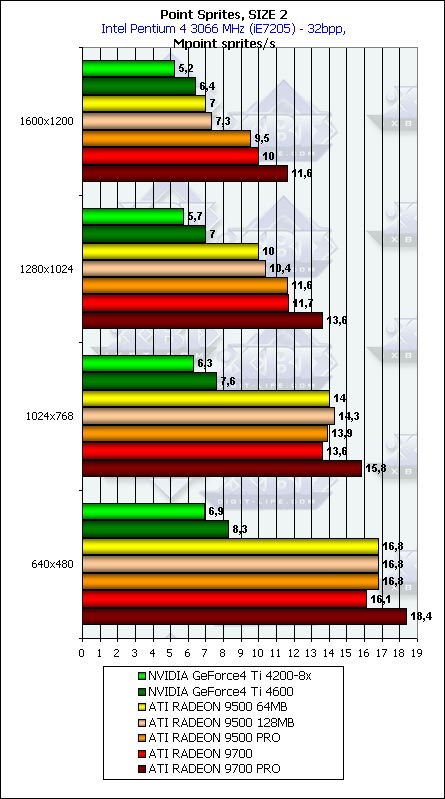
 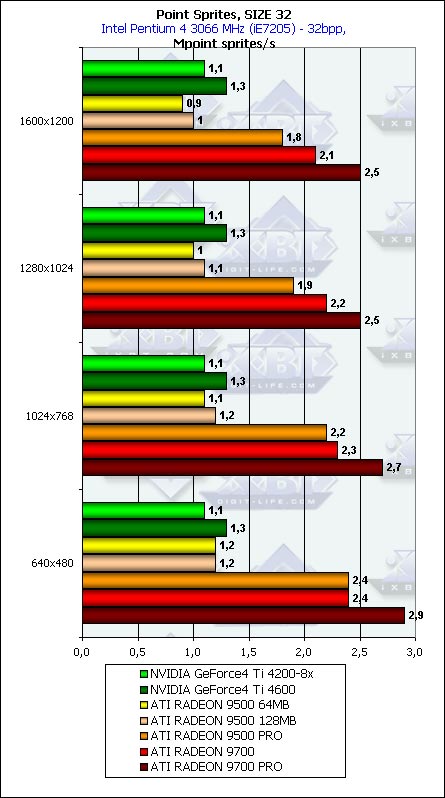 As we expected it, the dependence is insignificant; it is noticeable most of all for small sprites. Well, our first extended tests of the cards in the synthtic benchmarks for API DX9 from the RightMark 3D packet are over. Conclusion
Well, it's not the last time we are testing the RADEON 9500-9700 in DX9, we will return if the new drivers deserve it, and now we are preparing for... 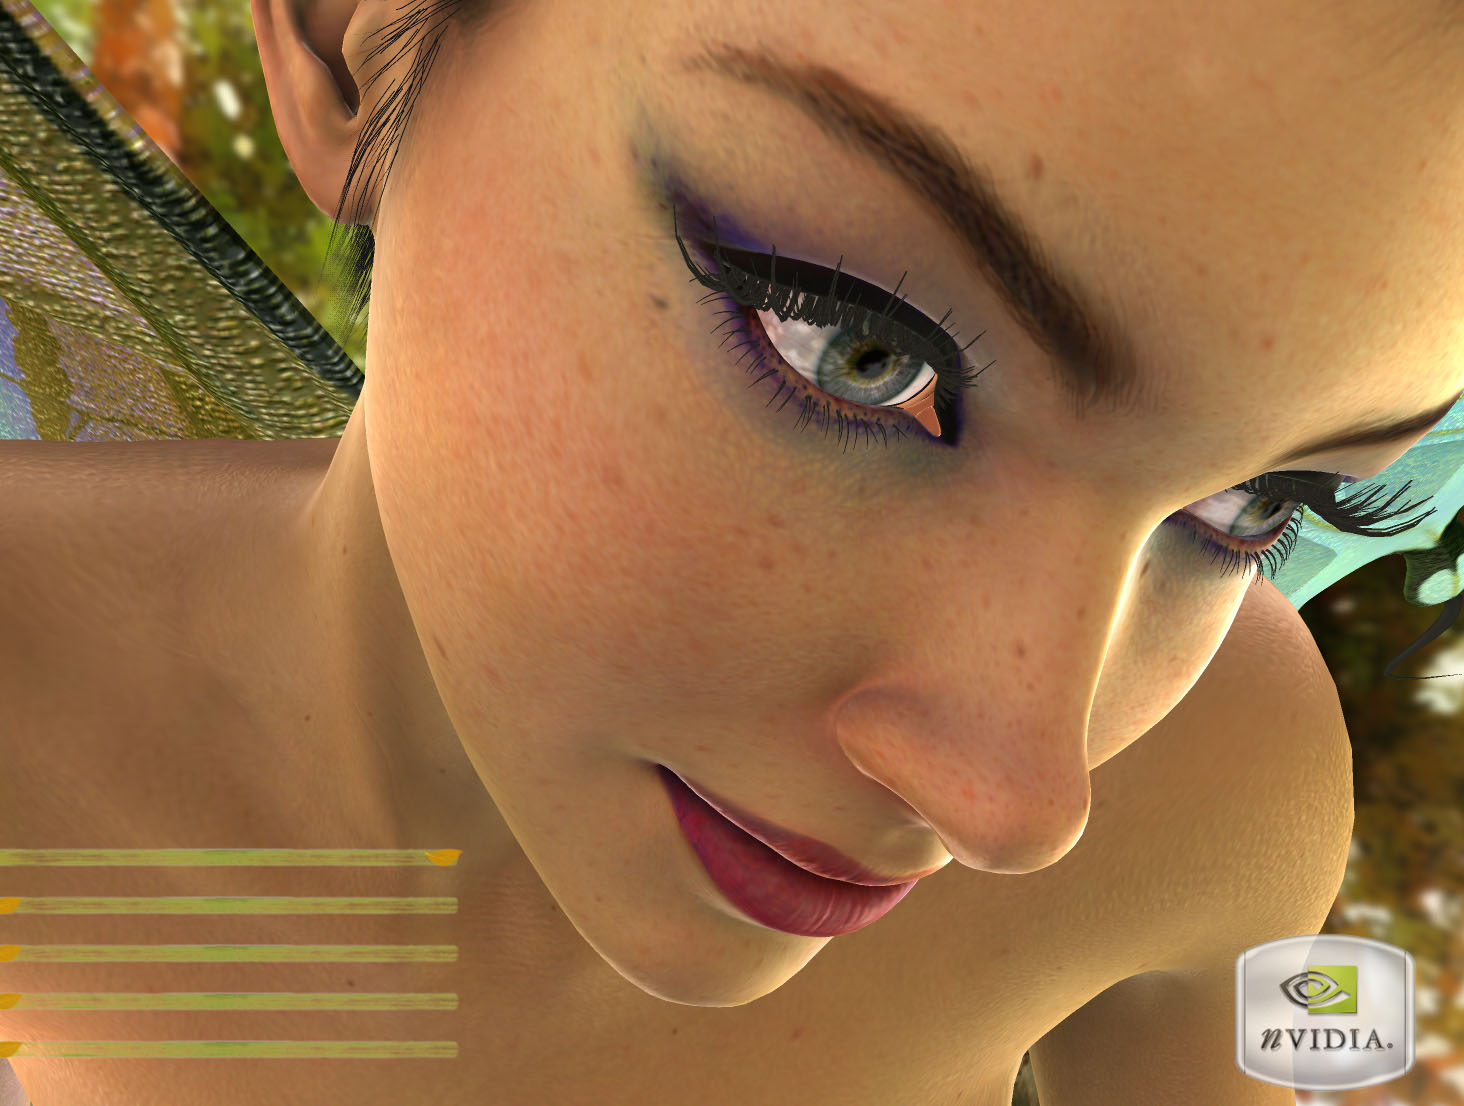
 Well, I think you know what I mean :-)
Write a comment below. No registration needed!
|
|
Platform · Video · Multimedia · Mobile · Other || About us & Privacy policy · Twitter · Facebook
Copyright © Byrds Research & Publishing, Ltd., 1997–2011. All rights reserved.


