 |
||
|
||
| ||
|
||
|
||
| ||
 CONTENTS
Practical TestsNow comes the most interesting part where we will show and comment the data obtained on the accelerators of two main families - ATI RADEON 9700 PRO and NVIDIA GeForce FX 5800 Ultra. The card of the previous generation - GeForce 4 Ti 4600 - is used as a reference one. Pixel Filling
 In theory, the GFFX working at a higher frequency is capable of more things than the RADEON 9700, but the FX outdoes the latter only in the lowest resolution and then the 9700 PRO takes the lead thanks to the greater memory throughput. This also proves the FX's slowdown in the AA mode in low resolution. In all resolutions except the lowest one the difference corresponds to the difference in the peak memory throughput. 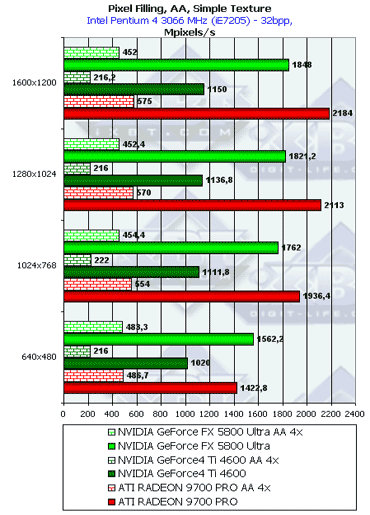 In general, the picture is the same but the peak values are a little lower. Let's see whether the reality goes along with theoretical limits based on the core's frequency and number of pipelines:
So, the GeForce FX uses only half of its potential because of the insufficient memory bandwidth. In fact, it's enough to make a similar chip with the 256bit memory bus to speed up the operation 1.5 times. 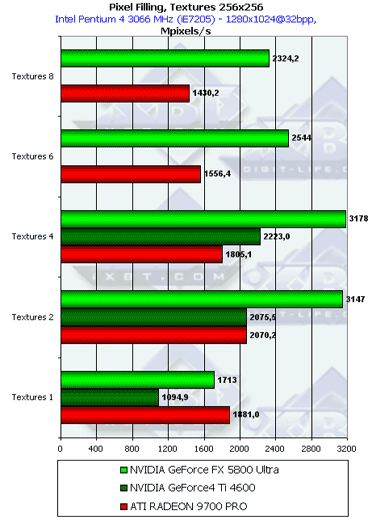 Starting from two textures per pixel (the minimum of all modern games) the efficiency of the NV30 goes up sharply! The optimum is reached with 4 textures, in contrast to the R300 which benefits from 2 textures. Such behavior can be explained. As the number of textures grows up, the sampling and filtering efficiency which depends mostly on the core's frequency has a greater effect. If in case of 1 texture the performance was limited by the frame buffer write speed, in case of two and more the core's clock speed becomes more influencial. Besides, NVIDIA has an original pipelined design of the texture units which provides per-clock return without delays. So, the dynamic pool of the pipelined texture modules is successful - the NV30 leads in texture sampling. However, later we will see whether such performance is affected by the insufficient memory bandwidth in dealing with real applications. Such advantage of the NV30 must have an effect mostly on games with multilevel texturing without multiple pixel calculations, like DOOM III.
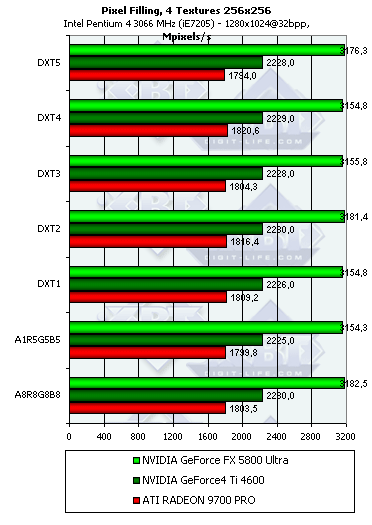 The results remain almost the same - all the chips were optimized for 32-bit textures long ago and unpack compressed textures without any delays. 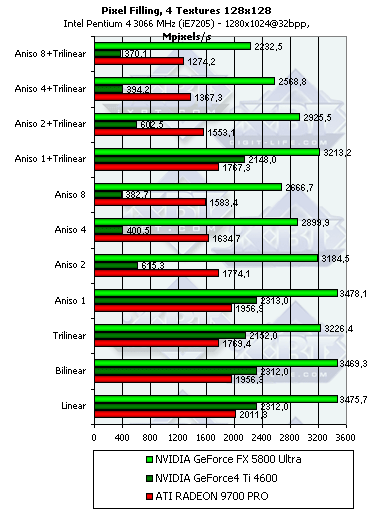 With the significant anisotropy settings the NV25 starts losing its performance. It was discussed in depth in our previous reviews. But the NV30 loses efficiency only a bit faster than the R300. The absolute scores are greater than those of the R300 by the value greater than the gap in the cores' frequencies because of the more effective pipelining in operation of the texture units. The speed decrease with the activated anisotropy is adequate, but is
the quality identical as well? Later we will look into it. The 4-texture
version was chosen as it is typical for games released this year - there
are not many who still use only 2 textures, and 8 textures are used only
in some objects on the scene. Below you will see how the GeForce FX deals
with anisotropy in real applications including the most interesting mode
- FSAA.
Geometry Processing Speed
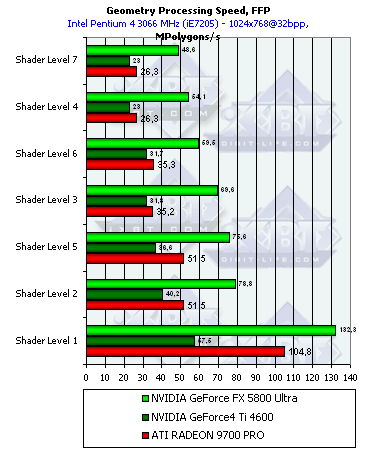 The scores are sorted out according to the complexity of a lighting model used. The lowest group is the simplest variant which corresponds to the peak accelerator's throughput for vertices. Here everything depends on the core's clock speed and number of vertex processors. On one hand, the NV30 has only three vs. 4 of the R300, on the other hand, the frequency difference is greater than three fourths. In case of more complicated models it goes ahead; the TCL emulation implemented by NVIDIA was always superior. What is the cost of the NV25's results which is so close to the R300 although it always looked paler in vertex processing. It seems that NVIDIA integrated some hardware units into the chip for more efficient TCL emulation while the R300 just executes a standard shader-emulator without any additional capabilities which is compiled a standard way.  The NV30 is still leading except the simplest peak case. The advantage is not so considerable now, but the high frequency still prevails over one missing pipeline. The R300 with its 4 pipelines wins only once in case of the simplest shader. As the overheads for the startup of vertex processing become tangible compared to a short and simple shader, the R300 gets an advantage with its 4 simultaneously working pipelines. 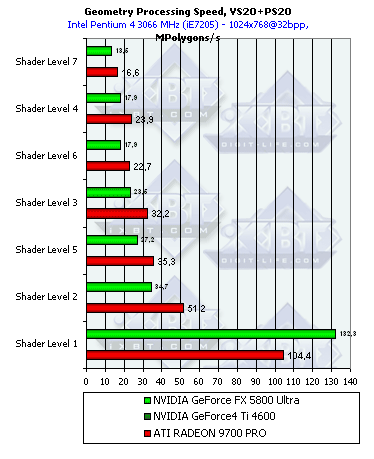 Do you remember we mentioned high overheads of the R300 for loop execution? ATI says they are actively working on the internal shader optimizer integrated into the drivers, and the overheads must be cut down soon. The NV30 has even greater overheads related with loop execution! Well, the dynamic control of the instruction flow must trigger great delays in the loop execution. Speed is the cost of flexibility - in case of loops the NV30's advantage melts away. It's interesting though that the simplest shader is executed twice faster if complied as 2.0. The T&L hardware emulation of ATI is less efficient that that of NV and is comparable in effectiveness to the vertex shader 2.0. The NV30's strongest point is TCL emulation, the weakest one is loops. In this respect, ATI can use much more aggressive optimization in the drivers thanks to the static execution of transitions and loops. So, the second version is not free for all the chips - the loops make the performance noticeably lower by a greater degree than we could expected from one loop command, - by several tens of usual commands. 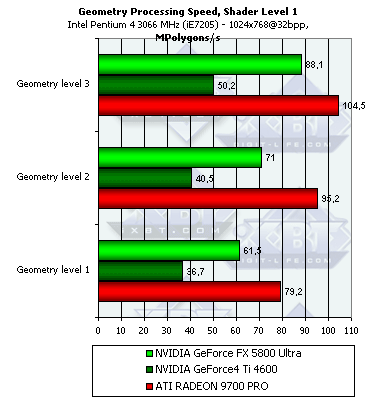
  The higher the shader's complexity and the scene's detail level, the more advantageous the NV30's position is (vertex caches and other balancing aspects). This architecture is more future-oriented. The more there are polygons in a model, the better the results, but the dependence is extremely weak, and starting from the second detail level and the second complicated shader, it can be considered sufficient. Hidden Surface Removal
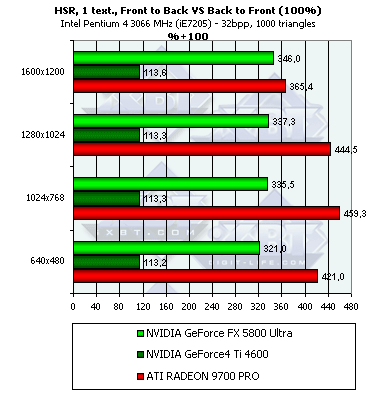
 So, in the NV25 the HSR technology is still deactivated which is demonstrated by the synthetic test (as we later found out, the HSR can be enabled in the latest drivers but only with tweakers, for example, RivaTuner; the HSR is disabled by default). But the NV30 does have it, though its effectiveness is lower that that of the R300 - the R300 uses an hierarchical structure and the surfaces are often removed on a higher level, while the NV30 has only one decision-making level combined with tiles which are used for depth information compression. In 1600x1200 the HSR on the R300 becomes much less effective - probably the hierarchical depth buffer is not used anymore (e.g. for the sake of memory) and the decisions are made like in the NV30 - only one the lowest level combined with the compressed blocks in the depth buffer. Dependence of the HSR effectiveness on the scene's complexity:  For the NV30 with its single tile level the HSR is more effective if there are fewer polygons on the scene, while the R300 keeps to the golden mean. 
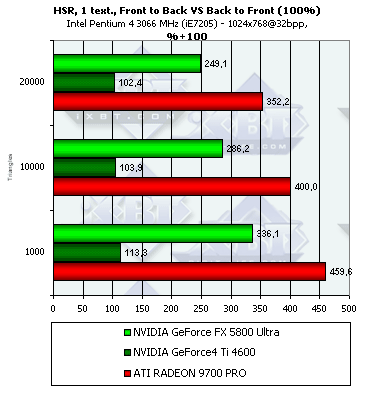 Both NV30 and R300 perform better here. The NV25 has only a 5% gain while the newer chips have the more effective early Z cull. In case of textures both chips prefer scenes with fewer polygons. 
 Nothing new, but in some tests the R300 is still far ahead. The NV30 performs worse in this non-peak but more verisimilar comparison of the rendering efficiency of the sorted and unsorted scenes with textures. But the NV25 shows a 13% gain on the scene with textures. So, in case of the originally unsorted scene the gain is not great.
The boost is the most considerable in case of a small or average number
of polygons. So, if you want to use the benefits of the HSR (unfortunately
it's disabled in many chips) sort the scene before rendering. The performance
may increase several times. In case of an unsorted scene the growth may
come to several tens of percent. By the way, portal applications do sort
scenes before rendering, and most modern FPS engines belong to them. That
is why the HSR game is worth the candle, especially for this type of games.
Andrey Vorobiev (anvakams@ixbt.com)
Alexander Medvedev (unclesam@ixbt.com)
Write a comment below. No registration needed!
|
Platform · Video · Multimedia · Mobile · Other || About us & Privacy policy · Twitter · Facebook Copyright © Byrds Research & Publishing, Ltd., 1997–2011. All rights reserved. |


