 |
||
|
||
| ||
|
||
|
||
| ||
 CONTENTS
Test system and driversTestbed:
The test system was coupled with In the tests we used NVIDIA's drivers of v41.68. VSync is off, S3TC is off in the applications. DirectX 9.0 is installed. The following cards are used for comparison:
Drivers' settings
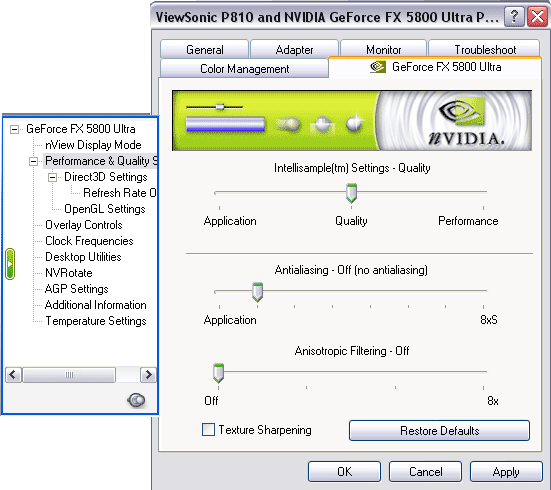 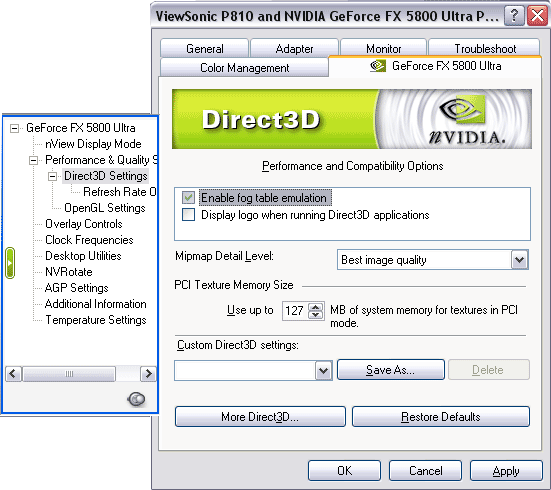 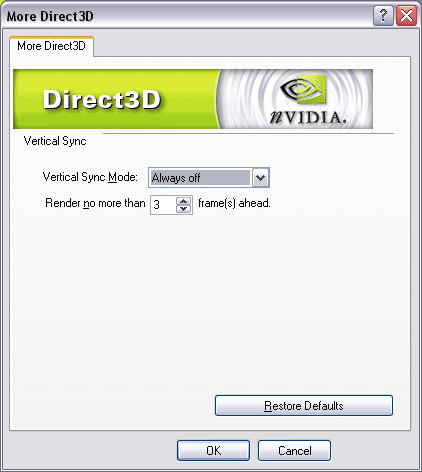 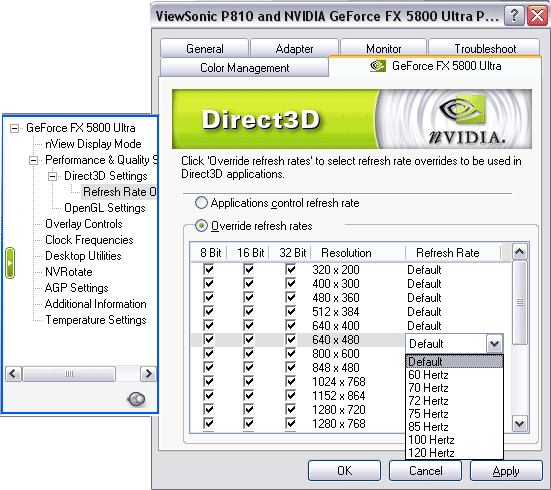  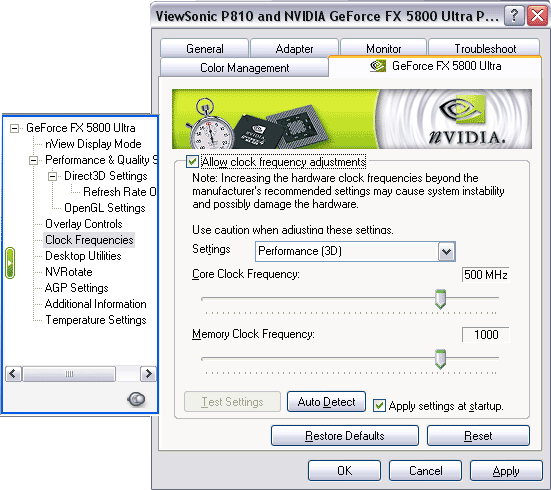 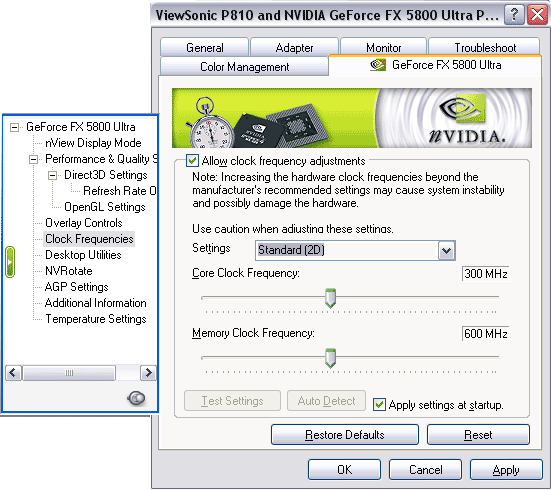  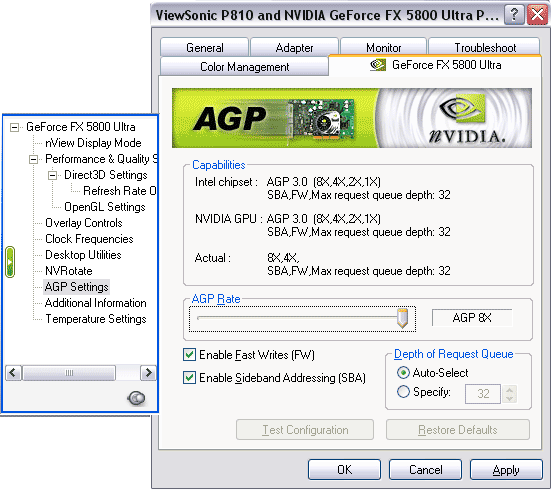 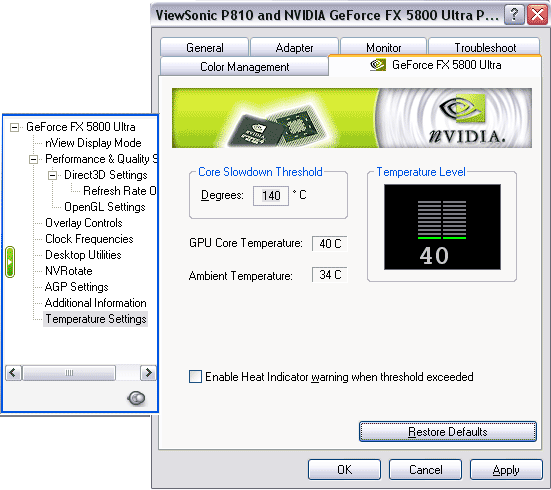 The settings for AA and anisotropy are on the same tab and work simultaneously in OpenGL and in Direct3D. The AA modes 6xS and 8xS are new. Let's have a closer look at them. The settings of Direct3D and OpenGL are standard and not new for graphics cards based on NVIDIA's CPUs. In the D3D section you can forcedly lift up the frame rate in any resolution. Now the most interesting section concerning the clock speeds. You can access this tab (as well as some others) by launching the patch for the Windows XP registry. The card's frequencies differ for 2D and 3D. By default the card operates at 300/300 (600) MHz in 2D and at 500/500 (1000) MHz in 3D. When we lifted up the frequencies in 2D up to 500/500 (1000), the cooler wasn't rotating faster. However, after rebooting the 2D mode returns to the defaults (300/300 (600)) though "Apply settings at startup" is ticked off. Then comes the AGP's operating mode and the last interesting tab is the temperature hardware monitoring. It's interesting that some drivers show not only the chip's temperature but also the card's one. Probably, the programmers are still working on this page. Test results
2D graphicsThe quality is 2D is superb! At 1600x1200@85Hz it's very comfortable to work. At 1280x1024@120Hz everything is just fine! Remember that estimation of 2D quality can't be objective. It depends on quality of a sample, and a card/monitor tandem (you should pay special attention to quality of the monitor and the cable). 2D is estimated on the ViewSonic P817-E monitor coupled with the Bargo BNC cable. RightMark 3D synthetic tests (DirectX 9)Today we will describe and obtain the first test results with the suite of synthetic tests we are currently developing for the API DX9. The test suite from the RightMark 3D which is under development now includes the following synthetic tests at this moment:
Today we will estimate data obtained on the ATI's and NVIDIA's accelerators. We are going to use widely these benchmarks for testing various DX9 accelerators and make available for free download for our readers and all enthusiasts of computer graphics. But first of all, there is a small digression about the ideological test issues: Philosophy of the synthetic testsThe main idea of all our tests is focusing on performance of one or another
chip's subsystem. In contrast to real applications which measure effectiveness
of accelerator's operation in one or another practical application integrally,
synthetic tests stress on separate performance aspects. The matter is that
a release of a new accelerator is usually a year away from applications
which can use all its capabilities effectively. Any those users who want
to be on the front line with technology have to buy one or another accelerator
almost blindly, warmed only with results of the tests carried out on outdated
software. No one can guarantee that the situation won't change with the
games they are waiting for. Apart from such enthusiasts which take such
risk, there are some other categories of people in such a complicated situation:
Description of the RightMark 3D synthetic testsPixel FillingThis test has several functions, namely:
The test draws a pyramid whose base lies in the monitor's plane and the
vertex is moved away to the maximum:
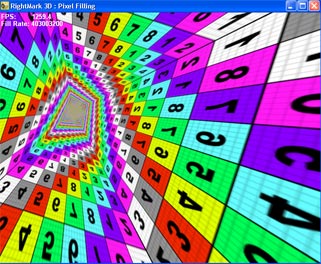 Each of its four sides consists of triangles. A small number of triangles allows to avoid dependence on geometrical performance which has nothing to do with what is studied. 1 to 8 textures are applied to each pixel during filling. You can disable texturing (0 textures) and measure only the fill rate using a constant color value. During the test the vertex moves around at a constant speed, and the
base rotates around the axis Z:
 So, the pyramid's sides take all possible angles of inclination in both planes, and the number of shaded pixels is constant and there are all possible distances from the minimal to the maximum. The inclination of the shaded plane and the distance to the shaded pixels define many filtering algorithms, in particular, anisotropic filtering and various modern realizations of trilinear filtering. By rotating the pyramid we put the accelerator in all conditions which can take place in real applications. It allows us to estimate the filtering quality in all possible cases and get weighted performance data. The test can be carried out in different modes - the same operations can be accomplished by shaders of different versions and fixed pipelines inherited from the previous DX generations. That is why you can find out the performance gap between different shader versions. A special texture with different colors and figures eases investigation
of quality aspects of the filtering and its interaction with full-screen
anti-aliasing. MIP levels can have different colors:
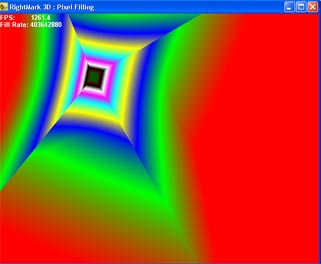 so that you can estimate the algorithm of their blending and selection. Here are the adjustable test parameters:
The test gives its results in FPS and FillRate. The latter plays two roles. In the no-texture mode we measure exactly the frame buffer write speed. In this respect, this parameter defines the number of pixels filled in per second - Pixel FillRate. In the texture mode it indicates the number of sampled and filtered texture values per second (Texturing Rate, Texture Fill Rate). Here is an example of a pixel shader used for filling in case of the most intensive version of this test (PS/VS 2.0, 8 textures): ps_2_0 dcl t0
dcl_2d s0
texld r0, t0, s0
mov r11, r0
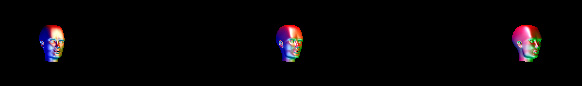
mov oC0, r11 Geometry Processing SpeedThis test measures the geometry processing speed in different modes. We tried to minimize the influence of filling and other accelerator's subsystems, as well as to make geometrical information and its processing as close to real models as possible. The main task is to measure the peak geometrical performance in different transform and lighting tasks. At present, the test allows for the following lighting models (calculated at the vertex level):
The test draws several samples of the same model with a great number of
polygons. Each sample has its own parameters of geometrical transformation
and relative positions of light sources. The model is extremely small (most
polygons are comparable or smaller than a screen pixel):
 thus, the resolution and filling do not affect the test results:
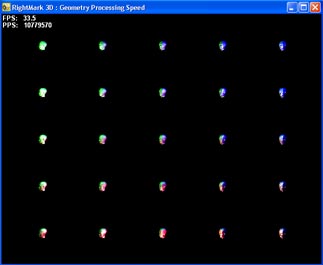 The light sources move in different directions during the test to underline various combinations of the initial parameters. There are three degrees of scene detailing - they influence the total number of polygons transformed in one frame. It's necessary to make sure that the test results do not depend on a scene and fps at all. Here are the adjustable test parameters:
The test results are available in FPS and PPS (Polygons Per Second). Here is an example of a vertex shader (VS 2.0) used for transformation
and calculation of lighting according to quantity of diffuse-specular lights
set externally in this test:
vs_2_0 dcl_position v0
//
m4x4 oPos, v0, c16 //
m4x4 r10, v0, c8 // transform position to world space
nrm r7, r0 // normalize normal add r0, -r10, c2 // get a vector toward the camera position nrm r6, r0 // normalize eye vector mov r4, c0 // set diffuse to 0,0,0,0 mov r2, c0 // setup diffuse,specular factors to 0,0
//
loop aL, i0 add r1, c[40+aL], -r10 // vertex to light direction
dst r9, r0.wwww, r1.wwww // (1, d, d*d, 1/d)
mul r1, r1, r1.w // normalize the vertex to the light vector add r0, r6, r1 // calculate half-vector (light vector + eye vector) nrm r11, r0 // normalize half-vector dp3 r2.x, r7, r1 // N*L
sge r3.x, c[80+aL].y, r9.y // (range > d) ? 1:0
lit r5, r2 // calculate the diffuse & specular
factors
mul r0, r5.y, c[30+aL] // calculate diffuse color
mul r0, r5.z, c[60+aL] // calculate specular
color
endloop mov oD0, r4 // final color Hidden Surface RemovalThis test looks for techniques of removal of hidden surfaces and pixels
and estimates their effectiveness, i.e. effectiveness of operation with
a traditional depth buffer and effectiveness and availability of early
culling of hidden pixels. The test generates a pseudorandom scene of a
given number of triangles:
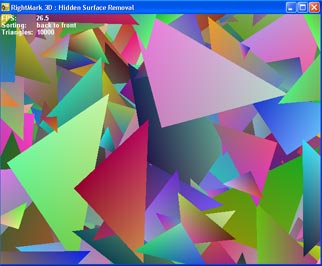 which will be rendered in one of three modes:
In the second case the test renders all pixels in turn, including hidden ones, in case the accelerator is based on the traditional or hybrid architecture (a tile accelerator can provide optimization in this case as well, but remember that the sorting will take place anyway, even though on the hardware or driver levels). In the first case the test can draw only a small number of visible pixels and the others can be removed yet before filling. In the third case we have some sort of a middle similar to what the HSR mechanism can encounter in real operations in applications that do not optimize the sequence of scene displaying. To get an idea on the peak effectiveness of the HSR algorithm it's necessary to collate the results of the first and second modes (the most optimal first mode with the least convenient second one). The comparison of the optimal mode with the unsorted one (i.e. the first and third) will give us an approximate degree of effectiveness in real applications. The scene rotates around the axis Z in the test to smooth away any potential peculiarities of different early HSR algorithms which are primarily based on the frame buffer zoning. As a result, the triangles and their verges take all possible positions. For checking support and effectiveness of the Early Z reject (ATI) and
Early Z cull (NVIDIA) technologies which allow avoiding texturing and shader
execution for pixels that do not pass the Z test, there is an added option
which forces texturing of all triangles of the scene:
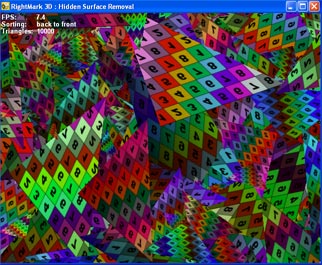 You can also change the number of rendered triangles to see how the test depends on other chip's subsystems and drivers. We can expect improvement of the results as the number of triangles grows up, but on the other hand, the growth is justified only up to a certain degree after which the influence of other subsystems on the test can start going up again. That is why this parameter was brought in to estimate quality of the test regarding the number of triangles. Here are the adjustable parameters:
Pixel ShadingThis test estimates performance of various pixel shaders 2.0. In case of PS 1.1 the speed of execution of shaders translated into the stage settings could be easily defined, and it was needed to have only a test like Pixel Filling carried out with a great number of textures, in case of PX 2.0 the situation looks much more complicated. Instruction per clock execution and new data formats (floating-point numbers) can create a significant difference in performance not only when the accelerator architectures differ, but also on the level of combination of separate instructions and data formats inside one chip. We decided to use an approach similar to the CPU benchmarking for testing performance of pixel processors of modern accelerators, i.e. to measure performance of the following set of pixel shaders which have real prototypes and applications:
 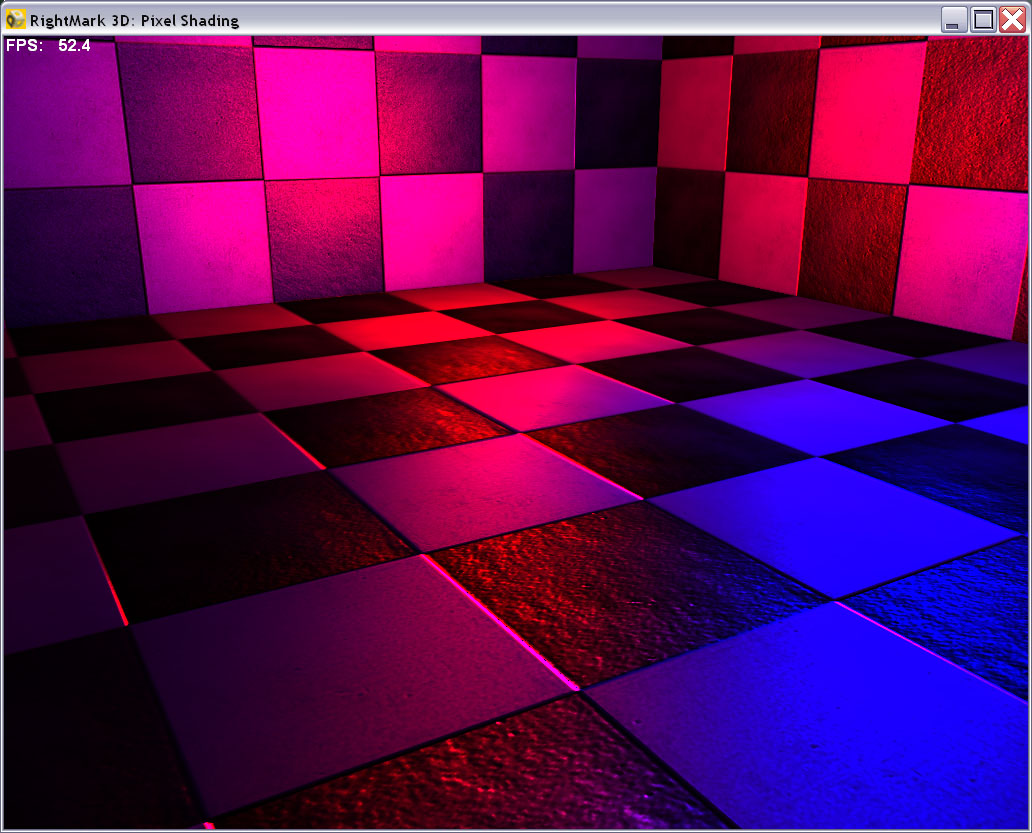  Two last tests implement the procedure textures (pixel color values are calculated according to a certain formula) which are an approximate mathematical model of the material. Such textures take little memory (only comparatively small tables for accelerated calculation of various factors are stored there) and support almost infinite detailing! They are easy to animate by changing the basic parameters. It's quite possible that future applications will use exactly such texturing methods as capabilities of accelerators will grow. The geometrical test scene is simplified, and dependence on the chip's geometrical performance is almost eliminated. Hidden surface removal is absent as well - all surfaces of the scene are visible at any moment. The load is laid only on the pixel pipelines. For checking effectiveness of the floating-point format of FP16 half precision there is an option which allows picking one of three types of pixel shaders - base 2.0 where a precise operation format can't be indicated, and two types of 2.X - with forcing of 16bit precision of calculations and of 32bit precision respectively. Here are adjustable parameters:
Below are the codes of some shaders. Per-pixel diffuse with per-pixel attenuation for 2 light sources: ps_2_0 //
dcl t0 // Diffuse Map
dcl t3.xyzw // Position (World Space) dcl t4.xyzw // Tangent
//
dcl_2d s0 // Sampler for Base Texture
//
texld r1, t1, s1
//
// Attenuation add r3, -c0, t3 // LightPosition-PixelPosition
// Light Direction to Tangent Space mul r3, r3, r5.x // Normalize light direction dp3 r8.x, t4, -r3 // Transform light direction to tangent space
// Half Angle to Tangent Space add r0, -t3, c25 // Get a vector toward the camera
add r0, r11, -r3 // Get half angle
// Diffuse dp3 r2.x, r1, r8 // N * L
mul r9, c10, r9.x // * Light Color // Specular dp3 r2.x, r1, r7 // N * H
mul r10, c12, r10.x // * Light Color //
// Attenuation add r3, -c1, t3 // LightPosition-PixelPosition
// Light Direction to Tangent Space mul r3, r3, r5.x // Normalize light direction dp3 r8.x, t4, -r3 // Transform light direction to tangent space
// Half Angle to Tangent Space add r0, -t3, c25 // Get a vector toward the camera
add r0, r11, -r3 // Get half angle
dp3 r7.x, t4, r11 // Transform half angle to tangent space
// Diffuse dp3 r2.x, r1, r8 // N * L
mad r9, c11, r2.x, r9 // * Light Color // Specular dp3 r2.x, r1, r7 // N * H
mad r10, c13, r2.x, r10 // * Light Color //
texld r0, t0, s0
mul r9, r9, r0 // Diffuse Map
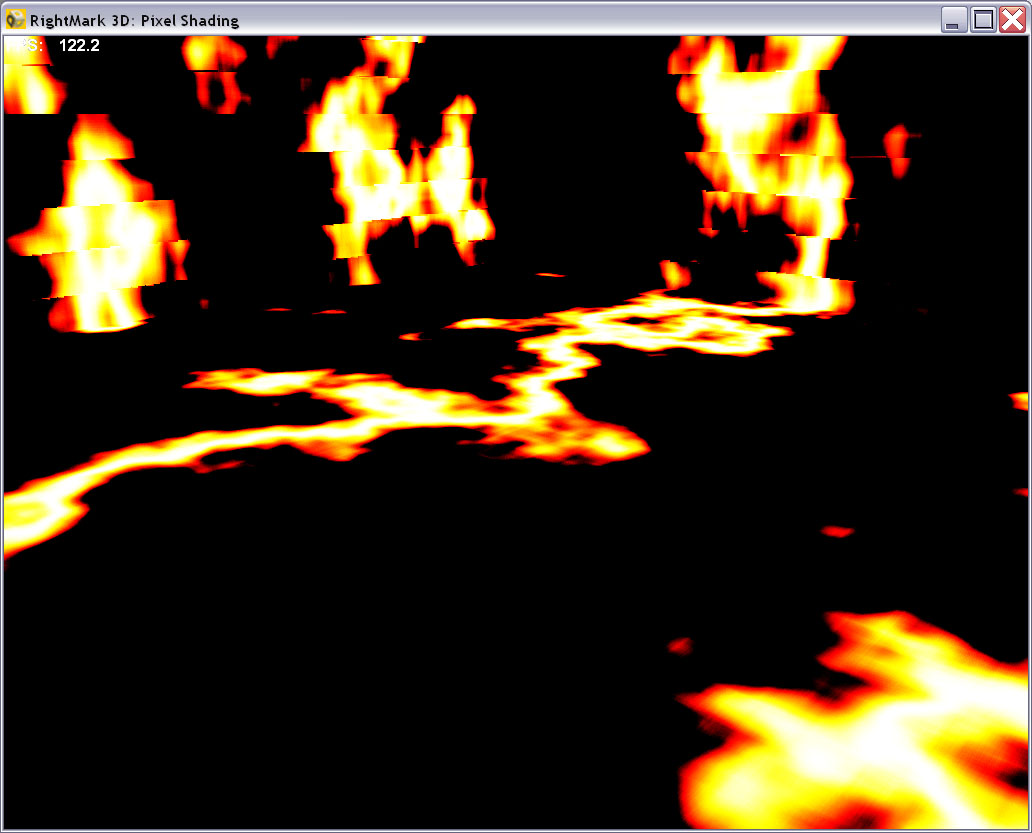
// Finalize mov oC0, r9 Fire procedure texture: ps_2_0 def c3, -0.5, 0, 0, 1
dcl v0 dcl t0.xyz
dcl_volume s0
texld r0, t0, s0
Point SpritesThis test measures performance of just one function: displaying of pixel
sprites used for creating systems of particles. The test draws an animated
system of particles resembling a human body:
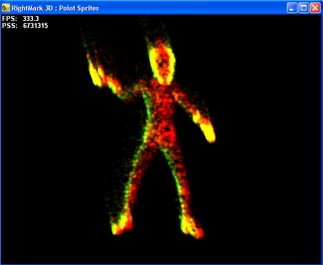 We can adjust a size of the particles (which will affect the fillrate), enable and disable light processing and animation. In case of a system of particles geometry processing is very important, that is why we didn't separate these two aspects - filling and geometrical calculations (animation and lighting) but made possible to change a load degree of one or another body part by changing sprite size and switching on/off their animation and lighting. Here are adjustable parameters:
Stay with usIn the near future we will finish debugging and publish the first results of the 6th test which, first of all, measures quality of the drivers and how effectively data and parameters are delivered to the accelerator. Soon all synthetic tests will be able to use not only Assembler shader versions but also those which are compiled from a higher-level language with the Microsoft (HLSL) compiler and the NVIDIA's one - CG+CGFX. The most pleasant event is the approaching release of the first beta version of the RightMark 3D packet. In the beginning the first beta version will provide only synthetic tests and the shell for packet startup and viewing of the results. Further there will be four different game tests. Those who want to try the RightMark 3D synthetic tests now can download the "command-line" test versions which record the final XLS file in the XML format accepted in Microsoft Office XP: In every archive you will find description of parameters of each test and an example of a .bat file used for benchmarking accelerators. We welcome your comments and ideas as well as information on errors or strange behavior of the tests. Mailto: unclesam@ixbt.com.
Andrey Vorobiev (anvakams@ixbt.com)
Alexander Medvedev (unclesam@ixbt.com)
Write a comment below. No registration needed!
|
Platform · Video · Multimedia · Mobile · Other || About us & Privacy policy · Twitter · Facebook Copyright © Byrds Research & Publishing, Ltd., 1997–2011. All rights reserved. |


