 |
||
|
||
| ||
|
||
|
||
| ||
On January 5, 2006 Intel presented new dual core processors Pentium D 900, followed by Pentium Extreme Edition 955 a few days later (January 16). These processors are based on the new Presler core, which is the first processor core manufactured by the new 65-nm process technology. The history repeats itself — as in case with the transition from 130 nm to 90 nm process technology, the first solutions are desktop processors with NetBurst microarchitecture. Mobile platforms are announced only a tad later, based on processors manufactured by the new process technology. At the same time, there was a much longer period of time between the first 90 nm Prescott and Dothan than between the 65-nm Presler and Yonah (we have already reviewed them) — it's quite possible that the new 65 nm process technology will be easier to master. But let's not go into details and focus on the main objective of this article — low level analysis of the new 65 nm Presler core in comparison with its closest counterparts — Xtreme modifications of processors based on 90 nm Smithfield core and the latest revision of Prescott N0 core, which we reviewed earlier. Testbed configuration
CPUID CharacteristicsLet's start the review of the new Presler core with the analysis of key characteristics, output by CPUID instruction with various input parameters. Table 1. Pentium EE 840 (Smithfield A0) CPUID
Table 2. Pentium EE 955 (Presler B1) CPUID
Let's compare CPUID characteristics of the Pentium EE 955 processor (Table 2) with characteristics of its closest counterpart — former "extreme" processor Pentium EE 840 (Table 1). First of all the changes affected a CPU signature — the new Pentium EE 955 with Presler core got Model Number 6 and Core Stepping 2, retaining its Series 15. Official name of the core stepping, which corresponds to the signature 0F62h, is B1. Note that the previous "dual-core" cores of processors Pentium D 800 and Pentium Extreme Edition had Steppings A0 (which appears in our today's review) and B0. Thus, we can assume that the manufacturer sees the new 65 nm Presler core, which first stepping is called B1, as the next stage of the development of 90 nm "dual-core" Smithfield cores. We can see no differences in Cache/TLB descriptors, except for the L2 Cache descriptor — its size in Presler is 2 MB (per a single core, that is 4 MB in total), that is Presler can be considered a 65 nm dual core modification of Prescott-2M core (while Smithfield is just a dual core modification of Prescott core). There are no differences in the number of physical cores (2) and logical processors (4) in this processor either. Remember that with the appearance of dual core processors, the number of logical processors has become a nominal notion — it would be correct to call it a total number of system processors in a given die. This very number of processors will be detected by an operating system (if it supports multiprocessing and Hyper-Threading), when installed and loaded on a given real processor. For example, all dual core processors have two logical processors, like all single-core processors supporting Hyper-Threading. But the former differ from the latter in a number of physical cores (2 and 1 correspondingly). But if it's a dual core processor supporting Hyper-Threading, the number of logical processors grows to four, which can be seen in Pentium Extreme Edition processors (840 and 955). The most important changes were made to supported extensions (Basic Features, ECX, and Extended Features, EDX). The new Presler differs from Smithfield in two new unknown extensions (technologies), specified by Bits 5 and 15 in the ECX Basic Features register. Note that the same bits also appeared in CPUID of the recently reviewed first 65 nm mobile dual core processor Intel Core Duo (Yonah). In this connection, like in the Yonah review, we can assume that one of these bits corresponds to virtualization technology (VT), officially implemented in Core Solo/Duo as well as in Pentium D/Extreme Edition with the new Presler core. We should also note that formerly unknown Bit 13 of Basic Features, ECX, which we have seen from the latest revisions of Prescott core, is now officially known and corresponds to support for the CMPXCHG16B instruction. Among other differences between Presler and Smithfield we can mention Execute Disable technology in the former, designated by Bit 20 of the EDX register Extended Features. Real Bandwidth of Data Cache/MemoryThe overall situation with real bandwidth of L1/L2 D-Cache and memory (Picture 1) looks usual for Prescott successors. 16 KB L1 Cache, 2 MB L2 Cache, inclusive cache hierarchy. L2 Cache throughput goes down a little at 256 KB (as the specified area falls on L2 Cache), which has to do with depleted D-TLB resources. As before, L1 Cache is characterized by Write-Through mode. It shows as an equality of L1 and L2 Cache write bandwidths (in other words, no inflection at the area of L1 Cache size, that is 16 KÁ).  Picture 1. Real Bandwidth of Data Cache and Memory Table 3
Quantitative bandwidth characteristics (Table 3) show that L1 and L2 Caches in Presler are practically identical in every respect to those in Prescott N0 and Smithfield. Real memory read bandwidth of a Presler-based system is noticeably higher compared to a Smithfield-based system due to the 266 MHz FSB (its theoretical bandwidth is 8.53 GB/s). But its write performance is not that high, it is even lower than on the platform with Pentium 4 Extreme Edition (Prescott N0, 266 MHz FSB as well). Maximum Real Memory BandwidthAs usual (for Pentium 4 processors), Software Prefetch method allows maximum memory bandwidth, while other methods are not so highly efficient. 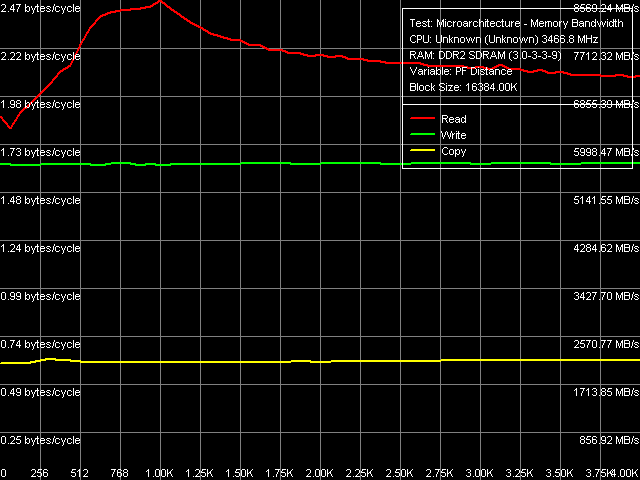 Picture 2. Maximum Real Memory Bandwidth, Software Prefetch and Non-Temporal Store The curves of real memory read and copy bandwidth versus software prefetch distance (Picture 2) look typical for Prescott cores (they look like the curves for Pentium 4 Extreme Edition 3.73 GHz). Table 4
The quantitative analysis of maximum real memory read bandwidth (Table 4) shows that memory bandwidth values obtained by various optimizations on Presler are very close to the values obtained on Pentium 4 Extreme Edition with Prescott core, Stepping N0. Thus we can assume that software prefetch in Presler is no different from that in Prescott N0. Table 5
In the same way, the values of maximum real memory read bandwidth (Table 5) obtained for Prescott N0 and Presler are close in all cases. As usual, the best result is achieved by non-temporal store method, which allows memory bandwidth to reach 2/3 of theoretical FSB throughput. Data Cache/Memory LatencyThe general picture of L1/L2 D-Cache and RAM latency (Picture 3) looks as usual. What concerns peculiarities, we should note very low latencies for forward and backward walks with the stride size of L1 Cache line (64 bytes — strictly speaking, that's not quite correct, because fetching data from memory into L2 Cache is done by whole L2 Cache lines; their effective length is 128 bytes in connection with a mandatory fetch of the adjacent 64-byte line) as well as smooth growth of the pseudo-random access latency for the block size of 256 KB and higher, which has to do with depleting D-TLB. 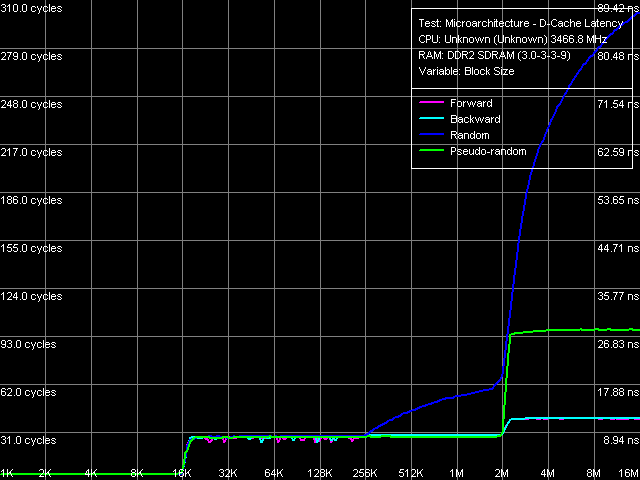 Picture 3. Data Cache/Memory Latency What concerns the quantitative analysis (Table 6) of the average L1/L2 D-Cache and RAM latencies (RAM latencies are obtained by a "correct" walk at the 128-byte stride), we should mention considerable differences between our processors — the average L1 Cache latency amounts to 4 cycles in all cases, L2 — approximately to 28.5 cycles. The average memory latency depends on an access mode (due to hardware prefetch). It amounts to about 30-35 ns for linear walk, 50 ns — for pseudo-random walk, and 90-100 ns — for random walk. Presler's smaller average latencies do not allow us to see noticeable differences in hardware prefetch algorithm (you will see it below). They more likely have to do with memory proper (Corsair XMS2-5400UL modules and the newer Intel 975X chipset). Table 6
Minimum Latency of Data Cache/MemoryThe most interesting discoveries in Presler core await us in this very section. What concerns the minimum L1 Cache latency, we can see no differences from the average latency of this cache as well as from the other processor cores (so we don't publish these graphs) — it stays on the level of 4 cycles in all cases. It's much more interesting to see how Minimum L2 Cache latencies are reached by unloading the L1-L2 bus of the processor.  Picture 4. Minimum L2 Cache Latency, Method 1 We get an excellent result already in the first case (Picture 4) using the standard procedure to unload the bus, which is not very good for testing processors with pronounced speculative data loading. Let's analyze L2 Cache walk modes in reverse order. So, a usual (for Prescott cores and their successors) look of the curves is preserved only in case of random walk of a 96 KB data block in L2 Cache — minimum latency is 24 cycles, the bus is not unloaded even with lots of NOPs. A pseudo-random walk gives a similar curve. But it's shifted 2 cycles down relative to the main curve. Thus, minimum latency in this case is 22 cycles. We don't know the reasons for the reduction of latency during a pseudo-random walk. But hardware prefetch has nothing to do with it, as we don't see that the bus is unloaded here. It happens only in case of forward and backward walks in L2 Cache — we can see a typical picture of unloaded bus with 5(!)-cycle L2 Cache latency for more than 21 NOPs (in a first approximation, each next NOP in the area from 0 to 21 decrements L2 Cache latency by one cycle). What does it mean? Of course, it would have been absurd to speak of the true 5-cycle L2 Cache latency (for 4-cycle L1 Cache) — we'd rather speak of hardware prefetch on the level of L2 Cache! Unload curves for linear walks speak in favor of hardware prefetch, which is easily implemented for linear data access. In other cases we can see L2 Cache latency "practically in pure form", as in all other Prescott cores. Well, hardware prefetch from L2 Cache is a good solution. It allows to cover up large latencies for accessing this cache at least partially. 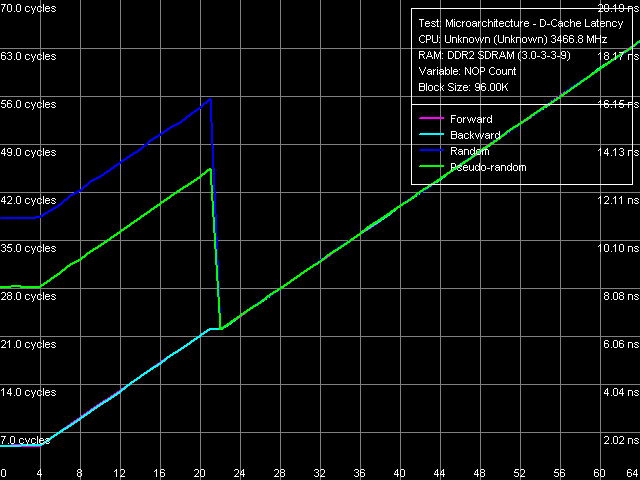 Picture 5. Minimum L2 Cache Latency, Method 2 Differences in L2 Cache latency depending on a walk mode can also be seen in Minimum L2 Cache latency curves, obtained by an alternative method (Picture 5) for Prescott-like cores. In this case, pseudo-random and random walk curves show a distinct minimum L2 Cache latency of 22 cycles, typical of Prescott processors (inflection point for 22 single-cycle NOP operations, latency in this point also equals 22). This test proves our hypothesis that Presler's L2 Cache latency as such hasn't changed. We proceed to minimum memory latency tests. In order to demonstrate the second significant Presler difference from the previous cores of this family, we published the unload curves for the memory bus, plotted for "wrong" 64-byte walk on Smithfield (Picture 6a) and Presler (Picture 6b) processors — in this very case we can see the most significant differences in hardware prefetch algorithms, but already on the memory level. 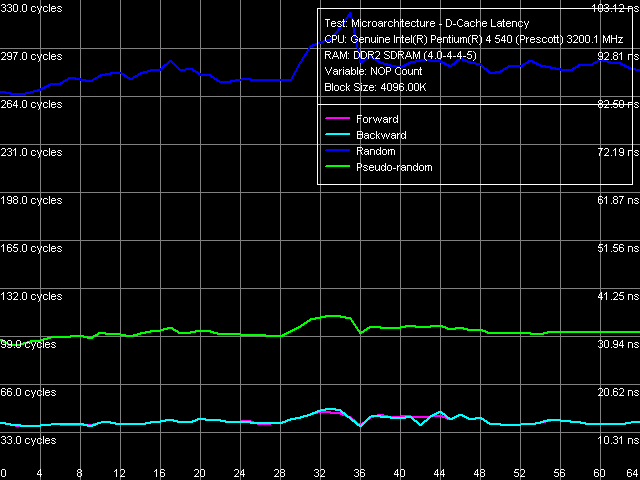 Picture 6a. Minimum Memory Latency, 64-byte stride, Smithfield  Picture 6b. Minimum Memory Latency, 64-byte stride, Presler As in case of L2 Cache, pseudo-random and random walk curves (when hardware prefetch is practically idle) look identical on both processors. There are differences for forward and backward walks of a data chain in memory. In case of Smithfield, the curves are qualitatively identical to the two curves above, but with lower absolute values. In case of Presler, we can see quite a different unload situation, which resembles unloading L1-L2 bus in this processor as well as in AMD K8 processors. Thus, along with hardware prefetch on the level of L2 Cache, we can speak of Presler's improved hardware prefetch from memory.  Picture 7. Minimum memory latency, 128-byte stride The L2-RAM bus unload curves for 128-byte stride (Picture 7) look totally different. To be more exact, they are practically identical to the curves, obtained on Prescott and Smithfield cores. Table 7
A summary of minimum L1/L2 D-Cache and memory latencies in processors with Prescott N0, Smithfield and Presler cores is published in Table 7. In case of all three processor cores, minimum memory latencies are practically no different at 128-byte stride, when the efficiency of hardware prefetch is very low. Data Cache Associativity Picture 8. Data Cache Associativity The test of Presler L1/L2 D-Cache associativity (Picture 8) demonstrates a picture typical of Prescott processors — effective associativity of L1 D-Cache in this processor is equal to one, associativity of the L2 Cache for instructions/data is equal to eight. Real L1-L2 Cache Bus BandwidthTypical relationship between an increase in L2 Cache size and a decrease in L1-L2 bus bandwidth, which we detected in our review of the Smithfield core, is confirmed by the Presler core (Table 8). Namely, its L1-L2 bus bandwidth is practically identical to the bandwidth of L1-L2 bus in Pentium 4 Extreme Edition processor with Prescott N0 core, 2 MB L2 Cache. Table 8
*values relative to the theoretical limit are given in parentheses Trace Cache, Decode/Execute EfficiencyThe most interesting component of the NetBurst micro architecture is a special cache for micro operations from the predecoder - Execution Trace Cache. Let's see what differences the new Presler core will offer. 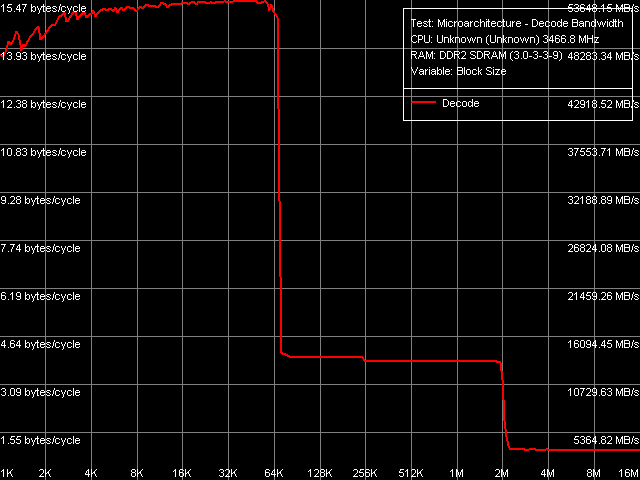 Picture 9. Decode/execute efficiency As usual, the most illustrative situation is in decode/execute efficiency for a series of large simple 6-byte CMP instructions. In this test, like in all the other tests of this type, there are no qualitative differences between Presler and previously reviewed Prescott and Smithfield. Let's proceed to quantitative tests. Table 9. Decode/execute efficiency, Pentium 4 EE (Prescott N0)
As we know from our previous analyses of various NetBurst incarnations, the first cores with official support for EM64T, such as Nocona D0 and Prescott E0, have a tendency for worse execution efficiency of some commands — the simplest operations like TEST (test eax, eax) and CMP 1 (cmp eax, eax) in particular. This tendency progresses in Prescott/2M core Revision N0 (Table 9; those values that change in the next cores are given in bold for your convenience). First of all, this core has even lower execution efficiency of TEST and CMP 1. The second significant modification is the reduction of maximum execute speed for all CMP operations from L2 Cache to 4.0 bytes/cycle (1.0 or 0.67 instructions/cycle, depending on the command length) as well as prefixed CMP to 4.14 bytes/cycle (0.52 instructions/cycle). Table 10. Decode/execute efficiency, Pentium EE 840 (Smithfield A0)
Further NetBurst evolution, manifested by the first dual core processor Pentium Extreme Edition 840 (and Pentium D 800) with Smithfield core (Table 10), brought no significant changes into execution efficiency of TEST and CMP 1 — it stays on the same level as in case of processors with Prescott/2M core. In return, the execute efficiency of CMP3-CMP6 as well as prefixed CMP1-CMP4 operations from L2 Cache again got higher. In our Smithfield review we assumed that it had to do with differences in L2 Cache size between Prescott N0 and Smithfield. It's high time to check up this assumption using test results of the new Presler core (Table 11). Table 11. Decode/execute efficiency, Pentium EE 955 (Prescott B1)
Our assumption is confirmed — the increase in L2 Cache size to 2 MB is again accompanied by the reduction of maximum decode efficiency for large simple instructions to 4.0-4.14 bytes/cycle. This series of tests demonstrates no other differences between the new Presler core and Smithfield, Prescott N0. The second noticeable change in the Prescott/Nocona decoder with the introduction of EM64T consisted in reduced efficiency of truncating meaningless prefixes in the test that executes instructions of the following type: [0x66]nNOP, n = 0..14.  Picture 10. Decode/execute efficiency for prefix instructions Table 12
Remember that Prescott N0 and Smithfield cores did not suffer significant changes relative to the previous processor cores supporting EM64T. Nevertheless, Presler's results in this test (Picture 10, Table 12) indicate further reduction of efficiency of truncating meaningless prefixes. Instruction Re-Order Buffer (I-ROB)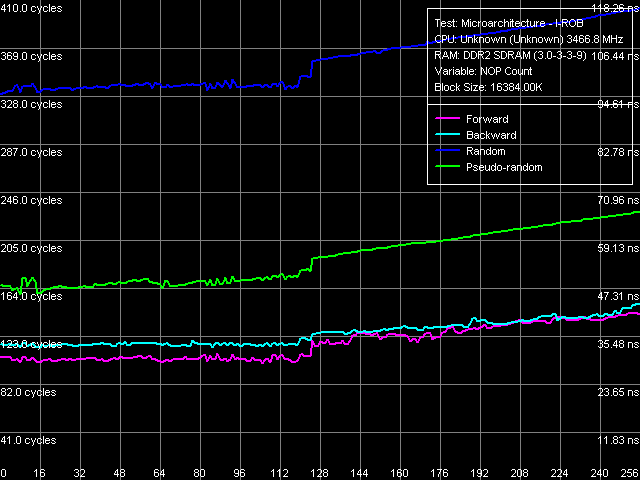 Picture 11. Instruction Re-Order Buffer Depth Testing depth of the Instruction Re-Order Buffer in Presler (Picture 11) provides a similar situation as in case of Nocona core, Stepping D0. We can see an inflection at 120 NOPs, quite close to the true value, specified for Pentium 4 Prescott (126) processors. It would be reasonable to assume that the new dual core processors Pentium D/Extreme Edition 800 and 900 (based on Smithfield and Presler cores) have the same I-ROB depth. TLB CharacteristicsWe shall not analyze D-TLB and I-TLB characteristics in detail, considering that they haven't changed (according to CPUID descriptors) since the first Prescott core. 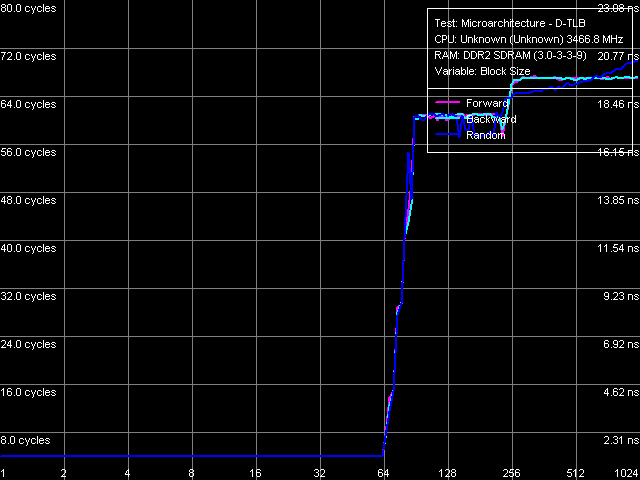 Picture 12. D-TLB size  Picture 13. D-TLB associativity D-TLB size (Picture 12) is 64 entries (we have already seen it in test results for L1/L2/RAM bandwidth and latency), a miss penalty (when the TLB size is used up) costs a processor 57 cycles minimum. Full associativity (Picture 13). 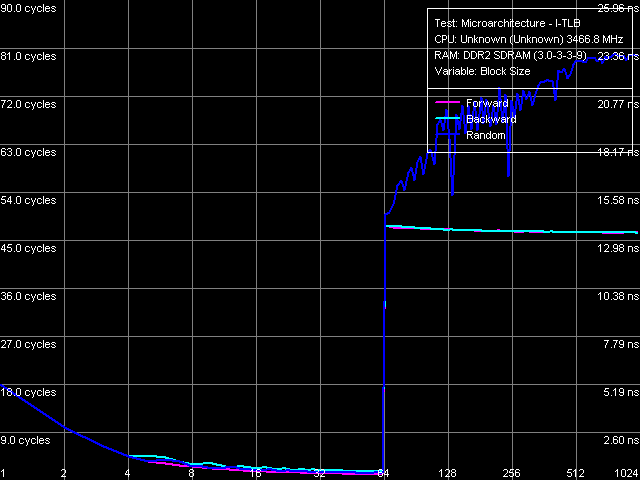 Picture 14. I-TLB size  Picture 15. I-TLB associativity I-TLB size (Picture 14) — 64 entries, the miss penalty is 45 cycles (forward, backward walk) and higher (random walk), full associativity (Picture 15). ConclusionOur today's analysis of low-level characteristics of one of two independent cores of the new 65nm dual core processor Pentium Extreme Edition 955 (Presler) revealed that it's maximum close to the previous 90nm Prescott/2M, implemented in processors Pentium 4 600 and Pentium 4 Extreme Edition 3.73 GHz. Similarity manifests itself in the size and organization of D-Caches, their performance, L1-L2 bus bandwidth, as well as most characteristics of the predecoder and Execution Trace Cache. At the same time, we revealed a number of serious differences, which positively distinguish the new Presler core. First of all, we mean a principally new element for x86 processors on the whole and for NetBurst architecture in particular — hardware prefetch on the level of L2 Cache. It allows to mask noticeable delays, which have to do with access to this relatively slow cache when reading data strictly forward or backward. Secondly, Presler has a significantly overhauled data prefetch from memory, which allows to reach even lower memory latencies (in the same cases of forward and backward access). Reduced efficiency of decoding/executing prefixed instructions slightly spoils the picture. But this fact is just of theoretical interest, as these instructions are not used in practice. Thus, this drawback will not manifest itself in reality, when executing real applications.
Dmitri Besedin (dmitri_b@ixbt.com)
March 22, 2006 Write a comment below. No registration needed!
|
Platform · Video · Multimedia · Mobile · Other || About us & Privacy policy · Twitter · Facebook Copyright © Byrds Research & Publishing, Ltd., 1997–2011. All rights reserved. | ||||||||||||||||||||||||||||||||||||||||||||||||||||||||||||||||||||||||||||||||||||||||||||||||||||||||||||||||||||||||||||||||||||||||||||||||||||||||||||||||||||||||||||||||||||||||||||||||||||||||||||||||||||||||||||||||||||||||||||||||||||||||||||||||||||||||||||||||||||||||||||||||||||||||||||||||||||||||||||||||||||||||||||||||||||||||||||||||||||||||||||||||||||||||||||||||||||||||||||||||||||||||||||||||||||||||||||||||||||||


