 |
||
|
||
| ||
On June 29th, 2004 there has been announced a new series of server processors Intel Xeon with 800 MHz system bus, based on the new core codenamed "Nocona". From the microarchitectural point of view, Nocona core is the continuation of the microarchitectural series of Intel NetBurst with Hyper-Threading support. The most significant innovation of this core (in comparison with the previous – Prescott) is EM64T support (Intel(R) Extended Memory 64 Technology), a counterpart of the long existing technology AMD64 introduced to support prospective 64bit operating systems. EM64T technology as such and its compatibility issues with 64bit code developed for AMD64 is a subject of a separate analysis, which will be prepared in future. For now let's dwell on the analysis of microarchitectural aspects of the new processor core – it's quite reasonable to assume that the 64bit expansion of NetBurst could have impact on several low level characteristics of the core (positive or negative). We'll compare these characteristics with those of the previous incarnation of the NetBurst microarchitecture – Intel Pentium 4 Prescott core. Testbed Configurations and SoftwareTestbed #1
Testbed #2
Software
CPUID CharacteristicsWe shall start the analysis of the new processor core with the most significant values given by the CPUID instruction with different input parameters. Let's start with the values obtained for Pentium 4 Prescott. Pentium 4 (Prescott)
It's important to note that this processor has a zero Brand ID, which according to Intel documentation means that this function is not supported by this processor. It most likely means that our processor under review is an engineering sample. The new Xeon Nocona acted unexpectedly from the point of view of its identification – even the last version of RMMA 3.3 detected it as... Pentium 4 Prescott! Let's see how it could happen. Xeon (Nocona)
The answer is still Brand ID, which is also zero in Xeon Nocona! Let's hope that this is a peculiar feature of engineering samples, because it's impossible to identify this processor as Xeon (not as Pentium 4) in a different way. The reason is simple – it matches Pentium 4 Prescott by all other important CPUID parameters. There are only two differences: First – doubled I-TLB size due to disabled Hyper-Threading (you can learn the reasons in more detail in our separate little analysis). Second – EM64T support flag (note that it is located in the same position as the Long Mode flag in 64bit AMD processors, before that this register had been used by AMD to identify such CPU features as support for 3DNow!/Extended 3DNow! In Intel documentation it was marked as "reserved"). Nevertheless, both differences are not enough to unambiguously identify a processor as Xeon. The first one is nullified when Hyper-Threading is enabled, the second one – with the launch of Pentium 4 Prescott CPUs with EM64T support. In view of the aforesaid it's important to note the following issues: the new Nocona core almost does not differ from the Prescott core by its ID information. Even stepping values are the same in both processors, to say nothing of architectural elements (the same TLB and cache type/size). I repeat that it differs from the present Prescott series by its EM64T support. But in future, when this support is also implemented, they will not have formal differences. The only thing for us to do is to find the differences "manually" – using our low level tests. Real Bandwidth of Data Cache/Memory
The first series of tests identifies the real bandwidth of L1/L2 data cache and RAM (Memory Bandwidth test). All read/write optimizations are disabled, and so we refer to the obtained results as "average".
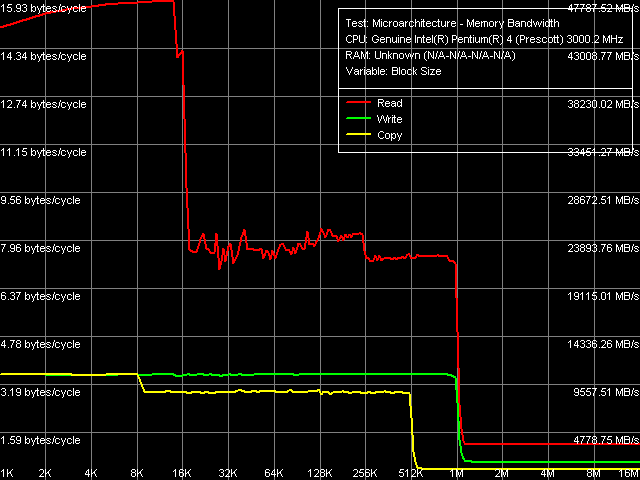 Real Cache/Memory Bandwidth, Xeon (Nocona) Test results in this diagram (using SSE/SSE2 registers) match the results obtained for Prescott processors. This reading curve clearly demonstrates three areas corresponding to 16-KB L1 data cache, 1-MB inclusive L2 cache, and RAM. Pay attention to the interesting instability of L2 cache read bandwidth in the 16-256 KB region, which level stabilizes in the 256-1024 KB region due to the D-TLB exhaustion (like in previous cores of the NetBurst series its size is 64 entries of correspondence between physical and virtual memory pages). There is no difference between L1 and L2 in the write bandwidth curve due to the Write-Through operation mode of L1 cache, when data is written only to L2 cache in order to increase the read performance of L1 cache.
Quantity characteristics of L1 and L2 caches in these processors are also close to each other.
On the contrary, RAM bandwidth values demonstrate significant differences, obviously not in favour of Xeon Nocona. Of course we cannot write it off to the processor – we use different chipsets, different memory types (non-registered and registered on Prescott and Nocona platforms correspondingly). By the way, I'm going to answer right away your possible remark about the direct comparison of speed characteristics of different memory types having different theoretical memory bandwidth (8.6 GB/sec for dual channel DDR2-533, 6.4 GB/sec for dual channel DDR2-400). In our case, when the limit of real memory bandwidth is set by the theoretical I/O speed limit of the system bus (6.4 GB/sec), DDR2-533 does not offer any advantages over DDR/DDR2-400 in respect to its bandwidth. We have already written about that. Maximum Real Memory BandwidthConsidering the above reservation, we'll assume that the theoretical limit of memory bandwidth for both platforms is 6.4 GB/sec, and the percentage values in the table are provided relative to this figure. To reach the maximum real memory bandwidth we'll use the tests implementing such methods for reading whole cache lines from memory as Software Prefetch, Block Prefetch 1 and 2.
As the Software Prefetch method allows to reach maximum memory bandwidth values, it will be the first to consider. Below are the graphical dependences of memory bandwidth and prefetch distance length for Prescott and Nocona.
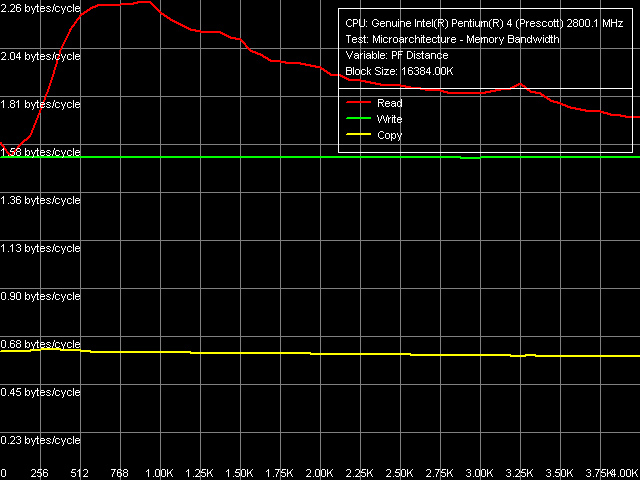 Maximum Real Memory Bandwidth, Software Prefetch, Pentium 4 (Prescott) 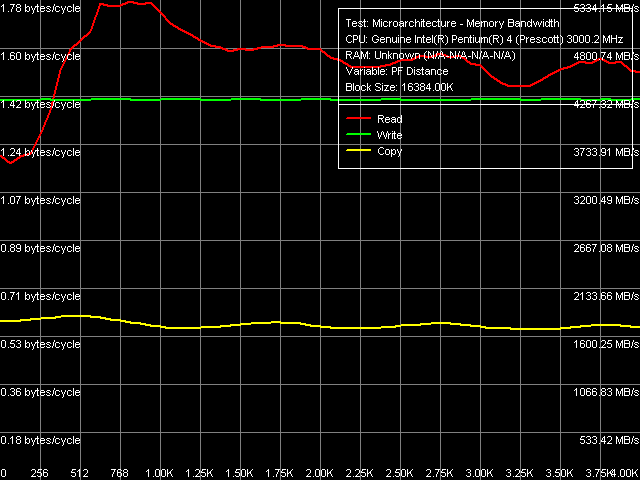 Maximum Real Memory Bandwidth, Software Prefetch, Xeon (Nocona)
You can see the first significant difference between Prescott and Nocona in the read curves: Software Prefetch acts a little differently. One can say that maximum efficiency coincides – the 512-1024 byte region, but beyond this region you can see the differences: Prescott efficiency falls down smoothly, while Nocona efficiency – sinuously (you can also see that on the copy curve). Absolute values of the memory bandwidth are also different: in Prescott it's almost theoretical maximum (99%), Nocona demonstrates only 83.3% of the theoretical limit. On the contrary, greater gain from using Software Prefetch is demonstrated by Nocona (47% gain) versus Prescott (42% gain). Perhaps the latter does not "have enough sea-room" with its absolute memory bandwidth already at maximum, while the former has not yet reached its maximum capacity.
The other methods do not merit much attention being just another proof of the inapplicability of AMD methods (Block Prefetch 1 and 2) for Intel processors. Methods of reading cache lines are more interesting to note – while Pentium 4 Prescott gains a little in memory bandwidth (5185 MB/sec versus 4457 MB/sec), Xeon Nocona even loses in its speed, to say nothing of gains (3316 MB/sec versus 3620 MB/sec). This fact cannot be explained by the differences in chipsets and memory, so we'll give all credit to the CPU.
Now let's analyze the maximum real memory write bandwidth using Non-Temporal Store (past the data cache) and sequential cache line writing. First of all I should say that Nocona, being much worse at reading data, performs memory writing a tad better than Prescott in the ordinary mode (without optimizations). The same applies to cache line writing – the gain is almost the same (28-29%), Nocona demonstrates a little higher absolute result (37.2% of the maximum theoretical memory bandwidth). But the Non-Temporal store method almost evens up our processors, this time with a little advantage of Prescott (66.7%) over Nocona (66.2%). By the way, the 2/3 ratio of the theoretical memory bandwidth maximum is already familiar by the previous analyses of the NetBurst microarchitecture, which evidently indicates existence of a mysterious FSB speed limit for writing and its lack for reading.
Data Cache/Memory LatencyThe next series of tests will be the latency tests for L1/L2 data cache and RAM (D-Cache Latency test). Note that by "average" latency we mean the element (cache line) search time in the current level of the memory subsystem without "unloading" the data bus.
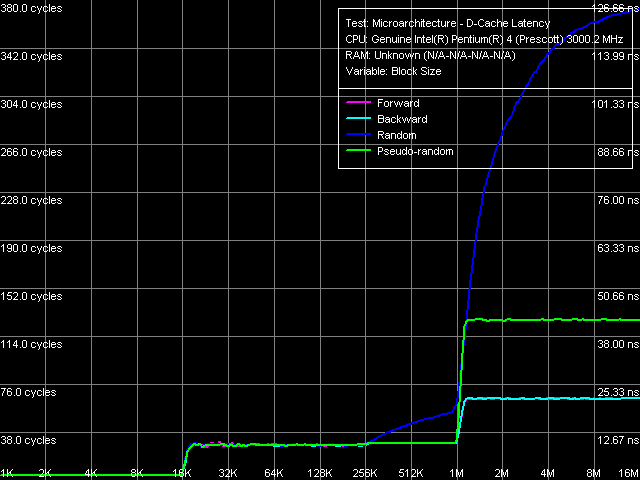
The overall picture of latency, as well as of memory bandwidth, in both processors looks the same.
 Cache/memory latency, Xeon (Nocona)
You can see the distinctive bends in the same regions as in the first series of tests (16 and 1024 KB), which correspond to the real sizes of L1/L2 data caches. An additional step at 256 KB is added in the random access mode, the reason for this step (as we have already mentioned above) is connected with the depletion of D-TLB size. You can clearly see that pseudo-random access does not demonstrate such a deficiency, which justifies its usage for objective latency readings in the region of large data volumes, i.e. RAM latency.
Quantity characteristics of L1/L2 cache are the same in both processors. Concerning memory latency note that the table values are obtained in a separate test, which walks through the data chain at 128 byte steps, that is the "effective" L2 cache line length (we have already written about the methods of measuring RAM latency on Pentium 4 platform before). About memory latency in general: it's much higher (up to 35%) on the Xeon Nocona platform. On one hand, DDR2-400 on the former platform (Prescott) would have probably led to even lower latencies (because the native DDR2-533 latency is a tad higher than that of DDR2-400). On the other hand, the latter platform (Nocona) uses registered memory, though according to our estimates the latency raise due to "registeredness" is not more than 5% as a rule. Thus, there is something "wrong" either with the chipset, which introduces additional latencies, or with the processor. Let's try and estimate it in the minimum latency tests. Data Cache/Memory Minimum Latency
At first, let's compare the minimum latency of data cache. It's all clear with L1 cache, the four cycles (we are quite accustomed to them now) remain. L2 caches in Prescott and Nocona also behave in the same way.
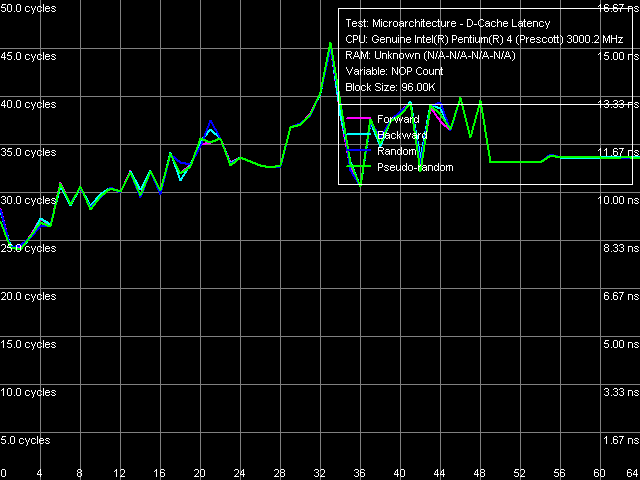 L2 cache minimal latency, Xeon (Nocona), Method 1 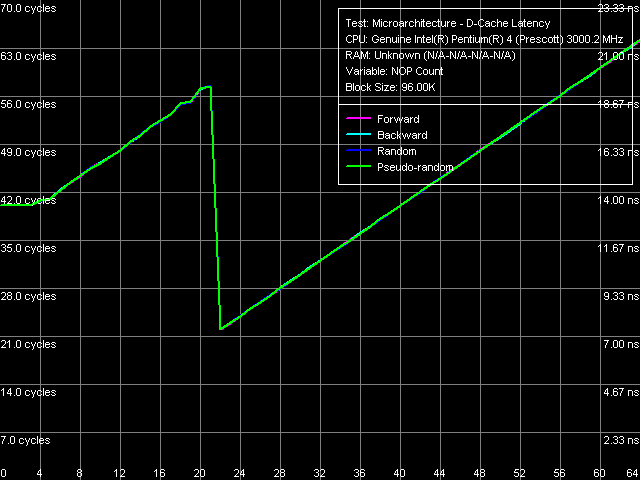 L2 cache minimal latency, Xeon (Nocona), Method 2
Namely, its latency obviously does not reach its maximum at standard L1-L2 bus "unloading" by inserting "empty" operations (Method 1), and it goes down to 22 cycles at "non-standard" unloading, specially developed for processors with pronounced speculative data loading (Method 2). The second series curves demonstrate minimum at the insertion of 22 "empty" operations (or eax, edx), which means that the execution time of this operation has not changed since Prescott – it is still 1 cycle instead of 0.5 cycle as in previous NetBurst implementations.
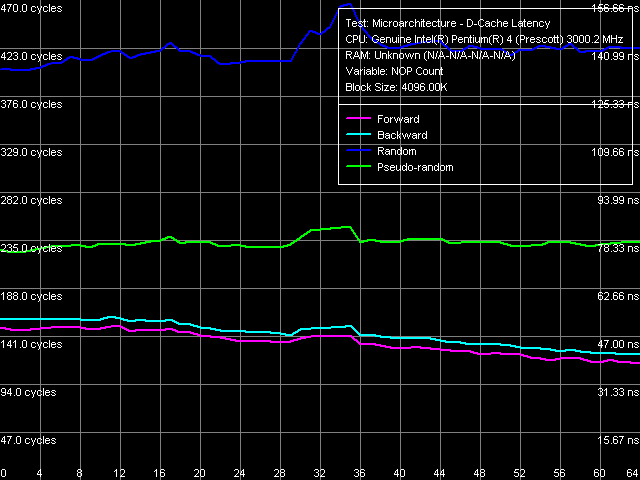 Minimum memory latency, Xeon (Nocona)
Curves of the "standard" unloading of the L2-RAM bus for Xeon Nocona do not differ from those obtained for Prescott (that's why they are not displayed here). The differences are as always in quantitative characteristics.
Thanks to these tests we can assume with high probability that the processor itself has nothing to do with the increased memory latency on the Xeon Nocona platform. First, bus unloading curves look identical. Second, relative minimum latencies of forward and backward walk are within the 76-78% interval (relative to average values) for both Prescott and Nocona. It means that Hardware Prefetch in these processors works identically. Note also that minimum latencies of random and pseudo-random access are almost equal to the average values on both platforms. Data Cache Associativity
Taking into account matching cache descriptor values of Pentium 4 (Prescott) and Xeon (Nocona), it's quite natural to expect no differences in cache associativity between these processors.
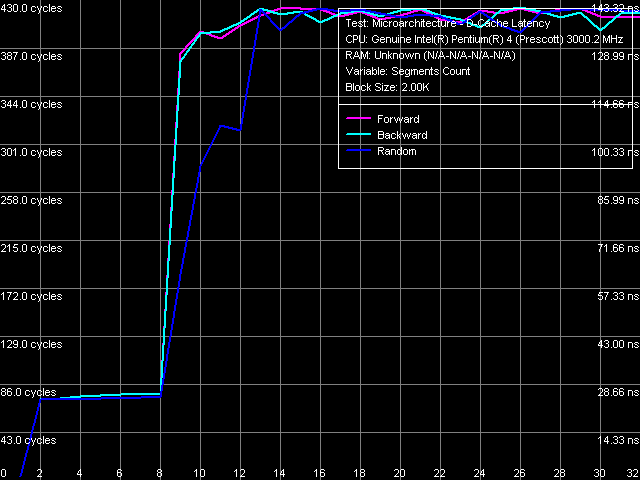 Data cache associativity, Xeon (Nocona) L1/L2 data cache associativity test proves that, its results are displayed on the image above. As in the other reviewed Pentium 4 processors, the "effective" L1 data cache associativity is equal to 1, associativity of the integrated L2 instruction cache/data cache – 8. Note that the Nocona associativity curves look no less clear than those for Prescott, that is much clearer than for the previous Pentium 4 (Northwood) models. L1-L2 Cache Bus Bandwidth
The above tests of the average/minimum L2 data cache latencies demonstrated their identity in Prescott and Nocona, and thus it's quite logical to assume that the organization of L1-L2 bus was not changed. Let's check this assumption by the D-Cache Bandwidth test.
Indeed, both processors demonstrate the same low efficiency of the "advanced" L1-L2 data bus (256-bit Advanced Transfer Cache with ECC) utilization – only 51% versus almost 99% in previous Northwood. Despite of the fact that nothing seems to be changed in the title of this bus. Its write efficiency is even less – only 15%, though it should be noted that Northwood does not stand out by this parameter either. Trace Cache, Decode/Execute Efficiency
It's time to examine another important component of the NetBurst microarchitecture (aside from Advanced Transfer Cache) – its special cache for instructions (to be more exact, for micro-operations, provided by the decoder) named Execution Trace Cache. Despite several assumptions about the increase of its size to 16000 micro-operations and the introduction of quadruple fetch of micro-operations for a cycle, nothing of the kind happened. At least in our sample. It should be noted though that Intel reserved the place (in cache/TLB descriptors) for Trace Cache of 16K and even of 32K uops long ago. Perhaps such processors are to be expected in future, and for now we have no choice but to return to our "guinea-pig" CPU samples.
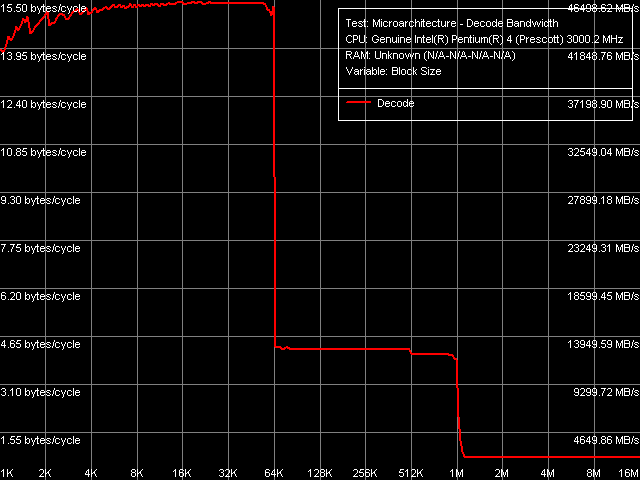 Decode/execute efficiency, Xeon (Nocona) As always, the overall picture of decode/execute speed for "large" 6-byte CMP instructions is the most illustrative. This test, as well as all the other tests, did not reveal quality differences between Prescott and Nocona. Effective Trace Cache size, in terms of the number of micro-operations, reaches 11K uops (considering the necessity of reserving part of it for system needs due to its construction peculiarities). Taking into account the same picture in the earlier Pentium 4 (Northwood) model, we can suppose that Trace Cache organization has not changed since that time. What concerns quantitative estimates characterizing the efficiency of execution units – the differences are not in favour of Nocona. We have highlighted them with color in the tables below. Decode/execute efficiency, Pentium 4 (Prescott)
Decode/execute efficiency, Xeon (Nocona)
Thus, there are differences in rather unexpected places – they relate to the simplest TEST (test eax, eax) and CMP 1 (cmp eax, eax) instructions, which can be executed by the majority of modern processors with the NOP speed. By all the other values Prescott and Nocona are very close. For example, the maximum execution speed of independent micro-operations is 2.85/cycle, that of dependent arithmetic and logic operations – 1.0/cycle. The execution speed of shift operations (SHL, ROL), which, as you can remember, was drastically increased in Prescott core, remained the same in Nocona.
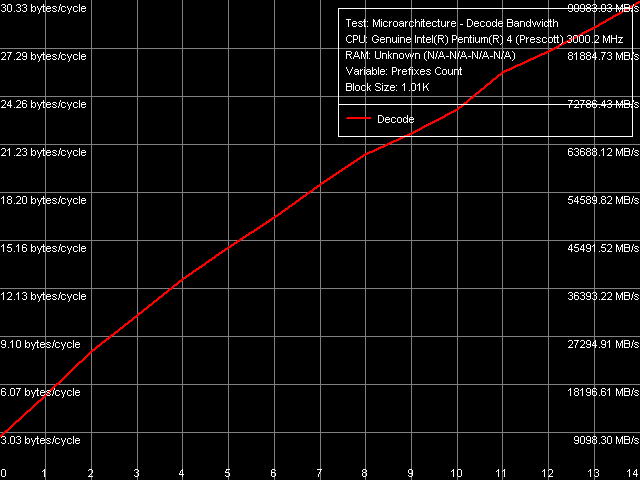
The difference in TEST and CMP behaviour is not the only one found in the processors under review. The second difference is in the efficiency of truncating "meaningless" prefixes in the execution test of the instructions [0x66]nNOP, n = 0..14.
 Prefix instructions decode/execute efficiency, Xeon (Nocona)
The execution speed of micro-operations matching "prefix" NOPs from Trace Cache in the Prescott processor almost does not depend on the number of prefixes (going smoothly down from 2.84 to 2.72 micro-operations/cycle), while their execution speed in Nocona considerably drops with the increase of prefixes. Thus, truncating extra prefixes, which is the function of the x86-instruction decoder located before Trace Cache, is less effective in the latter processor. It's quite logical to assume that this concerns not only prefixes but the operation efficiency of the decoder on the whole. TLB Characteristics
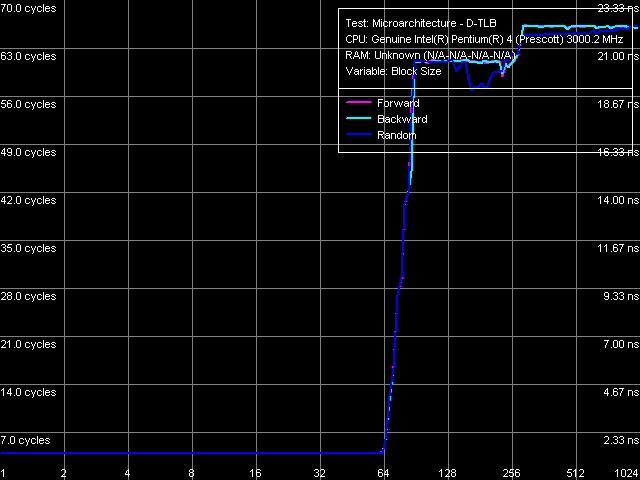
We shall not dwell on the study of D-TLB and I-TLB characteristics, taking into account that they actually coincide both in Prescott and Nocona (by descriptor values obtained by CPUID).
 D-TLB size, Xeon (Nocona) 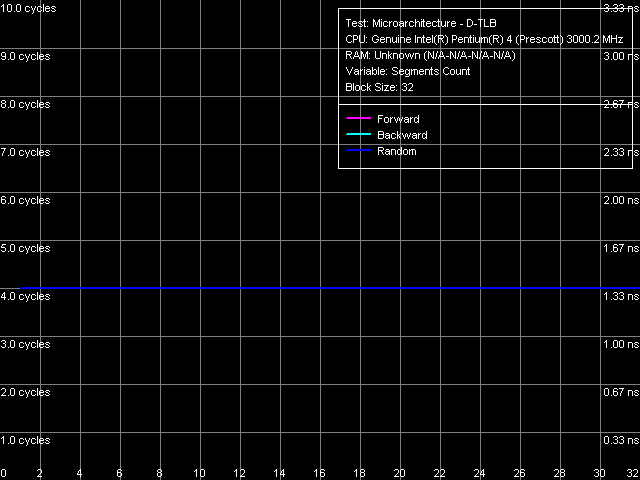 D-TLB associativity, Xeon (Nocona)
So, D-TLB: its size is 64 page entries (we have already seen that in the other test results), a miss penalty (when the TLB size is used up) costs a processor minimum 57 cycles. Associativity – full.
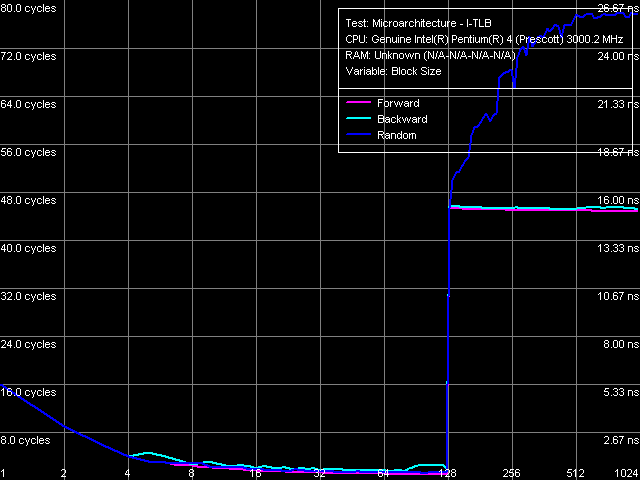 I-TLB size, Xeon (Nocona) 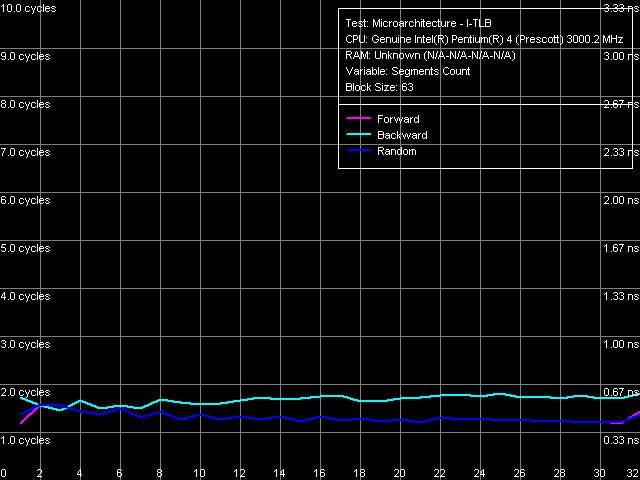 I-TLB associativity, Xeon (Nocona) I-TLB: size – 128 entries (taking into account that Hyper-Threading is disabled on this platform), buffer miss penalty is 45 cycles (forward, backward walk) and more (random walk), associativity – full. Latency/Associativity of the Instruction CacheAnd finally we'll make a small addition to the analysis of microarchitectural characteristics of processor cores (already familiar to you from our series of articles) and introduce our readers to several new test features implemented in RMMA v3.1 and estimate their applicability to the study of NetBurst microarchitecture. Note that the test results obtained with Prescott and Nocona processors are almost identical as many other results, and thus you can consider the data provided below typical to the NetBurst architecture on the whole. Let's analyze results of the I-Cache Latency test for a start. It measures the execution time of unconditional jump operations (one of the enumerated types) in the memory region of the selected size.
Depending on the displacement locations this test gives either an overall picture of the instruction cache "latency" or its associativity picture (for this purpose the test has corresponding presets).
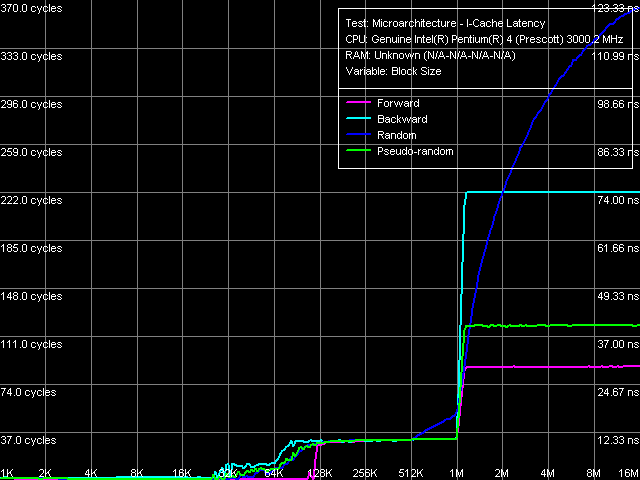 Instruction cache latency, near jump, Xeon (Nocona)
At first look the picture of execution of near jump instruction chains reveals a truly great potential of Trace Cache (effective cache size – up to 110 KB of "code"). Of course you shouldn't take it too literal. Let's perform a more precise quantitative estimation: As the jumps in this test are located at 64 bytes between each other, their actual quantity fit into this size is about 1760. (110K / 64). In other words, this is the exact number of jump instructions, which Trace Cache can decode transforming this code fragment into a linear sequence. In our case, as the code fragment consists only of jmp instructions, you can assume that this code is transformed into a sequence of simple "jump micro-operations", their execution speed being 1 operation/cycle. By the way, note that once we organize the chain walk in a different way, the efficiency of this Trace Cache mode will drop, and it will be very difficult to draw a distinction. The second border in the 1MB region looks distinct in any cases, considering that L2 cache of the processor is an "ordinary" integrated cache for code/data.
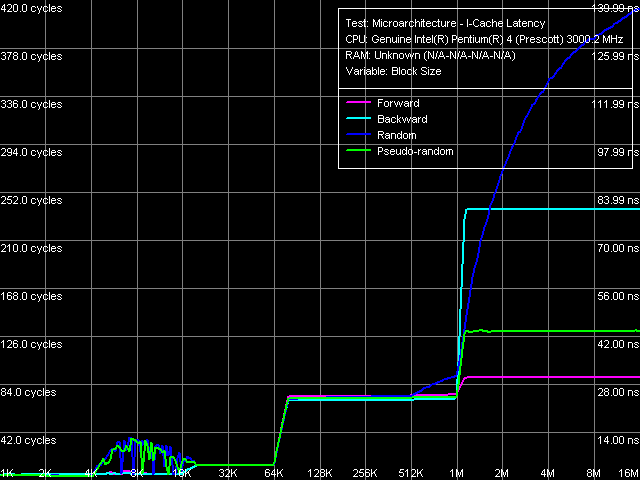 Instruction cache latency, far jump, Xeon (Nocona)
Similar test, but with far jump instructions. The picture looks noticeably different – first of all note the sharp bend in the 64 KB region in all walk modes (so this picture will not help you find out what instruction cache type this processor has – Trace Cache or a common L1 instruction cache of 64 KB). Let's estimate the effective size of Trace Cache in this case: it is 1024 operations (64K / 64). Thus, in this case Trace Cache of the processor can hold 2048 MOV micro-operations (each instruction with the 32bit immediate value constitutes 2 micro-operations) and 1024 "jump micro-operations". Besides, the execution time of one "jump" in such chain is a little higher – about 4-5 cycles, though the accurate estimate of the reason is hardly possible here. It's interesting to note the 4-16 KB region where the random and pseudo-random walk curves demonstrate a "spike". It's obviously connected with the operation peculiarities of Trace Cache BTB (branch target buffer), but it's also very difficult to give an accurate quantitative estimation of this phenomenon (why in this region, why the "latencies" rise by this number of cycles).
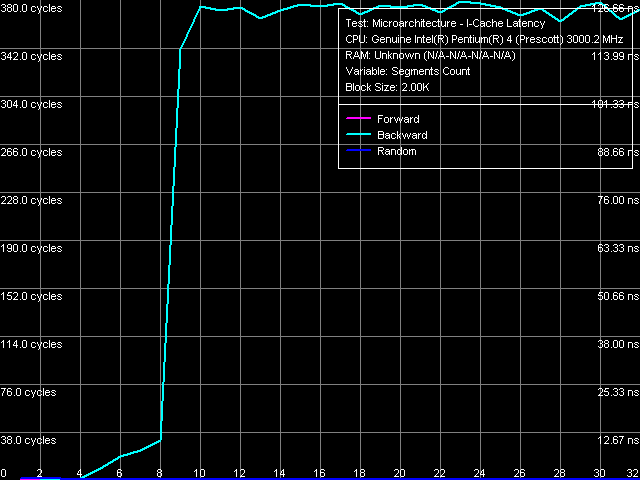 Instruction cache associativity, near jump, Xeon (Nocona) The first test of instruction cache associativity using near jump operations. The result is very interesting – Trace Cache demonstrates "full associativity" at forward and random(!) walks. This means the following: at forward and random walk modes of the small sequence of near jumps at large distances it's completely "decoded" into a linear sequence in Trace Cache, after which it is executed only from this cache without uploading from L2 cache or RAM. Backward walk case is quite unexpected – by the first curve bend you can say that only the first 4 jump operations are cached, and each of the following operations is uploaded from L2 cache. The second bend on this curve in the block of 8 and more 1MB segments corresponds to L2 cache associativity. In this connection we can assume that Trace Cache cannot effectively decode near unconditional jumps in backward order (from a higher virtual memory address to a lower one). Actual Trace Cache associativity for this case is 4. It explains why we observed sort of Trace Cache full associativity at random walk: the fact is that according to statistics a random walk must have one forward jump to one backward jump, and the probability of a four backward jump sequence is much lower.
Let's see what's the case with far jumps.
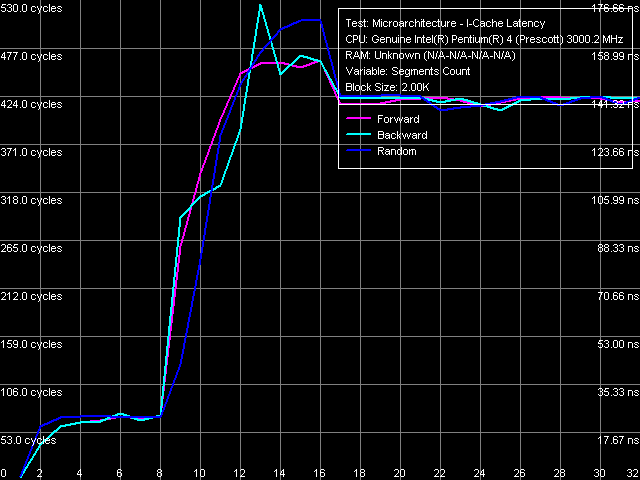 Instruction cache associativity, far jump, Xeon (Nocona) Again an interesting result – in this case Trace Cache acts as a 1-way associativity instruction cache. In other words when executing far jumps at very long distances, these jumps are not cached by Trace Cache at all, they are executed from L2 cache, which associativity in this test is 8-way. To sum up our little analysis we can draw the following quality conclusions concerning the interaction of Trace Cache in processors built on the NetBurst microarchitecture with unconditional jump instructions. 1. Near jumps to closely set addresses (about the size of a cache line) located in any order in the code chain are effectively decoded in Trace Cache into a linear sequence code. The current implementation of Trace Cache can hold over 1000 such operations at a run (if the size of the remaining code permits, in these tests it equals to zero). 2. Far jumps to closely set addresses located in any order in a code chain (up to 1024 operations in the absence of other code) can also be decoded in Trace Cache into a linear sequence code. 3. Near jumps to distant addresses (about the size of a cache segment) located in forward or random order are completely decoded in Trace Cache into a linear sequence code. For all that Trace Cache demonstrates full associativity. 4. If the operations of near jumps to distant addresses (about the size of a cache segment) are located in backward order, Trace Cache can completely decode not more than four such operations demonstrating 4-way effective associativity. 5. Far jumps to distant addresses located in any order cannot be decoded in Trace Cache at all, that is the effective associativity of Trace Cache is this case equals to 1. Instruction Re-Order Buffer (I-ROB)
Another new test (entitled I-ROB) implemented in RMMA v3.1 and higher allows to estimate the depth of an instruction re-order buffer (ROB, I-ROB). The method of this test is very simple – it runs one simple instruction that takes much time to execute (it uses an operation of dependent loading of a subsequent string from memory, mov eax, [eax]) and right after it a series of extremely simple operations which do not depend on the previous instruction (nop). Then ideally, as soon as the execution time of this combo starts to depend on the number of NOPs, the ROB depth can be considered used up.
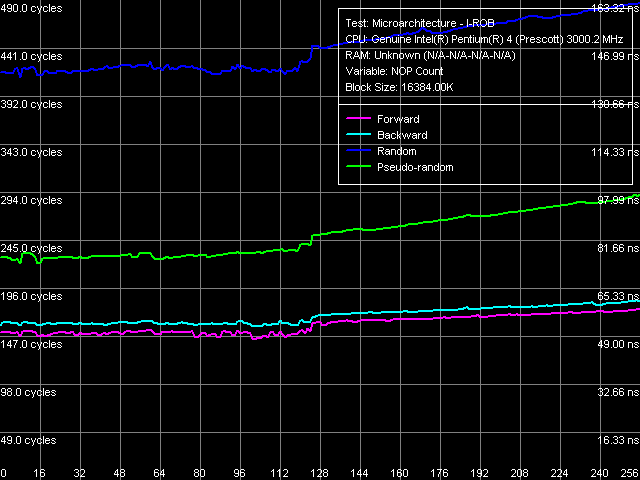 Instruction Re-Order Buffer Depth, Xeon (Nocona) Test result for Xeon Nocona. You can easily notice that the ideal case described above is almost reached on this processor (as well as on all the other Pentium 4 processors characterized by a high level of asynchronism). The inflection can be seen in the region of 120 empty operations which gives us the "average" depth of this buffer, which is very close to the true value declared in the Pentium 4 Prescott documentation (126). Conclusion
Let's sum it all up. According to the results of the new Nocona core analysis we can draw a conclusion that the introduction of EM64T was not in "vain" and resulted in mere deterioration of some low level characteristics of the NetBurst microarchitecture. First of all it affected the decoder of x86 instructions, which is located before Trace Cache in the architectural scheme. On one hand it looks natural – with the introduction of EM64T, the existing architecture (good old IA-32) was expanded with new addressing modes, new register width, and, finally, new registers as such. On the other hand, Intel could have tried to make it better. That's why we get a rather sad tendency for now: introduction of a new technology into the NetBurst architecture inevitably results in negative side effects in its modules. So, SIMD-expansions of SSE3 appeared the first (together with them, according to some sources, appeared presently "hidden" proprietary Intel technologies – LaGrande and VanderPool). So what did we get when upgraded Northwood to Prescott? Doubled L1 latency, L2 latency increased by more than two times, decrease in the effective L1-L2 bus bandwidth, decrease in the code execution efficiency... The list can be continued. At present we witness another NetBurst evolution stage – attempt not to lose much to AMD and offer their own "64bit solutions" to the processors market, which resulted in further decrease in the decode/pipeline efficiency. What are we to expect in future? Introduction of the "multicore" technology with the further infringement of NetBurst potential? As the proverb runs, we'll live and see... I mean, analyze.
The editors express their thanks to the "Niagara" company that provided processors and Xeon Nocona platform Dmitry Besedin (dmitri_b@ixbt.com) Februaty 11, 2005 Write a comment below. No registration needed!
|
Platform · Video · Multimedia · Mobile · Other || About us & Privacy policy · Twitter · Facebook Copyright © Byrds Research & Publishing, Ltd., 1997–2011. All rights reserved. | |||||||||||||||||||||||||||||||||||||||||||||||||||||||||||||||||||||||||||||||||||||||||||||||||||||||||||||||||||||||||||||||||||||||||||||||||||||||||||||||||||||||||||||||||||||||