 |
||
|
||
| ||
Meet the NVIDIA GeForce3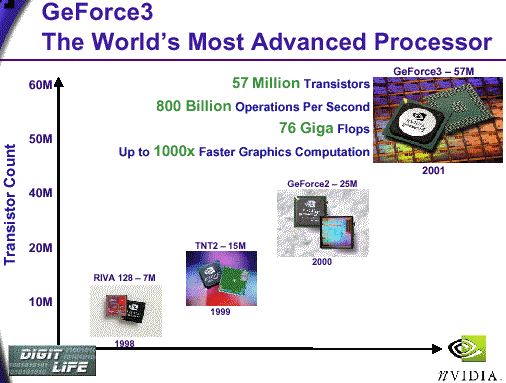 Our readers can read press-releases of the nice NVIDIA company quietly and thoughtfully. As for us, we are going to attract your attention to more technical parameters hidden under Lightspeed Memory Architecture and nfiniteFX(tm) engine concepts. So: GeForce3 specification (NV20)
As you can see, nothing has changed. But for the number of transistors and memory parameters. Those who wish to learn in depth about programmable graphics and geometric pipelines GeForce3 can read "DX8 FAQ" and "Analyses of GPU NV20 functional possibilities". We will discuss various theoretical aspects of realization of new technologies in GeForce3 and give a detailed analyses of performance with synthetical tests and real games. Filtering and fillrateYou have already know that the chip has two texture blocks on each of 4 pixel pipelines (like the GeForce2 GTS/Ultra). But the difference lies in a possibility of accumulation of results of their work, and due to this we can combine up to 4 textures at one operation. In case of trilinear or anisotropic filtering there are two block enabled at the same time, thus reducing a number of textures combined simultaneously (e.g. one trilinear and two bilinear textures). In modern games the scene is built at 2-4 operation using two textures each. We should expect a noticeable performance decrease especially when using 32 pixel anisotropic filtering, but in a real application only one texture, as a rule, is filtered with such looses. Lighting and reflecting maps, detailing textures and others do not require even a trilinear filtering. So, when enabling anisotropy filtering you will get a fall in speed (in the worst case two times decrease). Now let's look at different popular configurations which can be received on different chips:
In parentheses you can find theoretical values of the pixel fillrate. Full-scene anti-aliasing Now it's high time to pay attention to FSAA technologies. Unlike all previous chips (where they used SS FSAA, SSAA), GeForce3 provide possibility for full-screen anti-aliasing on the base of multisampling (MS FSAA, MSAA). This methods economizes significantly a texture fillrate - using one calculated color value for all pixels of the smoothable block. Look at the scheme illustrating different methods of FSAA. Blue and gray colors stand for two nearby polygons. We are watching what happens at their border. Borders need anti-aliasing most of all (due to graduation). The figures mean different calculated color values. If a polygon contains one figure in several positions - it means multisampling, one calculated color value is recorded in several places. GeForce3 is able to record one figure in 1, 2 or 4 resulting pixels of the frame buffer. Anti-aliasing blocks are enclosed in black boxes, within which there recorded equal values for multisampling and different ones for supersampling. An area enclosed with the thick lines is used for forming a resulting color of the pixel outputted on the monitor. Note that this area is not necessary to coincide with one anti-aliasing block, it can overlap the territory of the neighbor ones. In order to mark it a number of pixels is specified which are used in forming of the final value (e.g. 5 or 9 tap). Thus, we organize anti-aliasing of the whole image. Note that multisampling affects performance. First, it needs postprocessing which turns a buffer calculated with superfluous resolution, into a usual one. Secondly, 2 or 4 times extension of the initial buffer loads the memory bus significantly. Thirdly, we have to calculate several color values, on the polygons' borders, for each anti-aliasing block, therefore, the higher the number of small polygons, the higher the losses. But this approach (on real applications) has an advantage over the SSAA. Besides, the patented 1x2 MSAA method named Quincunx allows to reach anti-aliasing quality close to 2x2 FSAA with a considerably lower performance decrease. Caching and balancingDue to a huge number of transistors, as the test results show, the chip's architecture is much better balanced, than the previous creations of NVIDIA. The chips is not limited by the memory bandwidth so often. NVIDIA engineers say that the multitude of caches (for values of textures, frame buffer, Z buffer and geometrical data) and special crossbar architecture (allowing to optimize an access of different chip blocks to data selected from memory or received from the processor, and to results of operation of the previous blocks) allow the GeForce3 to make idle none of the clocks on real applications. The chip uses its potential almost completely. Nobody doubts that a well-balanced chip will perform equally in all applications, while excessive power included in just some blocks is just waste of money. It would hardly play in the majority of real applications. That's why it makes useless to increase further the number of pipelines and texture blocks. What did they do instead of it? Further, we will see for what millions of transistors were spent. Boards, installation and drivers Now up the video cards that we managed to test in our lab. Note that all samples 99% correspond to series cards. Leadtek WinFast GeForce3The card has AGP x2/x4 interface, 64 MBytes DDR SDRAM located on 8 chips on the front side of the PCB. 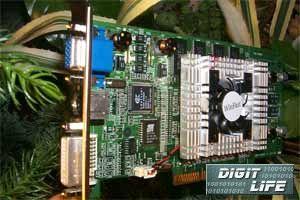 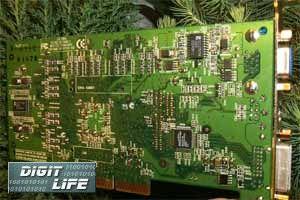 The memory chips are EliteMT 3.8 ns and intended for 263 (526) MHz (see the photo of the memory module in the part on the previous card). Due to the specs, the memory operates at 230 (460) MHz, like in the case of the NVIDIA GeForce2 Ultra cards. Heatsinks on the memory modules are missing, but they will be supplied on the series samples. The card follows the reference design, and all series cards will look the same. Interestingly to note that starting from the NVIDIA GeForce2 Ultra based card Leadtek refused a legacy yellow color and took green coloure of PCB. The boards features a full set of additional functions: TV-out (mounted on the PCB itself) and DVI-interface. Note that in the new design a VGA-connector is moved to he upper part of the PCB, and DVI is, on the contrary, to the lower part. Despite the fact that the GeForce3 has no the second RAMDAC or the second CRTC, it features an integrated TDMS transmitter, it allows to output image to the digital and analog interface. An analog signal from the RAMDAC is doubled on analog outputs of the DVI-I connector. If you connect a DVI-to-VGA adapter to the DVI-I connector you will see a copy of the image shown on the VGA monitor. The GPU is supplied with a traditionally big cooler. 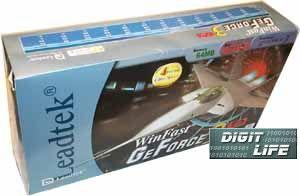 OverclockingWith additional cooling this sample managed to reach 220/255(510) MHz for garphics core and memory corresponded. Note that it's a middle score among the cards under consideration. Gigabyte GA-GF3000DThe card has AGP x2/x4 interface, 64 MBytes DDR SDRAM located on 8 chips on the front side of the PCB. 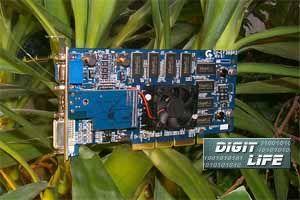 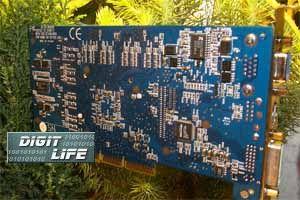 The memory chips are EliteMT 3.8 ns and intended for 263 (526) MHz. Due to the specs, the memory operates at 230 (460) MHz, like in the case of the NVIDIA GeForce2 Ultra cards. Heatsinks on the memory modules are missing, but they will be supplied on the series samples. In design the GA-GF3000D is very similar to the previous card, it's the reference design and all series cards will have the same. The card is bright sky-blue. The boards features a full set of additional functions: TV-out (mounted on the daughter board) and DVI-interface. With the DVI-to-VGA adapter the card can output a copy of the image from the first monitor on the additional monitor (via DVI connector). The GPU has a very effective active cooler. Look at the design of the box for the GA-GF3000D series video card from Gigabyte. 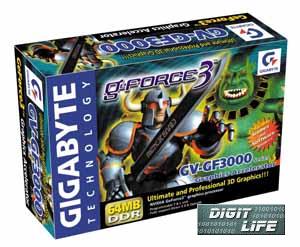 OverclockingWith additional cooling this sample managed to reach 225/255(510) MHz for garphics core and memory corresponded. Note that it's a middle score among the cards under consideration. However, a bit later you will see that the NVIDIA GeForce3 performance is much higher than that of the cards of the former generation. Installation and driversTest system:
Monitors: ViewSonic P810 (21") and ViewSonic P817 (21"). I can say that only 10.50 (beta) drivers have a relatively full support for software of the new graphics processor. We haven't seen yet a final release of the Detonator. For more details on this version you will read in the next 3Digest. The tests were carried out with the VSync disabled, and for comparison we used scores of the following cards: ATI RADEON 64 MBytes (Retail-version, 183/183 MHz) and Leadtek WinFast GeForce2 Ultra. All video cards showed identical performance, that's why we will show their results under one name - NVIDIA GeForce3. NVIDIA GeForce3 possibilities on examples of the DirectX 8.0 SDK |
|
Tweet | ||
So, let's look into all technological gimmicks of the new chip. For testing we will use different examples from the DirectX 8.0 SDK, some of which were modified in order to get a possibility to show the benefit gained due to the compressed Z buffer or HSR. But first look at the several screenshots from perfect technological NVIDIA demo programs using pixel shaders:
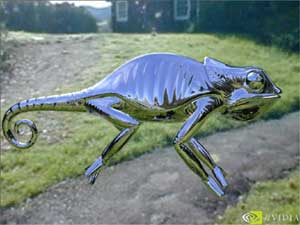
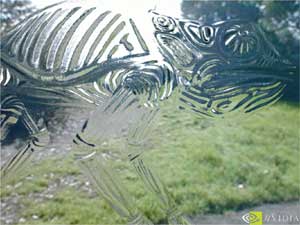

Per pixel reflection, refraction and shades are demonstrated successively. So, the first thing we are going to deal with is pixel shaders. First I should note that the chip doesn't contain any physical interpreter of pixel shader operations - successive implementation is too slow for such tasks. A code of a pixel shader is translated into parameters of setting of 8 stages of the chips' combination pipeline, which got richer, as compared with the previous generation, with multitude of new features allowing not only to implement all shader operations but also to realize some other additional effects which will soon be available via corresponding OGL extensions, and later, possibly, in a new version of the assembler for pixel shaders. So, you should understand that this is only a 8 stage pipeline, even though it's rather flexible in settings.
We have modified the mfcpixelshader program so that it allow us to measure performance of the shader in process. Besides, we have added loading of 4 textures to it:
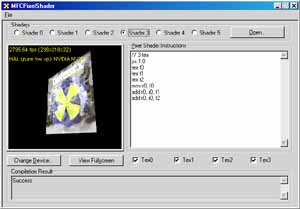
The tests were carried out with usage of several shaders starting from the simplest which doesn't use a single texture and ending with a rather complex shader of 8 operations which enables all texture blocks and the both lighting values. So:
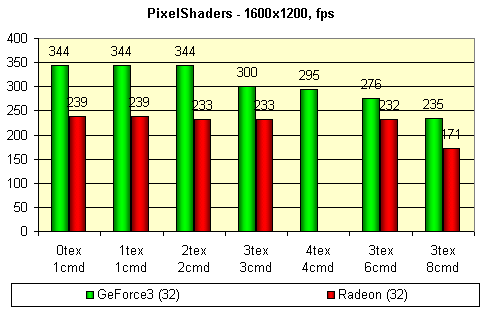
For comparison we have taken the results obtained with the RADEON. The test was done in 1600x1200x32 mode in order to reduce as much as possible a dependence of the results on parameters connected with geometrical transformations. Below you can see code markings of shaders in the form of Xtex Ycmd - where X is a number of textures used simultaneously and Y is a length of a shader in pipeline stages.
The result show an obvious delay in a clock caused by usage of more than 2X textures simultaneously in the GeForce3 and a strange sharp decrease of performance in case of a max lengthy shader. I haven't found an explanation for it but for one that lies in presence of overload in a combination pipeline, for example, when reaching a polygon's edge. As you know, overload time depends on a number of stages. But in this case I don't understand why results of the first four shaders are almost identical.
However that may be those who wish can make experience having downloaded SDK from the Microsoft's site and check all their suggestions.
The following test measures a speed of implementation of a rather complex vertex shader:
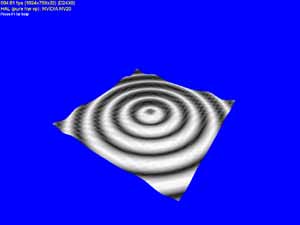
For comparison we have taken results received in
the mode of software emulation of vertex shaders (note that our stand
is equipped with the Pentium III 1000 MHz).
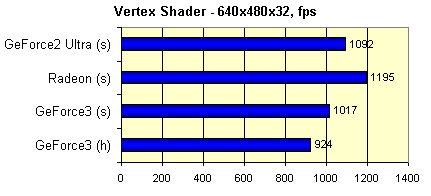
Where (h) means usage of hardware and (s) means usage of software emulated shader. As you can see, a program realization of shaders in the GeForce3 is comparable with the most powerful processors in performance. But remember that in case of its usage the processor's resources are utilized completely, and in case of a software emulation in a real application we would have received lower results, the processor should have been shared for many other tasks not less important than shader emulation.
By the way, vertex shaders is a real program which is successively implemented by the T&L unit. And here a lot of things depend on its length or operations used.
The next test is a matrix blending with usage of two matrices:
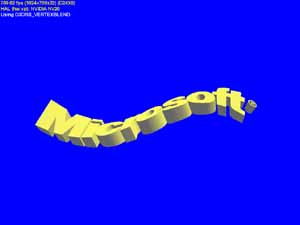
For comparison we have taken results obtained with hardware blending and software emulation both for the matrix blending itself and for a shader equivalent to it.
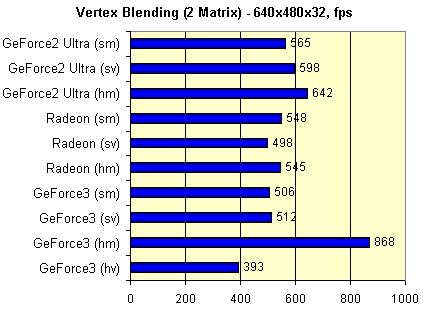
Here (hm) stands for a hardware two-matrix blending, (hv) means an equivalent vertex shader and (sm) and (sv) mean software emulation, correspondingly. The figures are close, but I still should note that in case of the software emulation shaders was beneficial, and in case of the hardware implementation - a simple matrix blending. Here the GeForce3 is much better in performance than the chips of the former generation. It's obvious that for max output programmers have to combine the hardware matrix blending and shaders (for other geometrical needs) realizing their in hardware.
After that we properly examined T&L performance and its interaction with a rasterizer with usage of a modified example of the optimized mesh:

We have received the extreme values (for this not a complex synthetical test with a model consisting of 40,000 polygons), having displayed 32 decreased models simultaneously in a small window. Measurement of its size does no more tell upon the number of triangles processed per second. It means "saturation" of the system processor -T&L. But remember that with release of new, more efficient processors the GeForce3 can show greater scores. For comparison we have taken max results achieved with the software T&L emulation:
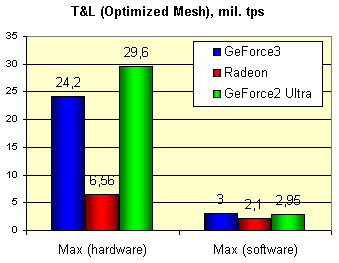
The figures stand for million triangles per second. Interestingly that for the GeForce2 Ultra we have nearly reached the specified value (31 million). And it's still far from 60 for the GeForce3. On this simple test the card falls behind the GeForce2 Ultra according to the difference in a clock speed, what gives me an idea on a identical gross performance of the T&L. The RADEON looks poor here, but we all know that modern games (except such as Giants) haven't used up its T&L potential. After all, we have measured this figure in real applications in order to check how strong rasterization limits the T&L. Here you can see decrease in percentage for different resolutions:
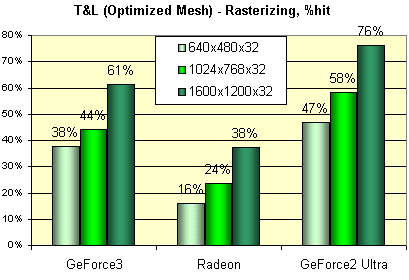
As you can see the RADEON is the most balanced card (at least, in our test). And the GeForce2 Ultra is an obvious outsider - its T&L performance is nearly always unclaimed.
No let's carry out three exclusive tests. Let's disable the Z buffer and examine how this fact affects speed of a scene output, plus we are disabling clipping of reverse planes and optimization of a model before output (optimization means putting its vertices in such order when the vertices used by one triangle are located close in the vertex buffer thus simplifying the life of the vertex cache and the unit of their selection):
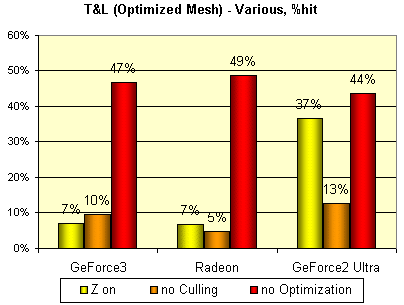
Looking at the results I can say that operation of the RADEON and GeForce3 with the Z buffer is organized very effectively as compared with the GeForce2 Ultra. And the main thing is that they seem to use similar Z compression technologies - the decrease is identical. The RADEON and GF3 have the most effective caching (from an optimized model's point of view), and the Ultra is again an outsider. The HSR influenced not many things in this test, but in any case the reverse planes purposely brought in affects the RADEON least of all.
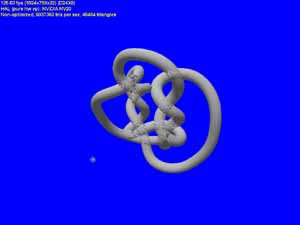
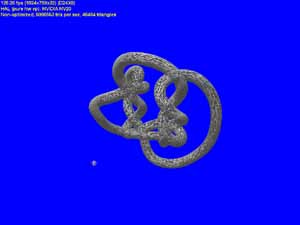
Here you can see an image of the model with disabled Z buffer (1) and reverse planes (2):
And at last let's check performance decreased caused by enabling of the 2X and 4X FSAA (by DX means, from the program itself):
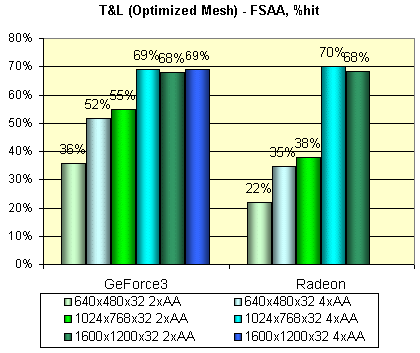
It's obvious that in the GF3 case the MSAA is not free at all on such scenes - a huge number of polygons tells upon here. Besides, I suspect that the 2x MSAA mode activated from the DX 8 programs is not just a 1X2 MSAA but a full value Quincunz, which will be paid attention a bit later.
Now let's test performance of the hardware tesselation of smooth surfaces.
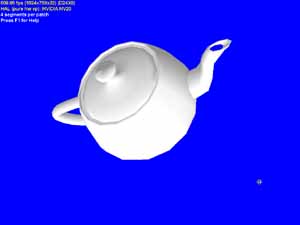

Here is unfortunately nothing to compare with - the T&L software emulation doesn't support this possibility. That's why I will show just a dependence of performance on the number of patch's sides partitioning:
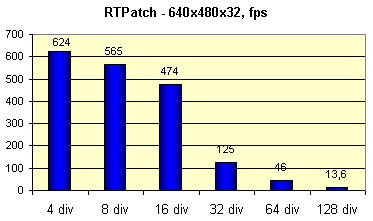
You can see that somewhere after 16 there is a break, but even with the such detailing level the model looks rather smooth.
One more test is the PointSprites. A system of particles reflected from a surface. The results will be given without comments, just note that their realization in the RADEON is done very good in terms of performance (if we took in consideration its clock speed), but it wasn't perfect in quality - the current drivers put a texture on sprites of a unit size incorrectly.
The following test measures shading performance for environment mapping (EM) and EMBM:
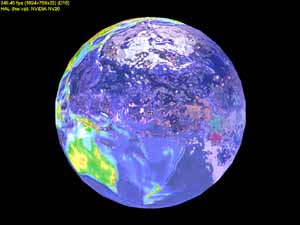
For all cards in this test the EMBM is not free:
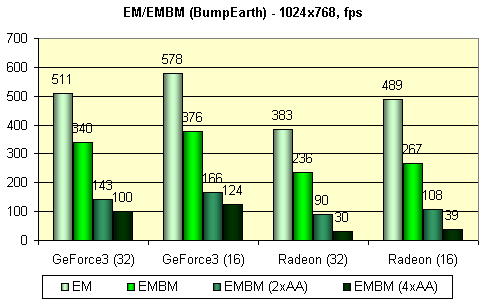
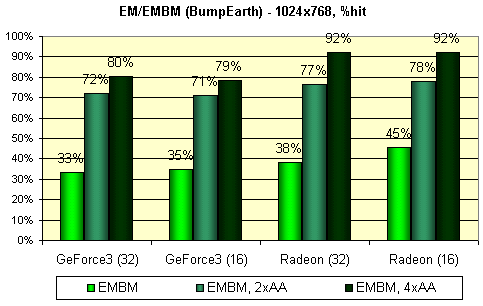
You can see practically identical results in 16 and 32 bit colors and a bit lower performance decrease for the GF3. Besides, I'm surprised with considerable speed decrease with FSAA enabled - even in case of the GF3 in 2X mode. As you can see there are simple DX 8 applications which can lag behind with a great margin due to some reasons with the FSAA enabled. It happens probably due to the fact that they are simple and image building takes the time comparable with that spent for smoothing.
And now up several popular synthetical tests. The 3D Mark allows us to define how the T&L performance depends on the number of light sources:
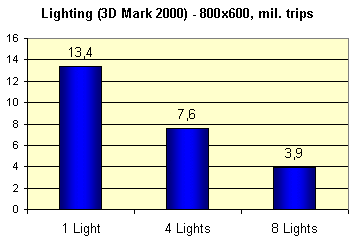
All the same significant linear decrease which is well known on the GeForce2 cards. But remember that vertex shaders compensate this sad fact by a possibility of usage of a greater number of light sources or by usage of more complex lighting technologies to your liking. For the GF3 it's limited only by a length of the shader's program (up to 128 operations). Plus, I will give your theoretical and practical fillrate values:
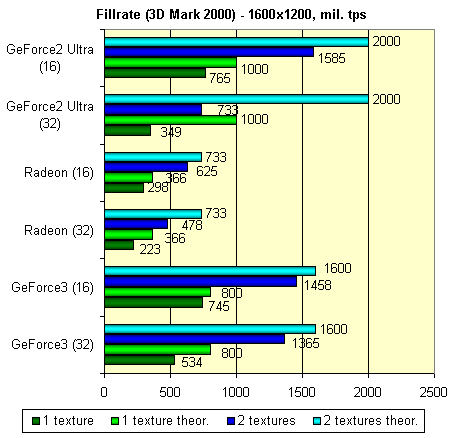
The GF2U turned to be the least balanced architecture, the RADEON and GF3 are the most balanced with alternate success. They are closer to the theoretical values, and therefore they allow to realize potential of their clock speed and pipeline number in a greater degree.
And this test (based on a simple screensaver) allows to check performance decrease of the GeForce3 in different forced MSAA modes described above and selected in the driver's control panel:
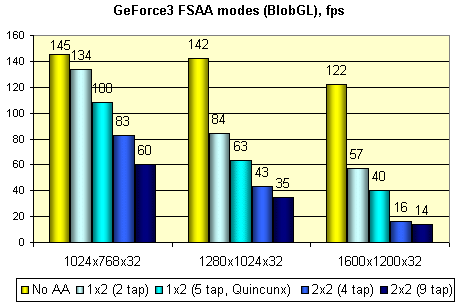
As you can see at 1024x768 we can choose any anti-aliasing methods, 1280 left us 1x2 and Quincunx, and 1600x1200 is better to be used "as is". It's very typical for the GF3. And at last I'd like to run a well known HSR efficiency test, the VillageMark (a scene with a great value of overdraw):
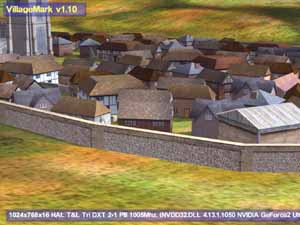
And here are the results:
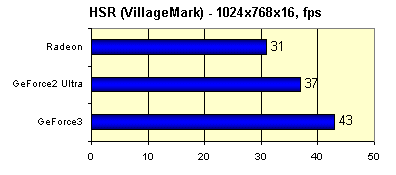
The HSR efficiency of the GeForce3 is undoubted, just look at the value received by the GeForce2 Ultra. But the RADEON has also surprised me... Similarity of results again makes me think that the methods are identical - it seems that the GeForce3 also deals with the hierarchical Z buffer and HSR on its base.
And now comes the TreeMark from NVIDIA.
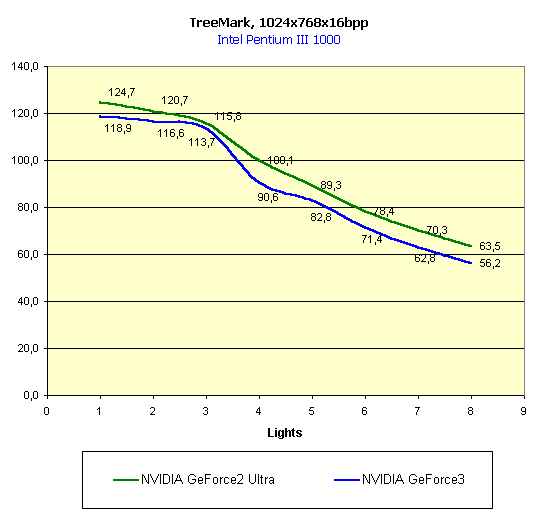
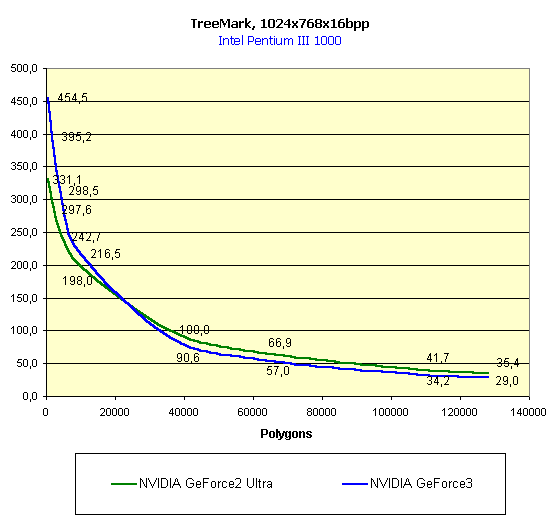
In coarse T&L the GF2U again takes the lead, and in case of small number of polygons it's the GF3 ahead. Well, that's all, now I want you to turn to real applications.
|
Tweet | ||
For tests we used the 1.17 version of the Quake3 Arena from id Software with usage of two benchmarks: demo002 and quaver.
Performance at the max graphics quality and anisotropic filtering
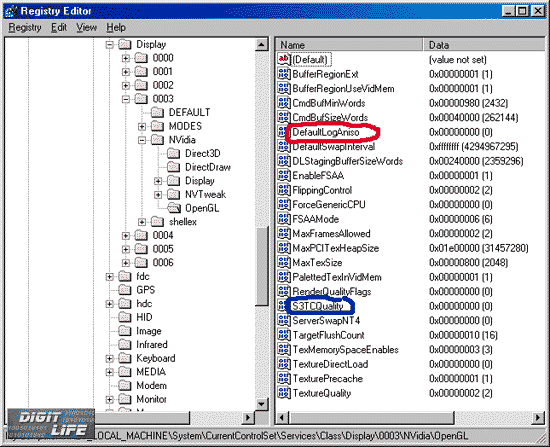
I have purposely shown the screenshot from the registry. Look at the variable marked with the red color - DefaultLogAniso. It is used for enabling of the anisotropic filtering in the OpenGL. Unfortunately the fact that the drivers are still raw tells upon the settings of anisotropy. You won't be able to get it on via display settings. We have found out a formula for the degree of the anisotropic filtering, i.e. a number of used texture samples:
AF=2^(DefaultLogAniso+2)
So, anisotropic filtering on the GeForce3 can be made with 8, 16 or 32 samples. The Net contains data on the 64 sample anisotropy, but it's incredible. Two combined TMU can choose up to 8 samples per clock, i.e. 2 clock are enough for 16-sample anisotropy, and 4 clocks suit 32-sample one. The quality of the 32 sample anisotropy is top notch. Below you will see what decrease in speed is caused by the max number of samples, and you will understand that 64-sample anisotropy is irrational. Besides, the experience showed that the DefaultLogAniso variable has the max value equal to 3.
Note that the tests were implemented at the maximum possible quality level (geometry detailing level - High, texture detailing - #4, trilinear filtering - on)
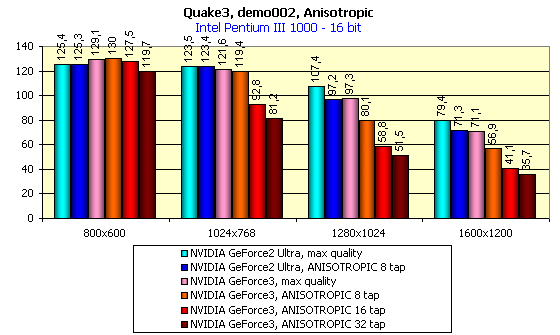
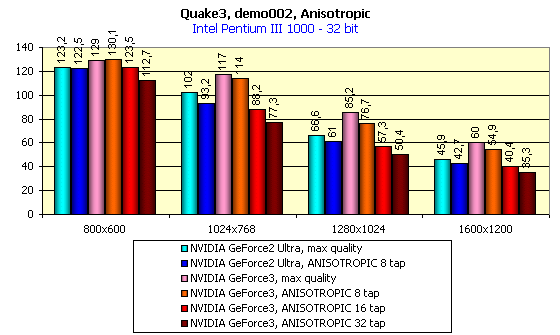
You have to sacrifice to speed in order to get higher quality:
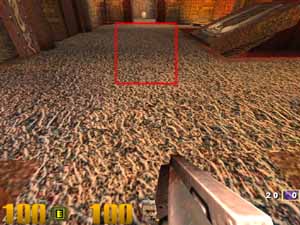
Anisotropic filtering on 8 texture samples

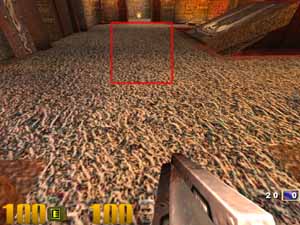
Anisotropic filtering on 16 texture samples
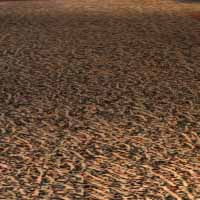
Anisotropic filtering on 32 texture samples
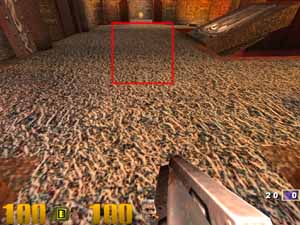

I think that the last screenshot clearly shows what excellent quality and sharpness can be achieved with the GeForce3, having lost, though, around 30 fps in 1024X768X32. It's for you to choose, though.
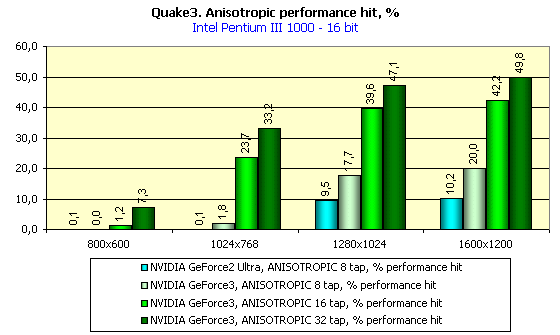
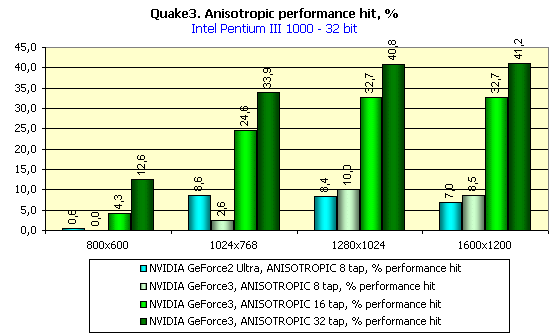
Well, it's really so. But you can choose a compromise solution between the excellent quality and the best performance.
Now I want you to note the GeForce3 performance without anisotropic filtering at the maximum possible quality. In 16-bit color the GeForce3 lags behind the GeForce2 Ultra. And in 32-bit color it strongly outclasses the opponent! And the chip's frequency is lower than that of the GeForce2 Ultra.
New technologies of caching and balanced architecture have worked here. We can play at 1280X1024X32 at the max quality having completely forgotten the fact that the 3D-accelerators sometimes slowed down at that moments when they should have shown all the beauty of the 3D graphics. Now, even the 1600X1200X32 mode gives us a decent level of gameability on the games like Single Play.
In Quake3 there is one level which has already become favorite for testers. This is the Q3DM9 with a lot of large textures, the total size of which usually exceeds 32 MBytes even at low resolutions. A demo benchmark QUAVER appeared some time ago, which serves for measuring performance of accelerators under hard conditions and strong load. When we examined the NVIDIA GeForce2 Ultra, this benchmark helped a lot. Let's see what the NVIDIA GeForce3 can show in this test:
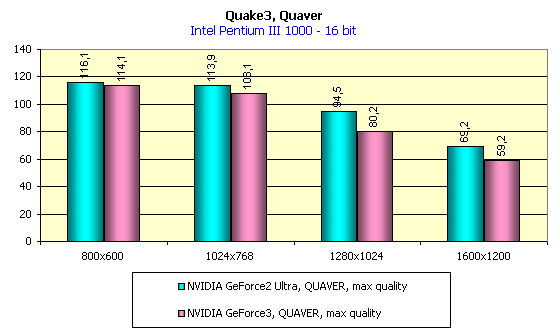
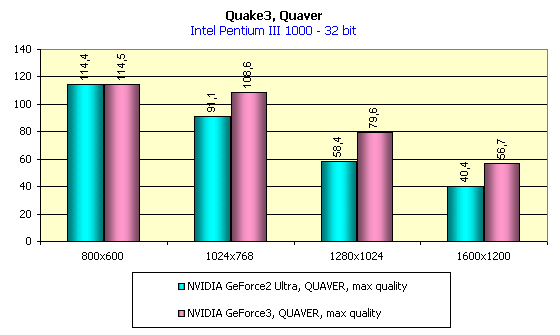
In 16-bit color the situation is the same, and in 32-bit color the GeForce3 has again the lead. And now let's estimate the total performance decrease when moving from 16- to 32-bit color:
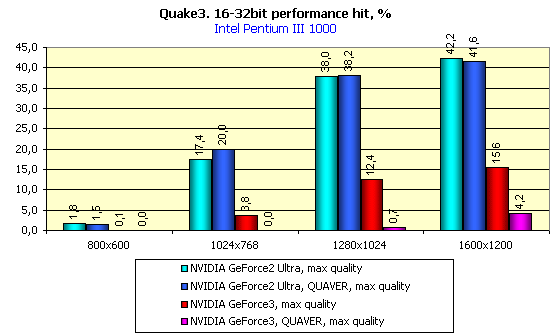
The scores of the GeForce3 are excellent. Video cards of the GeForce3 level (and of the GeForce2 Ultra as well) can give excellent results in the truecolor also. And if your monitor doesn't support high resolutions (like 1600X1200), I recommend you to pay attention to anti-aliasing.
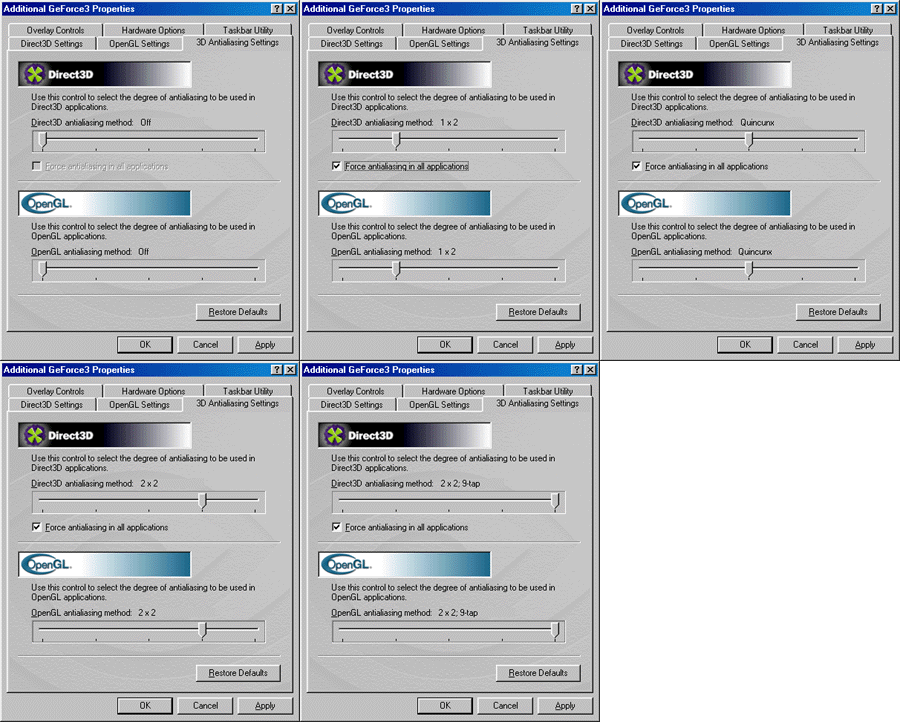
In the 10.50 drivers the setup of anti-aliasing effect (AA) is located in the separate submenu. Settings of AA for Direct3D and OpenGL applications are combined there. Settings for the both API are entirely identical. The NVIDIA GeForce3 uses a new technique of multisampling for
AA realization. We can obtain the following AA modes:
Now we will show what these methods can give in practice.
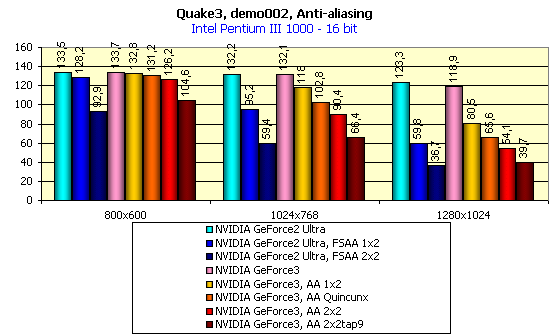
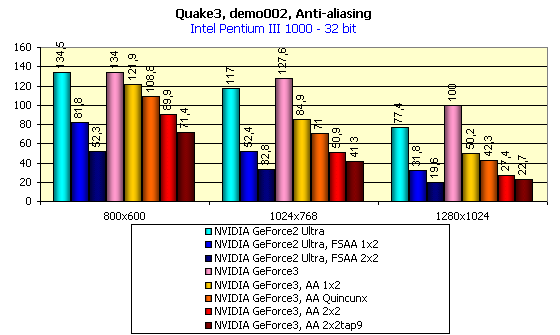
First of all, note that this part of testing was carried out in the 16-bit color in Fast mode, and in 32-bit color we used the High Quality mode.
Let's consider the NVIDIA GeForce3 performance with AA disabled. In 16-bit color it doesn't differ from the NVIDIA GeForce2 Ultra, and in 32-bit color the new GPU showed all its mighty.
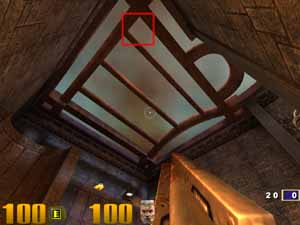
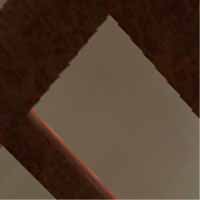
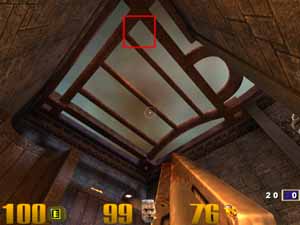
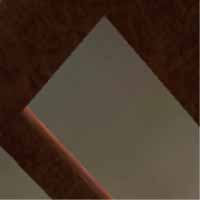
Now let's take a peep at the quality which can be reached in one or another AA mode:
Anti-aliasing 1X2
Anti-aliasing Quincunx
Anti-aliasing 2X2
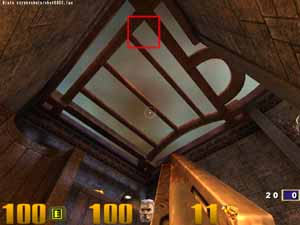
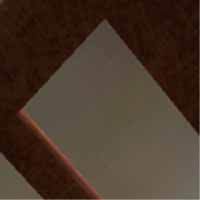
A new AA mode - Quincunx - give us a perfect quality image. Now you should look at the diagrams above. On the GeForce2 Ultra we received good quality only in FSAA 2x2 mode and higher, the colossal part of the performance was lost (e.g. in 1024X768X32 we had only 33 fps). The GeForce3 in the Quincunx mode gives us 71 fps at the same resolution. And AA quality in the majority of situations is higher!
Let's return to the estimation of AA influence on the performance:
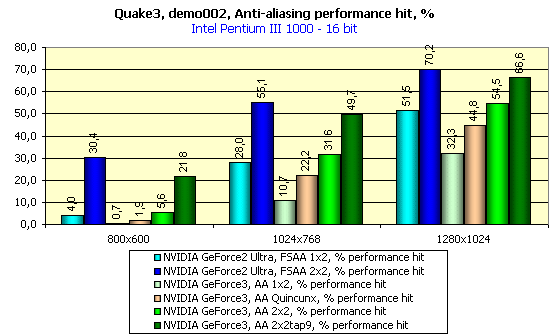
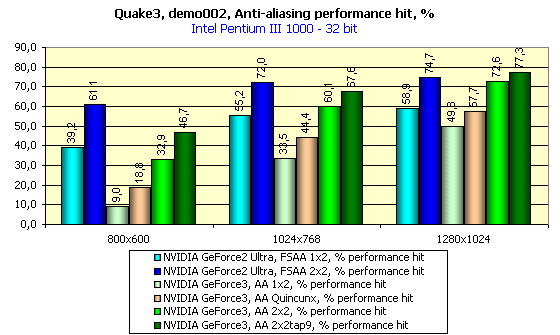
You should remember that in case of the GeForce3 in Quincunx mode (the pink column) AA is equal or better than the 2X2 FSAA in case of the GeForce2 Ultra (the blue column on the diagram) in terms of quality. You can see that the FSAA falls behind everywhere. Of course, the MSAA is not free, but thanks to GeForce3 power it scores super results in performance.
Performance in overclocking mode
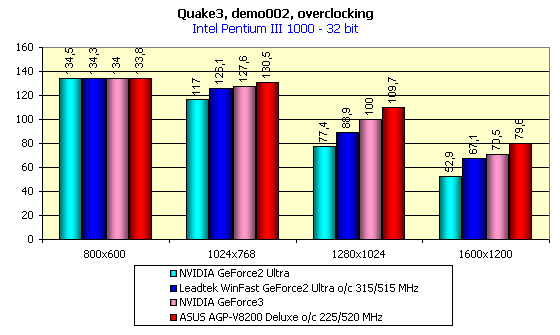
Many owners of the NVIDIA GeForce/GeForce2 based video cards knew that in case of S3TC enabled in the OpenGL in 32-bit color we can get a very unpleasant picture:
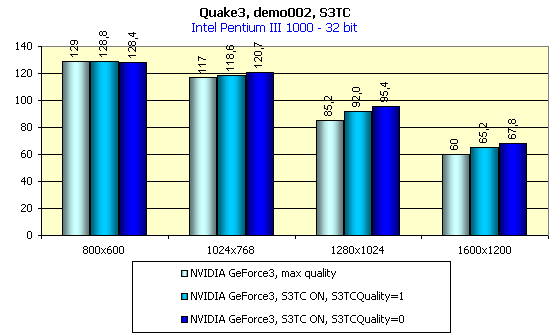
A problem of low quality of the compressed textures on the GeForce / GeForce2 GTS chips is connected with an unpleasant feature of hardware unpacking of textures packed in DXT1 format. When unpacking such textures the chip works with a 16-bit texel. Such realization of decompression leads to banding when unpacking textures which contain color gradients (exactly this effect can be seen in sky textures in Quake3). Unfortunately, the GeForce3 inherits this problem. But not everything is so bad. In this article above we showed a screenshot from the Registry where you can see a S3TCQuality variable marked with the blue pencil. At default it equals 0, and if you set it to 1, the image will change tremendously:
The S3TCQuality keys affects on dynamic texture packing. Having set this key to 1, you will see that the OpenGL driver starts packing textures in DXT3 format instead of the DXT1 format. And there is some fall in speed. The total influence of the S3TC you will see on this diagram (16-bit is not shown - the gain is very slight):
For the tests we used the 1.1 version of the popular benchmark 3DMark 2000 Pro from MadOnion with usage of two tests: Game1 and Game2. The both tests were run at the High Details level.
First let's consider speed scores of the GeForce3 in the Direct3D. While the OpenGL contains for a long time already a universal and popular benchmark Quake3 and provides a possibility of running games on this engine where you can measure an average performance (FAKK2, for example), the Direct3D is poor in this respect. There is a 2.5-year old Expendable, which can't operate adequately if accelerators are loaded with new functions and effects... In 3Digest we are still using Unreal in the Direct3D, which at high resolutions can reflect performance of accelerators quite decently, but raw drivers of the 10.50 version made impossible to use this benchmark due to absence any text in the Unreal. It's just invisible, as well as timedemo. That's why we turned to synthetical tests. In principle, game tests from 3Dmark 2000 reflect the situation of the accelerator load truly. Especially in case of the High Details mode. We tested in this mode:
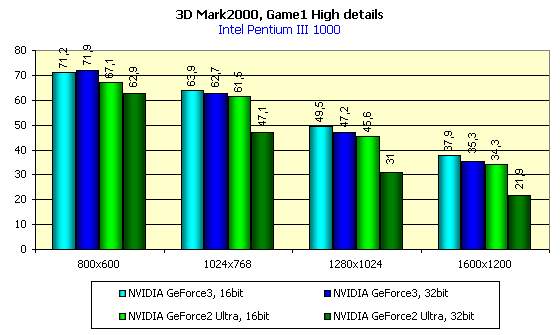
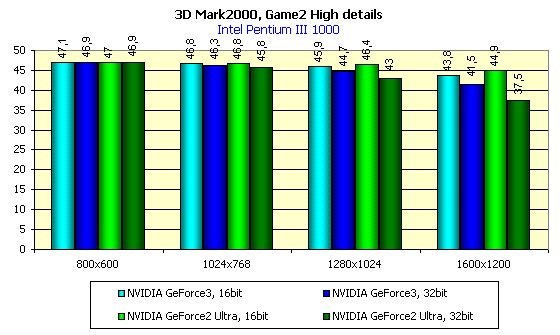
In 16-bit color the GeForce3 is slightly ahead of the GeForce2 Ultra, and in 32-bit color this advantage gets obvious.
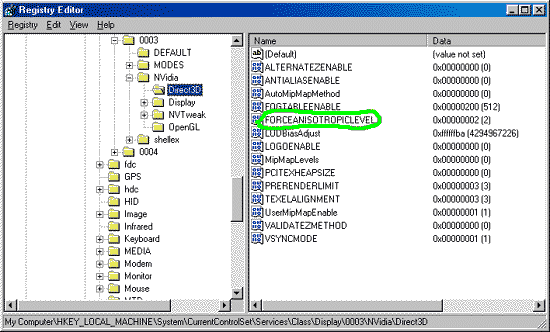
Now I should notice that the NVIDIA drivers at last got a possibility of forcing (forced switching on) of anisotropic filtering in the Direct3D. Earlier only the application itself could control this filtering, but games with anisotropy support are very rare. Now, with changes in the Registry, with the FORCEANISOTROPICLEVEL variable (green marked) equal to 2, we get anisotropic filtering in the Direct3D, though of the lowest level obtained on the base of 8 samples:
What do we get with it?
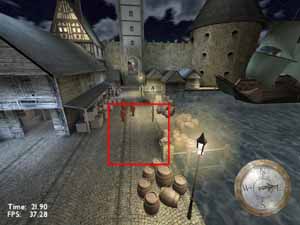
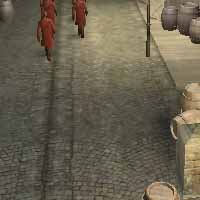
Anisotropic filtering is missing, FORCEANISOTROPICLEVEL=0
Anisotropic filtering is enabled, FORCEANISOTROPICLEVEL=2
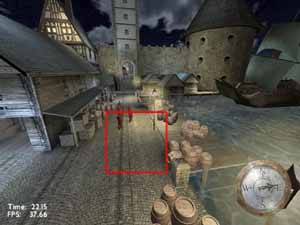
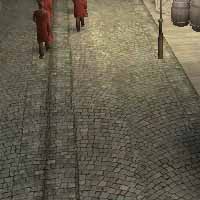
Difference in quality is marked. But how will it tell upon the performance?
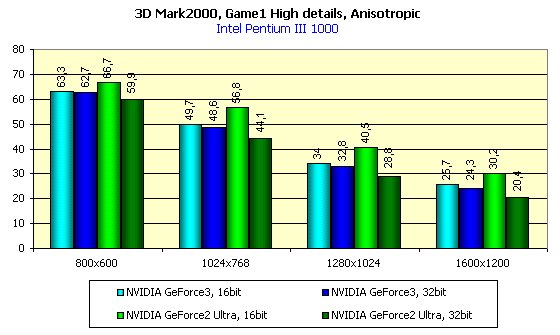
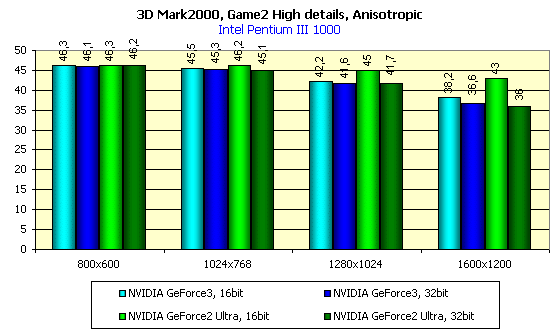
Interestingly to note that the GeForce2 Ultra in 16-bit color enabling of anisotropy affects minimally in terms of speed decrease. It's interesting to estimate influence of the anisotropic filtering on performance:
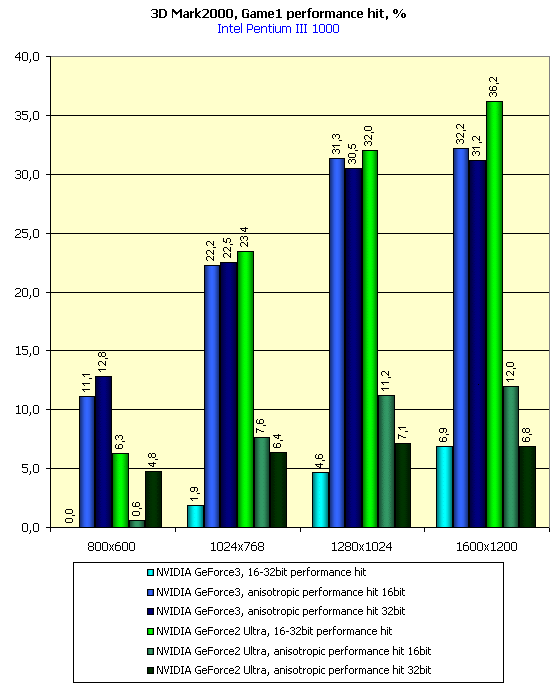
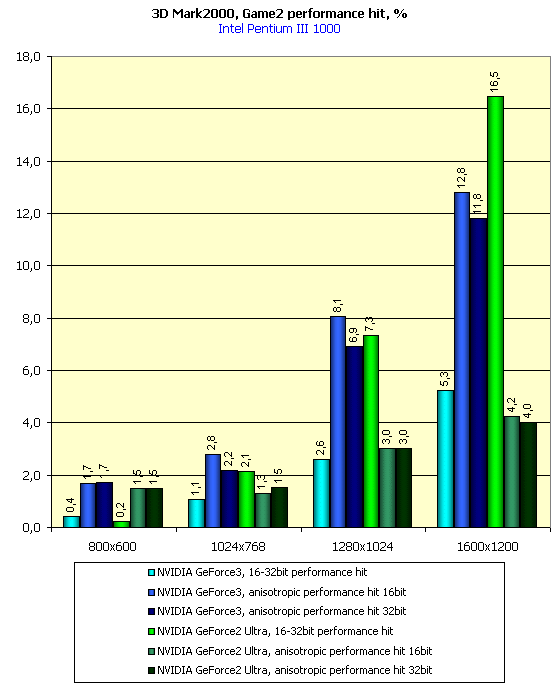
The diagrams show that the speed fall percentage in the GeForce3 with the anisotropy enabled is higher than that of the GeForce2 Ultra. It's possible that the same value of the FORCEANISOTROPICLEVEL variable influences differently the "degree" of anisotropic filtering.
These diagrams show also performance decrease when moving from 16- to 32-bit color. This percentage is very low as compared with the performance decrease in the GeForce2 Ultra.
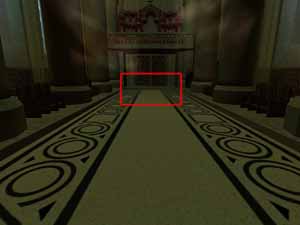
Here is one more example which shows what gives enabling of anisotropic filtering - this is demo NV Gothic:
Anisotropic filtering is disabled, FORCEANISOTROPICLEVEL=0

Anisotropic filtering is enabled, FORCEANISOTROPICLEVEL=2
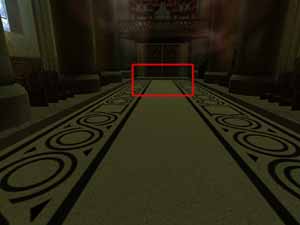

Unfortunately, this application is lacking for an integrated test, that's why we will make only a visual comparison.
Many user want already today to view some new features in the games released. Unfortunately, there is no one game in releases "under DirectX 8.0". Let's turn to the EMBM (Environment
Mapped Bump Mapping) technology. At last, there appeared the first chipset from NVIDIA, which can directly support this precious technology. The EMBM concept is tightly connected with the name Matrox. There are some games where the EMBM technology is not concerned with Matrox. For example, this is Battle Isle4: The Andosia War from Blue Byte:
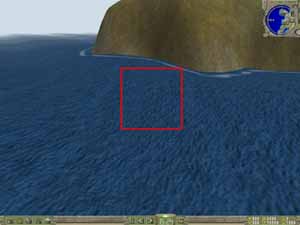
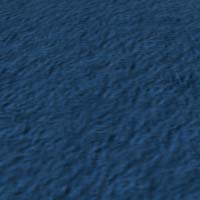
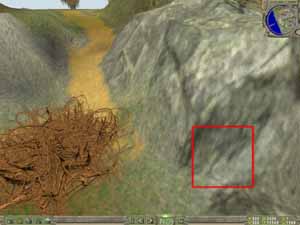
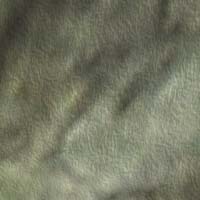
This game uses the EMBM for more realistic screening of all kinds of surfaces on large areas. And in the Colin McRae Rally2 from Codemasters the EMBM can be seen only on the auto (on the number plate and broken windows):
Other issues on the 3D-graphics are considered in depths in the 3Digest where you can find a gallery of screenshots from many games which are received with many video cards.
There is coming an epoch of active application in games of elements of realistic image. There are a lot of ways to get a relief surface. New technologies of shaders give incredible possibilities to developers:
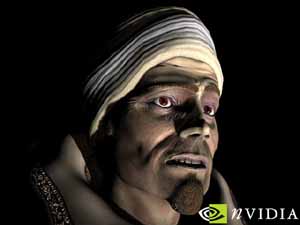

These faces are built in real time mode with the help of the GeForce3 and new possibilities given from the DirectX 8.0. Of course, the times when heroes will have there own mimicry are still too far:


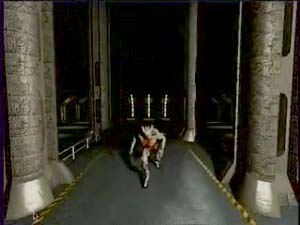
These are shots from the oncoming hit from id Software - DOOM3. Excuse us for not very good quality of screenshots.
As it was fairly noticed at MacWorld, the GeForce2 should be called otherwise, for example, GeForce256 Pro due to absense of revolutionary changes in this chip relatively to the predecessor, and the sign "2" as a symbol of a new GPU generation with quite revolutionary technologies should be given to the GeForce3. Well, anyway, let's draw a conclusion of what we have said today.
So, we have examined the latest GPU - the GeForce3 - from NVIDIA and tested several cards based on it in real and synthetical conditions. Yes, the GeForce3 based cards are samples but they 99% coincide with production cards, which will appear on shelves very soon. Of course, we are going to properly examine production boards as well, and of course we are waiting for release drivers for the GeForce3. Later, we are going to publish some more reviews on the GeForce3. And do read our 3Digest where now you will find also the NVIDIA GeForce3.
Write a comment below. No registration needed!
|
Article navigation: |
| blog comments powered by Disqus |
| Most Popular Reviews | More RSS |
 |
Comparing old, cheap solutions from AMD with new, budget offerings from Intel.
February 1, 2013 · Processor Roundups |
 |
Inno3D GeForce GTX 670 iChill, Inno3D GeForce GTX 660 Ti Graphics Cards A couple of mid-range adapters with original cooling systems.
January 30, 2013 · Video cards: NVIDIA GPUs |
 |
Creative Sound Blaster X-Fi Surround 5.1 An external X-Fi solution in tests.
September 9, 2008 · Sound Cards |
 |
The first worthwhile Piledriver CPU.
September 11, 2012 · Processors: AMD |
 |
Consumed Power, Energy Consumption: Ivy Bridge vs. Sandy Bridge Trying out the new method.
September 18, 2012 · Processors: Intel |
| Latest Reviews | More RSS |
 |
Retested all graphics cards with the new drivers.
Oct 18, 2013 · 3Digests
|
 |
Added new benchmarks: BioShock Infinite and Metro: Last Light.
Sep 06, 2013 · 3Digests
|
 |
Added the test results of NVIDIA GeForce GTX 760 and AMD Radeon HD 7730.
Aug 05, 2013 · 3Digests
|
 |
Gainward GeForce GTX 650 Ti BOOST 2GB Golden Sample Graphics Card An excellent hybrid of GeForce GTX 650 Ti and GeForce GTX 660.
Jun 24, 2013 · Video cards: NVIDIA GPUs
|
 |
Added the test results of NVIDIA GeForce GTX 770/780.
Jun 03, 2013 · 3Digests
|
| Latest News | More RSS |
Platform · Video · Multimedia · Mobile · Other || About us & Privacy policy · Twitter · Facebook
Copyright © Byrds Research & Publishing, Ltd., 1997–2011. All rights reserved.