 |
||
|
||
| ||
|
||
|
||
| ||
[ Part III ] 3D graphics, 3DMark2001 - synthetic testsFillrateWe measured this parameter only for 32-bit color depth:
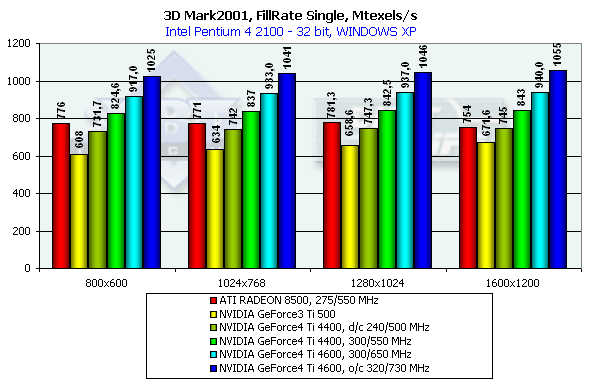 The NV25 is again a leader. It is of really great interest to compare shading efficiency of the NV25 operating at the rated frequency of the Ti500 (240/500). The gain is noticeable, that is why architectural optimization of the fill pipeline and memory controller is also significant. The theoretical limit of this test is 960M pixels/sec for the Ti 500, 1100 for the RADEON 8500 and 1200 for the Ti 4600. This time the NV25's architecture approaches the theoretically maximum fillrate comparable to the R200. Despite the same production technology and just a little greater number of transistors the NV25 easily outdoes the NV20 both in the limiting working frequency and in efficiency of operation at the same frequency.
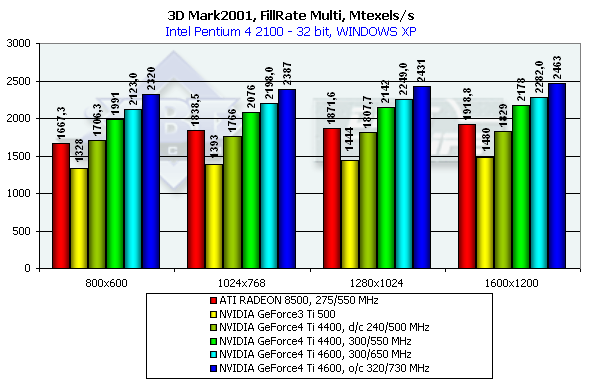 In case of several textures the chips have drawn much nearer to the theoretical limit. The best result of this test can be achieved at the highest resolution. Scene with a great number of polygonsRemember that in the highest resolution the dependence on a fill rate almost disappears:
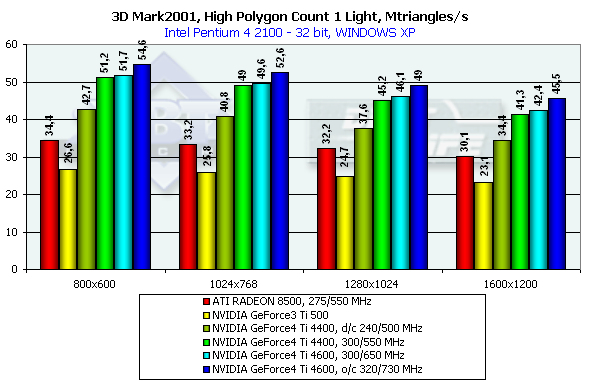 The NV25 becomes a leader when one light source is used. Its result is very close to the practical limiting bandwidth for triangles obtained earlier with the Optimized Mesh from DX8.1 SDK. You can see that the overall efficiency has increased due to the second shader unit if you compare results of the NV25 and NV20 at the same frequency. The R200 also came very close to the limiting value obtained in the SDK test, but it considerably falls behind in the absolute value, although the core frequency is almost equal to the NV25.
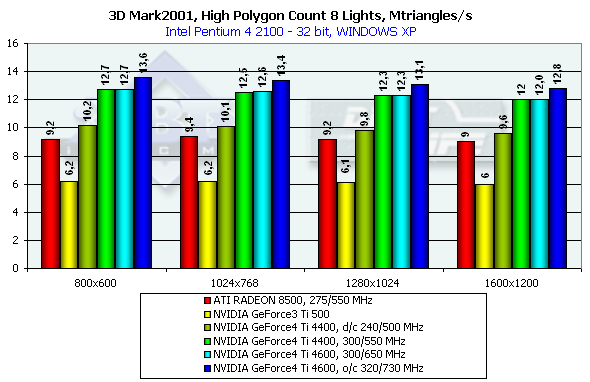 In case of 8 light sources the performance of the R200 falls down slower as compared with the NV20 and NV25, though the palm still belongs to NVIDIA. Relief texturingLook at the results of a synthetic EMBM scene:
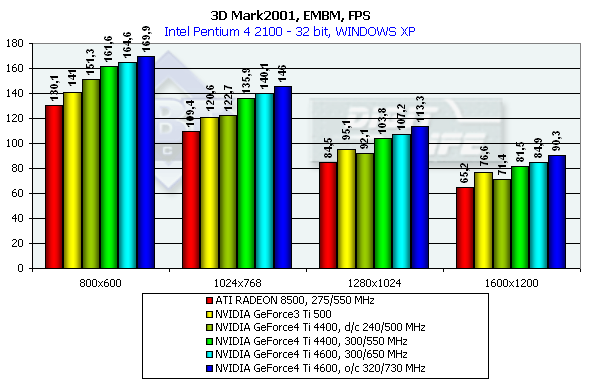 The results reflect EMBM mostly in high resolutions; in 800x600 the the determining factor is geometry. It is interesting that at the same frequency the EMBM is implemented by the NV25 slower than by the NV20 - probably it is a cost of optimization of the fill pipeline which is very effective in case of usual shading and especially beneficial when the MSAA is enabled. And now comes the DP3 relief:
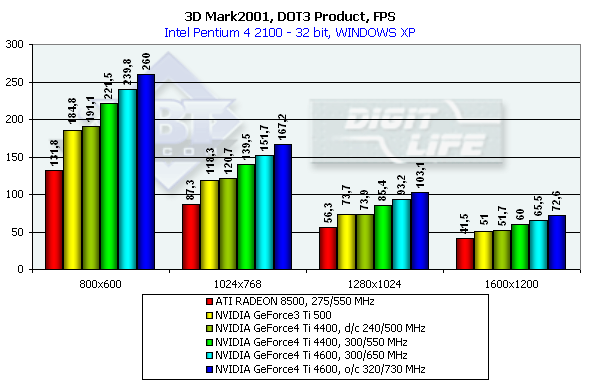 The NV25 again leads. Vertex shadersThe test results are shown for several resolutions.
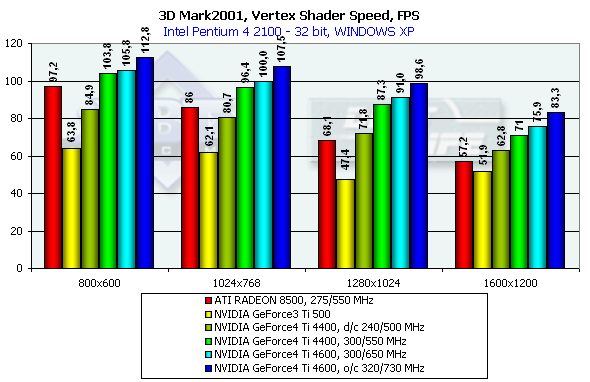 As the resolution increases the R200 becomes weaker as it is limited by the shading efficiency; the speed of the NV25 goes down much slower. Besides, the dual T&L of the NV25 is twice better in its architecture than the NV20 at the same frequency. Pixel shaderTaking into account that in too low resolutions a bottleneck is geometry, and in too high ones it is memory bandwidth let's take a look at 1024x768 and 1280x1024:
The NV25 thrives again despite the same frequency with the NV20. However, pixel shaders do not have a great architectural advantage as the possibility of hardware realization is much poorer as compared with vertex shaders. Sprites
The NV25 outscores the NV20 by a great margin at the same frequency. In the low resolution a geometry processing speed makes a decent effect, but in middle ones everything takes its places again. I can't say the NV25 is leading firmly, but it is well seen that the NV25 was much improved as compared with NV20. Besides, its capabilities of sprite scaling are also wider. Well, in the synthetic tests the NVIDIA GeForce4 Ti 4600 takes the palm, but you should remember that only real applications will let us make the final conclusions. 3D graphics, 3DMark2001 - gaming tests3DMark2001, 3DMARKS
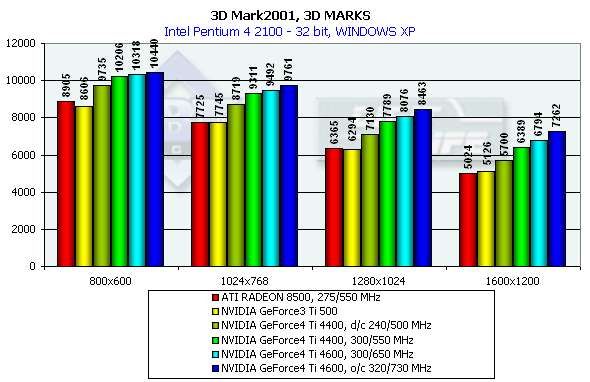
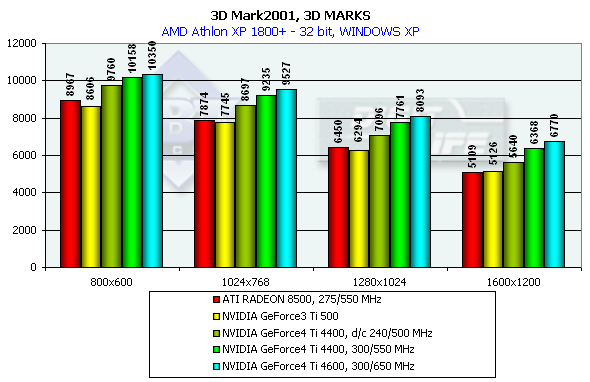
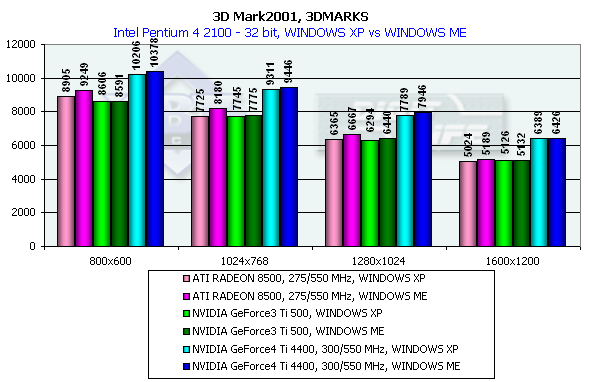 According to the general benchmarks the GeForce4 outscores its predecessor by 30%. The RADEON 8500 lost to the GeForce3 Ti 500 in the 3DMark2001 test. The 3DMark2001 includes 4 gaming tests, three of which are implemented at low and high detailing graphics levels. High detailing means that the processor and video accelerator are much more loaded with additional effects and polygonal complexity of the scenes. However, at a high detailing level in these tests the performance becomes limited by a CPU frequency in case of a highly efficient accelerator. The GeForce 4 proved it. And we had to exclude High Detail tests. 3DMark2001, Game1 Low details
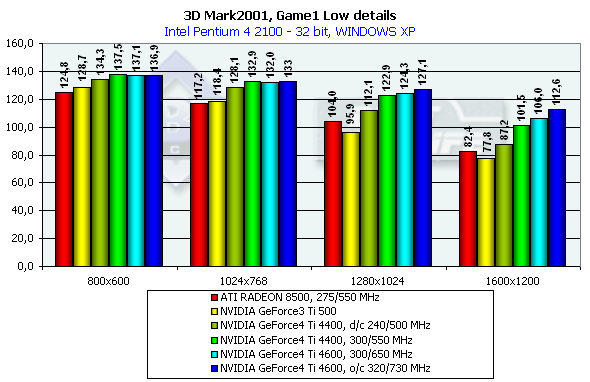
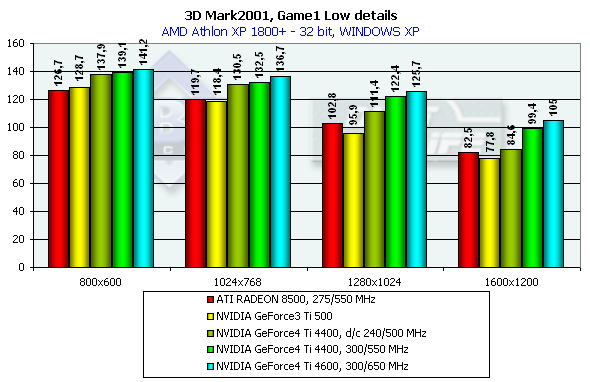
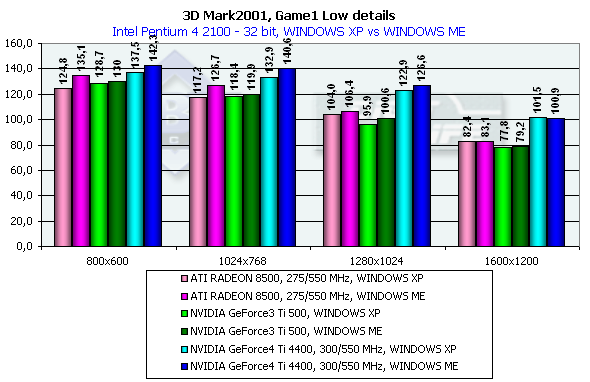 This is a war auto simulator. The developers state that this game scene spends processor time for calculation of physics and motion of objects as a real game. Characteristics:
In 1600x1200x32 the GeForce3 Ti 500 is beaten by the GeForce4 Ti 4400 by 30.5%, and by the GeForce4 Ti 4600 by 36.2%. If we compare OSs we will see that the results in the XP are worse than in the ME. 3DMark2001, Game2 Low details
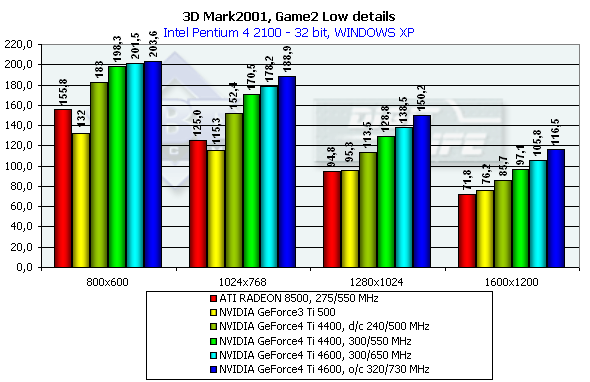
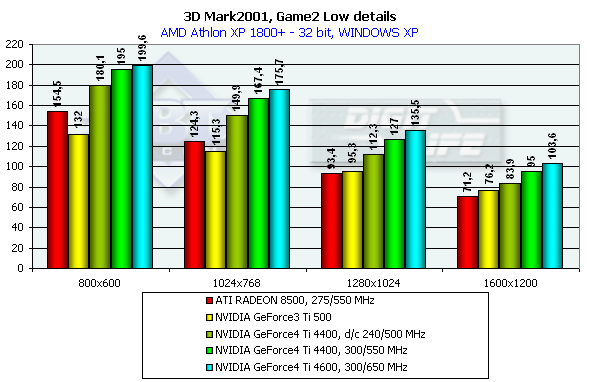
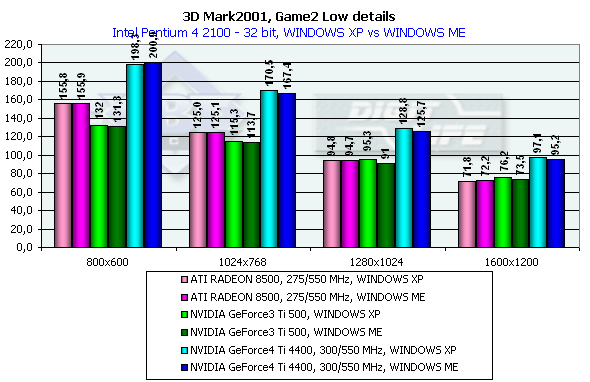 This is an arcade scene from a 3D Adventure or strategic game. The scenes have a high overdraw factor and a weak optimization of the geometry. The accelerator must provide optimization of operation with a Z-buffer. Characteristics:
In 1600x1200x32 the GeForce3 Ti 500 is beaten by the GeForce4 Ti 4400 by 27.4%, and by the GeForce4 Ti 4600 by 38.8%, and in 1280x1024x32 the figures are 35.1% and 45.3% respectively. It is interesting that again the peak falls on 1280x1024 and the drop falls on 1600x1200. The ATI RADEON 8500 performs equally in Widows XP and ME, and the NVIDIA shows better scores in the former one. 3DMark2001, Game3 Low details
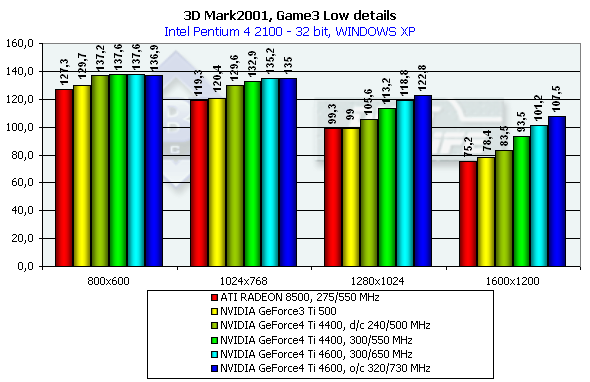
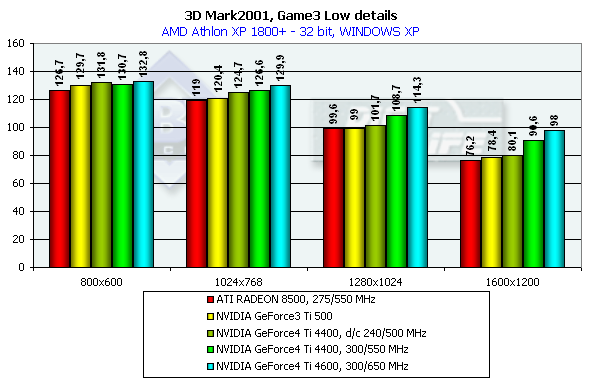
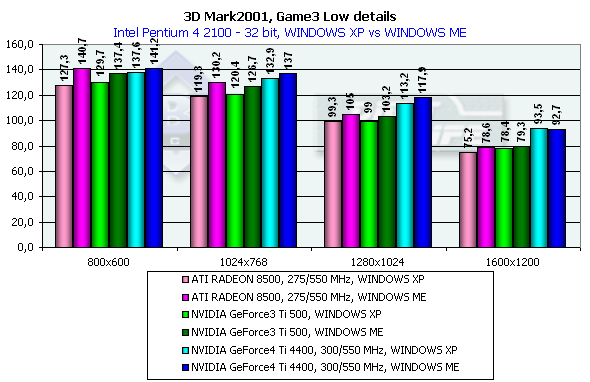 The scene is based on the "Matrix". A detail level is not high, it corresponds to the Quake2. There is skinning (matrix blending) and skeletal animation, detailed textures and a great deal of various bullet shells and pieces which load the GPU very much. Characteristics:
In 1600x1200x32 the GeForce3 Ti 500 falls behind the GeForce4 Ti 4400 by 19.3%, and behind the GeForce4 Ti 4600 by 29.1%. Comparison of the OSs showed that the performance of all cards is higher in the ME. 3DMark2001, Game4
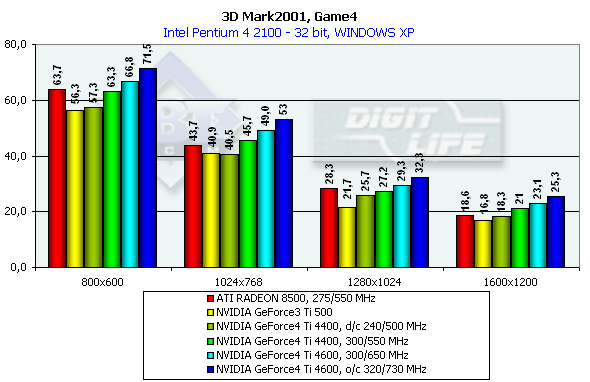
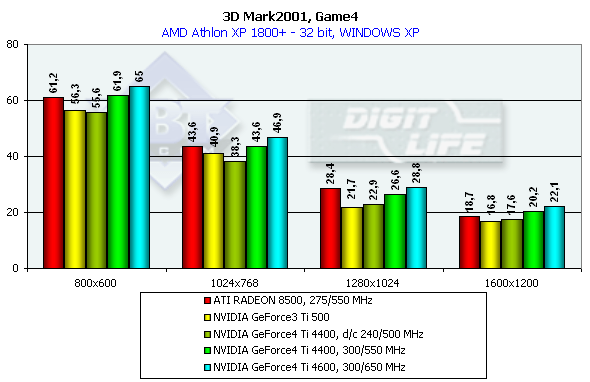
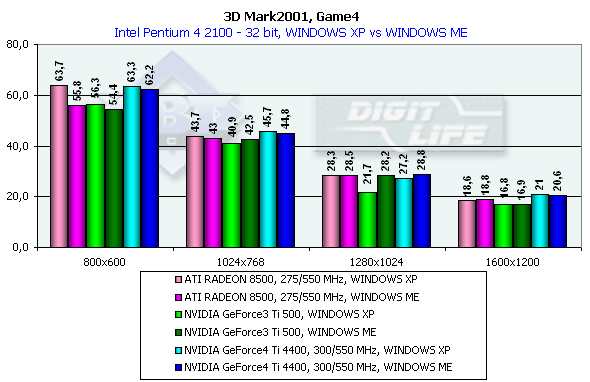 This test uses pixel shaders, vertex shaders and cube texturing to form water surfaces. That is why it is better to play this game only on the GeForce3/4 or RADEON 8500 (in the demo mode water surface is not displayed). Characteristics:
In 1600x1200x32 the GeForce3 Ti 500 falls behind the GeForce4 Ti 4400 by 25%, and behind the GeForce4 Ti 4600 by 37.5%. Comparison of the OSs showed that the NVIDIA card performs better in the ME and the ATI RADEON 8500 has equal results both under ME and XP. 3D graphics, gaming testsTo estimate performance in 3D games we used the following tests:
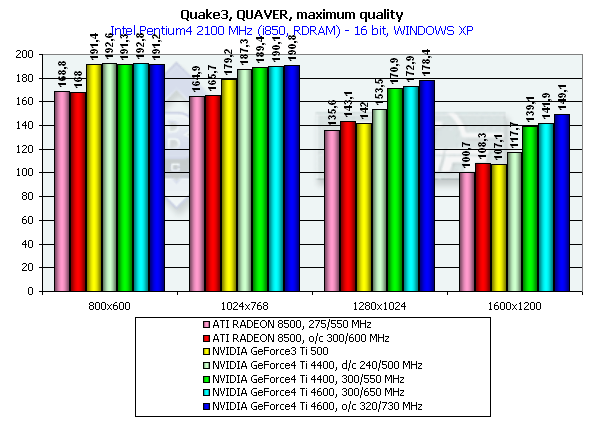
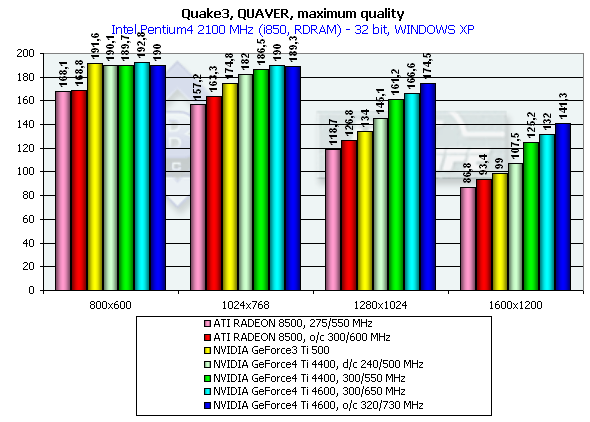
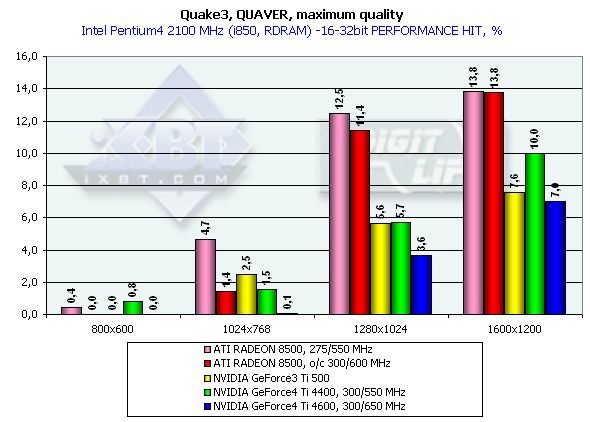
Quake3 ArenaQuaver, highest quality modesThe tests with Quaver were carried out in 16-bit and 32-bit color modes at the highest detailing and complexity levels of geometry (r_subdivisions "1" r_lodCurveError "30000"). This benchmark loads accelerators with complicated geometry as well as with huge textures and a great deal of effects. Pentium 4 2100
 Athlon XP 1800+
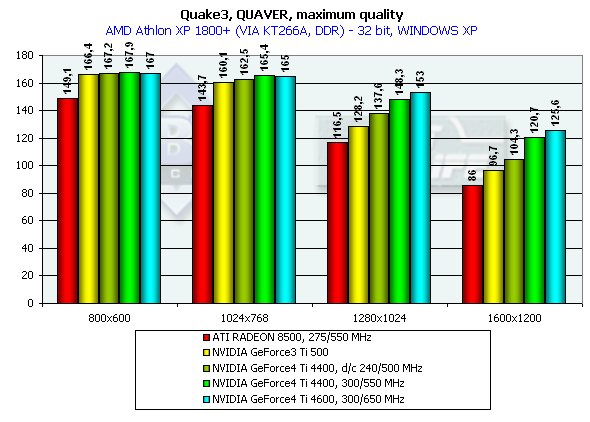 The GeForce 4 which was purposely slowed down to the frequency of Ti 500 (d/c 240/500 MHz) shows much better performance than the Ti 500 which means good optimization of different units of the GeForce4 in comparison to the GF3. We also overclocked the ATI RADEON 8500 to the assumed level of the next revision - 300/300 (600) MHz, and we can see that such gain won't help the chip.
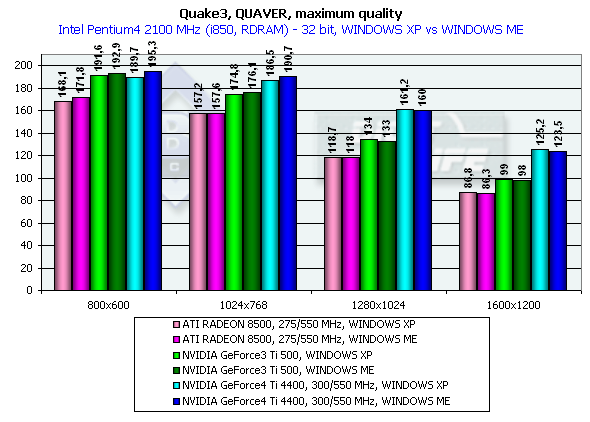
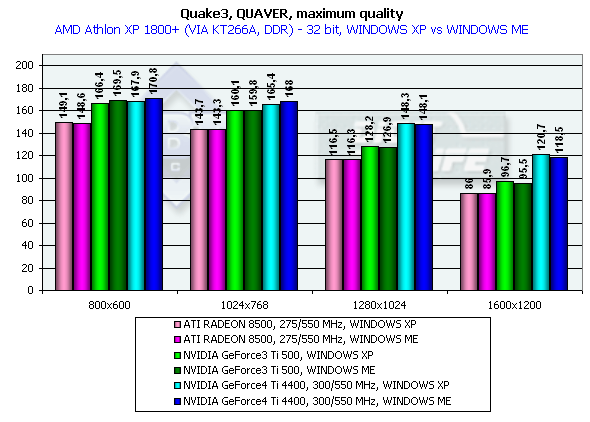 Both developers worked well on the OpenGL ICD making the performances equal in the Windows XP and Windows ME, and the NVIDIA's drivers do have better results in the Windows XP. In 1280x1024x32 the GeForce3 Ti 500 lags behind the GeForce4 Ti 4400 by 20.3% and behind the GeForce4 Ti 4600 by 24.3%. In 1600x1200x32 the figures are 26.5% and 33.3% respectively. The chip's frequency grew up from 240 to 300 MHz and now amounts to 25%. [ Part V ]
Write a comment below. No registration needed!
|
|
Platform · Video · Multimedia · Mobile · Other || About us & Privacy policy · Twitter · Facebook
Copyright © Byrds Research & Publishing, Ltd., 1997–2011. All rights reserved.


