 |
||
|
||
| ||
|
||
|
||
| ||
[ Part II ] Test results2D graphicsImage quality in 2D is excellent. You can work comfortably in 1600x1200 at 85 Hz. I think that the quality of the Matrox G400/G450 is achieved in this respect. Remember that estimation of 2D quality is subjective and depends on a certain card and on compatibility of a video card and a monitor. 3D graphics, MS DirectX 8.1 SDK - extreme testsWe used modified examples from the latest version of the DirectX SDK (8.1, release). Optimized MeshThis test demonstrates a practical limit of an accelerator's throughput when triangles are used. Several models are displayed simultaneously in a small window, each consisting of 50,000 triangles. No texturing. The models are minimal in size: each triangle is not greater than 1 pixel. Such result can not be obtained for real applications where triangles are usually large and where lighting textures are used. Below there are results for three drawing methods - Optimized for an optimal drawing speed (taking into account an internal cache of vertices on the chip), Unoptimized and Strip (when one Triangle Strip is displayed):
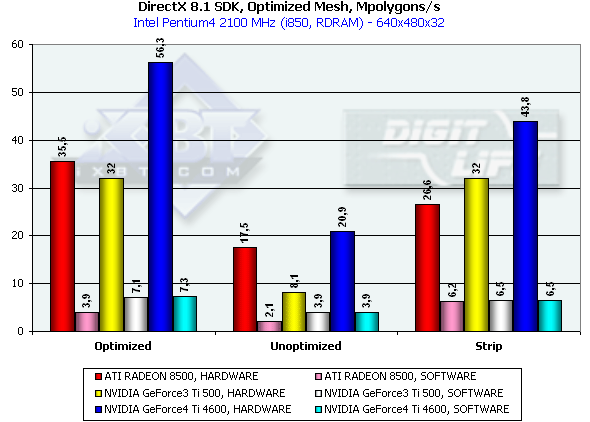 In the first case, Optimized model, the memory subsystem doesn't have a great effect, and we measure a pure performance of transformation and drawing of triangles. The Ti 4600 (NV25) thrives. 56M triangles/sec is a twice higher result as compared with the RADEON 8500 and Ti 500. This is achievement of the second T&L unit. In case of the Unoptimized model we measure efficiency of caching and of memory bandwidth. The result of the NV25 is proportional to the difference in frequencies of the R 8500 and Ti 4600. In case of the Strip the R200 loses; the NV25 beats the NV20 in accordance with the frequency difference. The NV20 and NV25 performs better when the program geometry calculation is activated forcedly. The NVIDIA chips have an advantage thanks to the FastWrites mechanism which transfers graphics data directly into the accelerator from the processor passing by a system memory. In case of the Strip there is no more such advantage because a data rate is twice lower. Performance of the vertex shader unitThis test demonstrates an ultimate performance of the vertex shader unit. A complicated shader calculates both specific transformations and geometrical functions. The test is carried out in the lowest resolution to minimize a shading effect. Z-buffer is off, and the HSR can't affect the results as well:
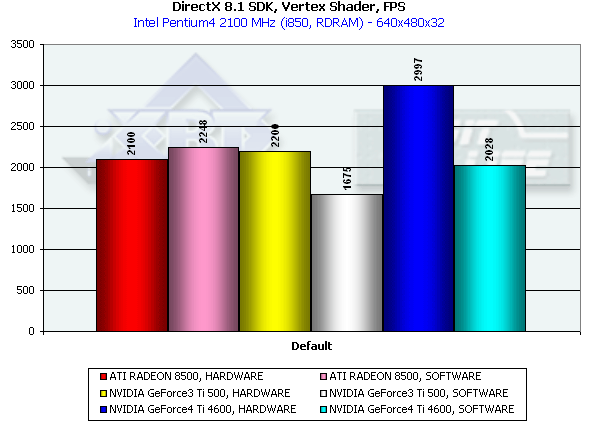 The dual T&L of the NV25 is beneficial again. Besides, one of the most powerful CPUs loses in a speed of graphics data processing. The NV25 has a more efficient delivery of geometry calculated on a program level as compared with the NV20 (the drivers are equal for both chips). The R200's speed of processing of vertex shaders has grown twice and it is now equal to the program emulation speed. This time we decided to check whether the R200 processes vertex shaders on a program level and lowered the clock frequency to 1 GHz. The results (HARDWARE 1860, SOFTWARE 1470) show that they are processed on a hardware level. Well, ATI was able to optimize the drivers successfully. Vertex matrix blendingThis feature is used for true animation and skinning of models. We tested blending using two matrices both in a tough hardware variant and using a vertex shader with the same function. Besides, we obtained the results of the T&L program emulation:
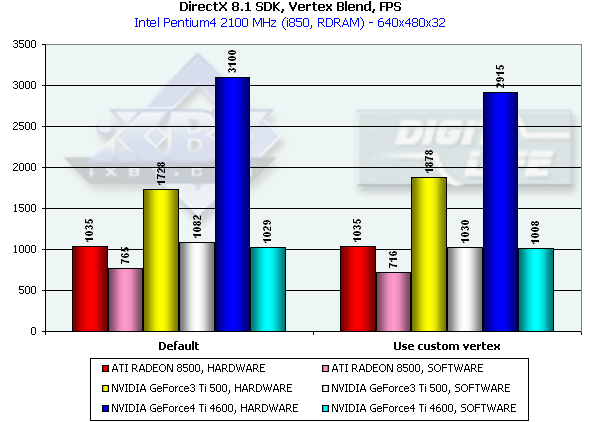 This time the program emulation loses to the hardware implementation being limited by the graphics data rate via the AGP. As I mentioned before the NVIDIA products has some advantage thanks to the FastWrites support. This time (vs. the last big test of the R200) in case of the hardware implementation the shaders go on a par with the hardware blending, and now it makes no sense to use the latter on modern chips. It is interesting that the tough hardware blending is a bit slower on the NV20 and a bit faster on the NV25 than the shader one, but the difference is insignificant, which is reasonable as neither NV20 nor NV25 have a fixed T&L. In fact, functions of this unit are implemented by a special shader microcode, and equality of the results shows that optimization of the driver-compiled shaders is optimal. EMBM reliefThis test measures a performance drop caused by Environment mapping and EMBM (Environment Bump). We tested in 1280*1024 as exactly in this mode difference between cards and texturing modes is the most vivid:
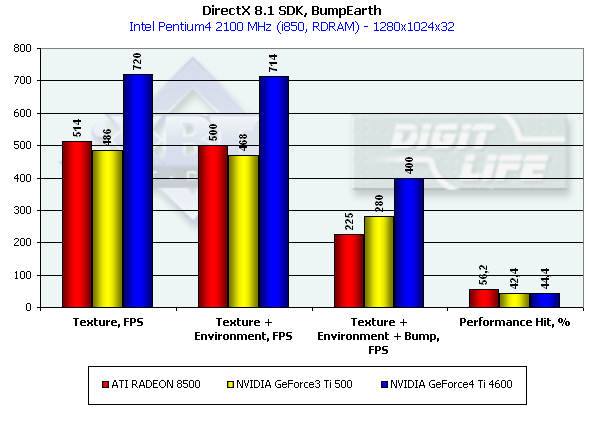 The Ti 4600 outscores all other cards in an effective fillrate in all three modes. The R200 suffers most from the EMBM. The NVIDIA chips shade much more efficiently especially if we take it per unit of clock frequency - 240 MHz of the NV20 will be, thus, equal to 275 MHz of the R200. Performance of pixel shaders Again we used MFCPixelShader and measured performance of the cards in the high resolution using 5 shaders different in complexity for bilinear filtered textures:
The Ti 4600 is again riding high, and the dependence on the shader complexity and on the number of textures is very similar to the previous chip (NV20). The R200 looks weak, especially when fulfilling complex tasks. Reuse of texture units is dearer for it than for the NVIDIA products. Well, in the DX 8.1 SDK tests the NVIDIA GeForce4 Ti 4600 is an undoubted leader. However, remember that only real applications will allow us estimate an overall balance of this chip. Stay tuned! 3D graphics, VillageMark (HSR efficiency)To estimate realization of the HSR we used a test with a high OverDraw level - VillageMark v.1.17. Here are the results of both cards with enabled and disabled HSR:
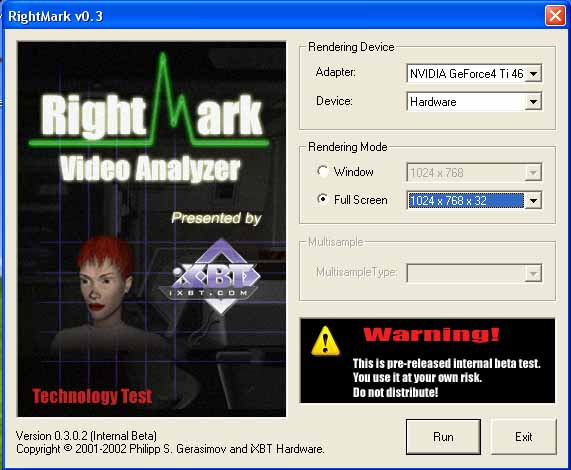
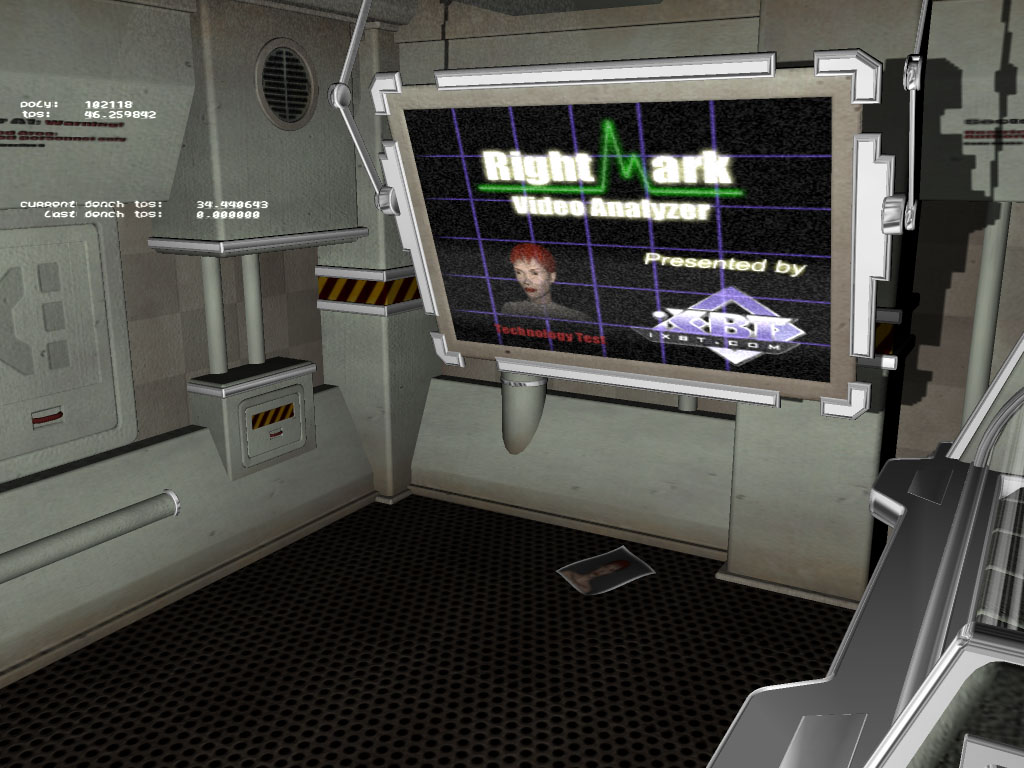
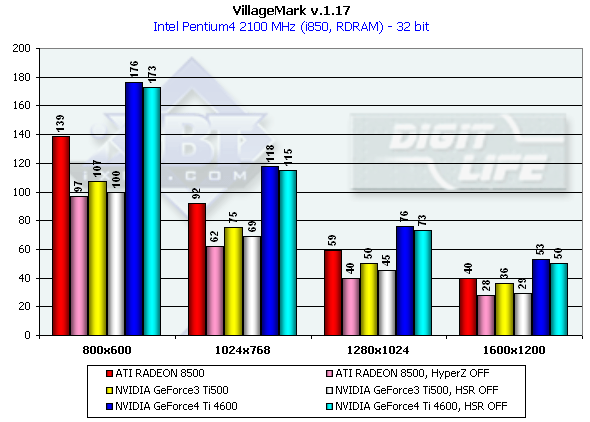 Apart from obvious advantage of the NV25 in 1280x1024, the performance drop with the HSR disabled is quite small both for NV25 and NV20. But it doesn't mean that the HSR is less efficient. If for the R200 card we disable the HyperZ completely (including HSR, Z compression, fast Z-clear), for the NVIDIA cards we could disable only the Z compression, while the HSR (Z-Cull) is disabled in the 27.XX at default and can be activated with the help of keys in the register. On the whole, the NV25 performs better in the scenes with a high overdraw parameter. It should be noted that the scene in this test is drawn not from the depth layer by layer but 'as is', that is why HSR of non-tile chips which performs best in this way of scene drawing doesn't have a great effect in comparison with tile architectures which sort a scene on a hardware level. As the most of real applications display scenes without sorting polygons we consider this test quite correct. 3D graphics, preliminary test based on the iXBT/Digit-Life RightMark Video AnalyserAt the moment we are developing a 3DMark-like packet the tests of which will be freely available. We have created a little preliminary test based on one scene and an engine which will be a base of this packet. The test will have complicated geometry (over 150,000 polygons in a frame) and wide utilization of DirectX 8.1 features. Lighting is based on vertex shaders, shading - on pixel ones, EM and EMBM are used widely, i.e. up to 4 textures are put over one pixel. Besides, the Shadow Buffer technology is used to calculate shadows of objects in a real-time mode. The test doesn't depend much on a processor (later we will return to strong dependence on a processor in the 3D Mark 2001 in all High Detail scenes). Here are some screenshots:
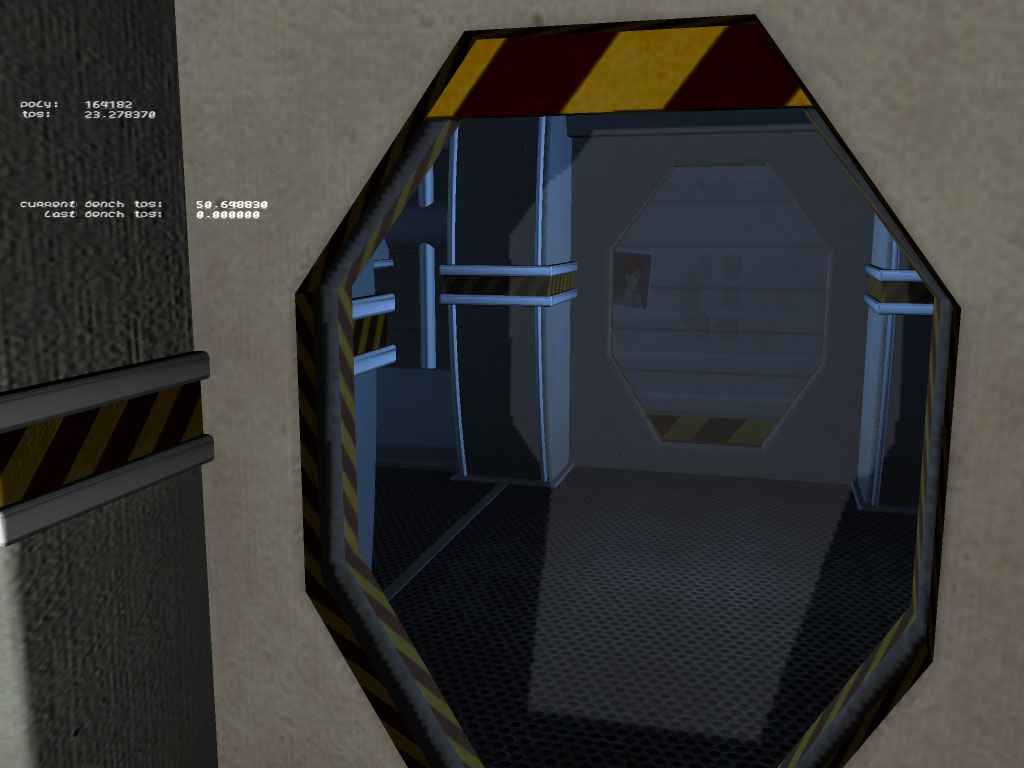
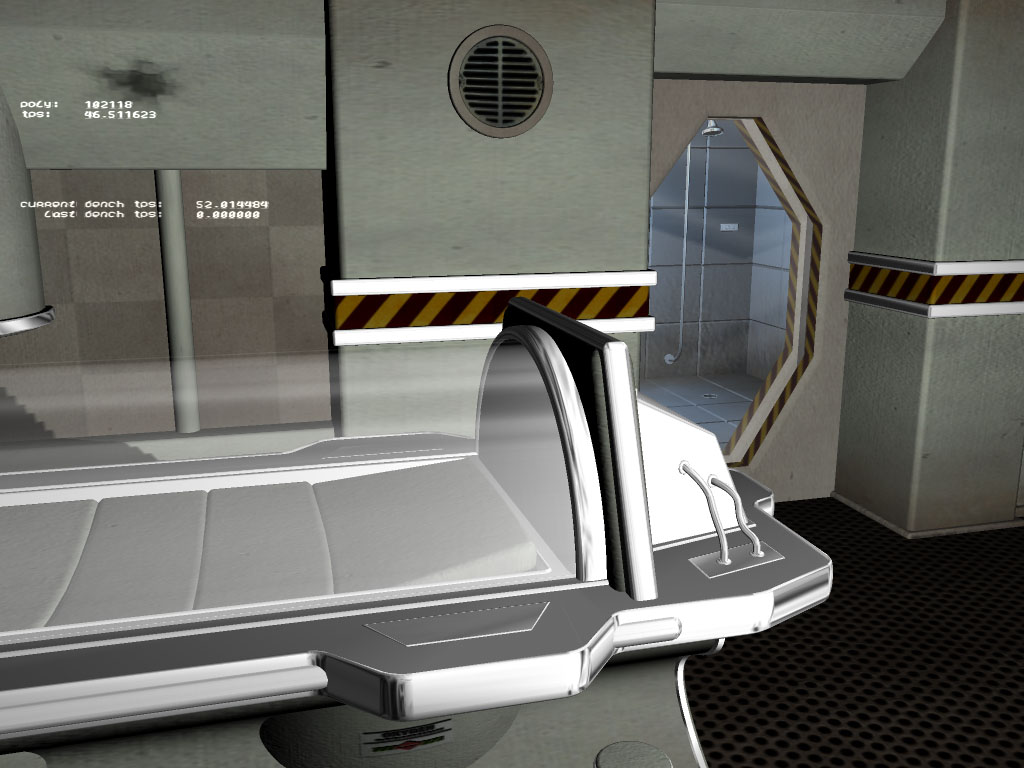
 Test results:
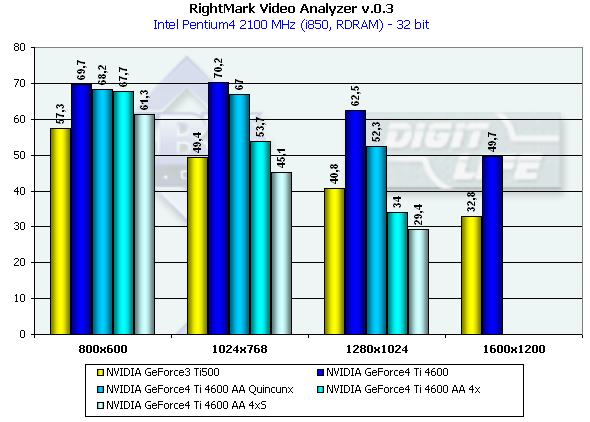 The test doesn't depend much on resolution because of very complicated scenes and a big load on the geometrical part of the accelerator. But when AA is enabled which influences positively visual quality of the scenes with a great number of small polygons resolution becomes important. I think that resolution won't be a problem soon and all applications will be focused on flexibility of more and more complicating geometry. It is interesting that again in 1280*1024 the gap between the NV25 and the NV20 is the largest. The increased memory bandwidth and its doubled size helped the NV25 much in this mode. Note that this mode is typical of 17" and 18" monitors. [ Part IV ]
Write a comment below. No registration needed!
|
Platform · Video · Multimedia · Mobile · Other || About us & Privacy policy · Twitter · Facebook Copyright © Byrds Research & Publishing, Ltd., 1997–2011. All rights reserved. |


