|
||
|
||
| ||
|
||
|
||
| ||
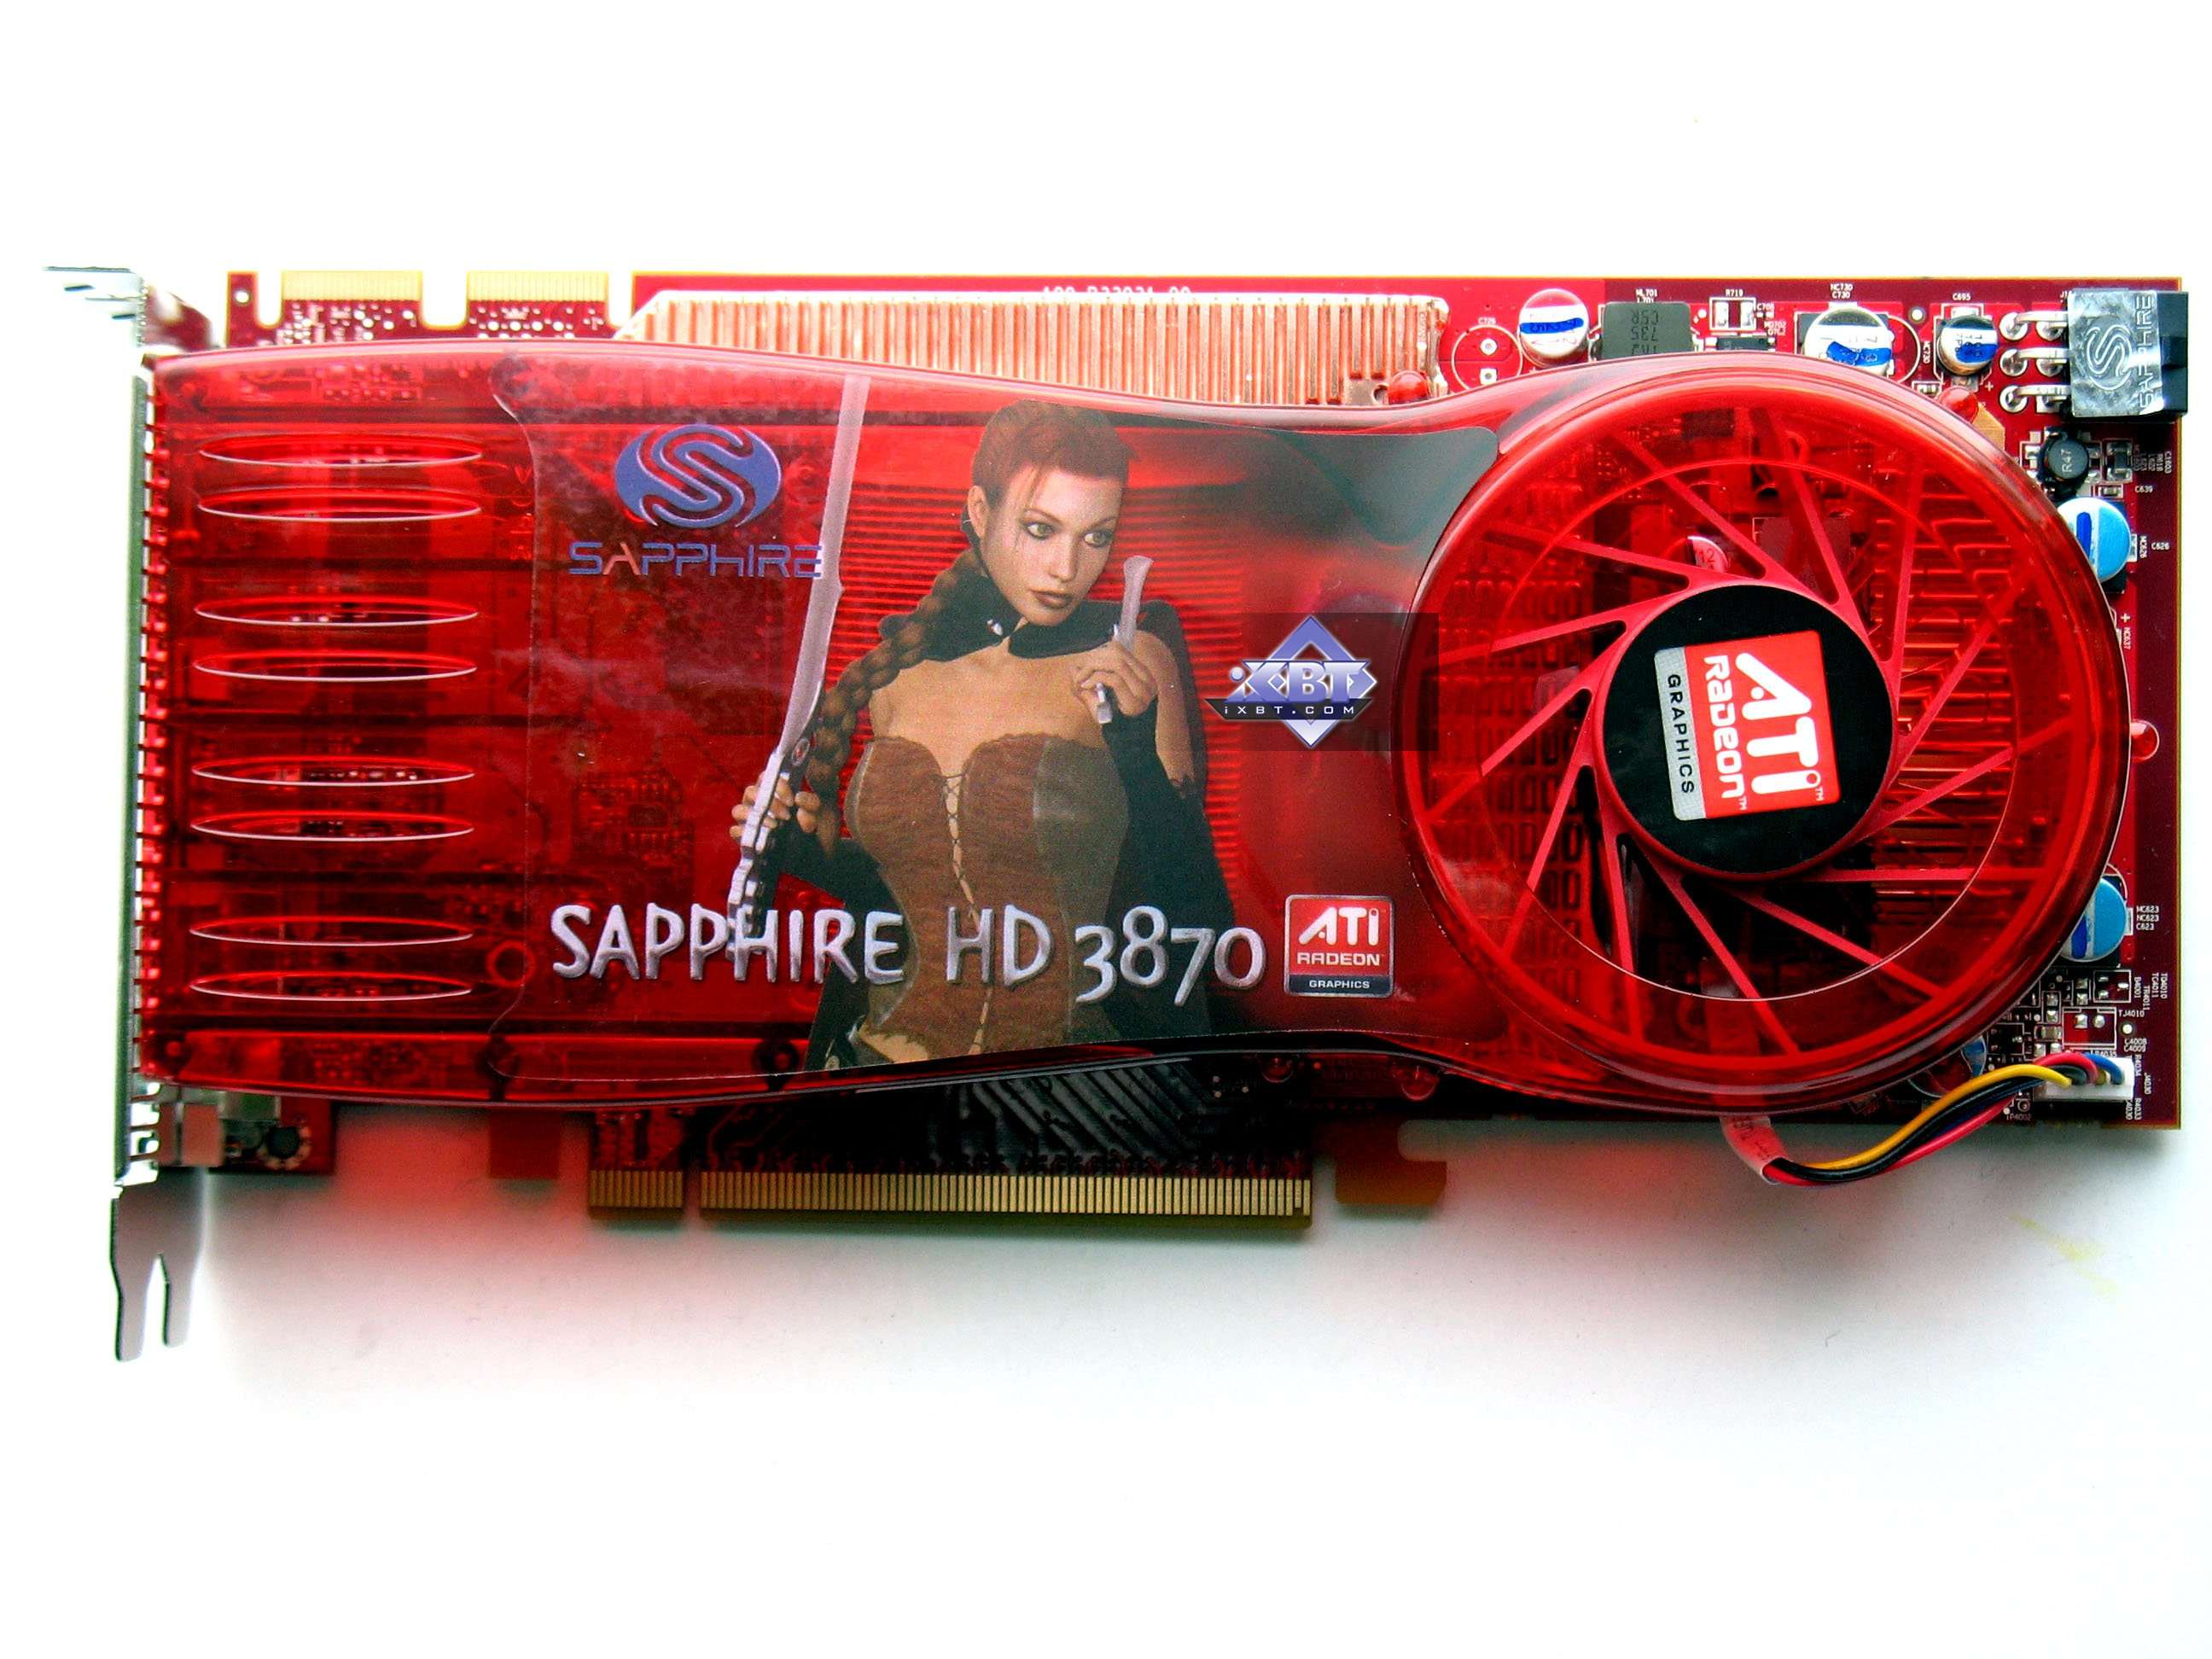
320 Shader Processors and 256-bit Memory BusPart 2: Features, Synthetic Tests All the architectural details are reviewed in the first part. Today we're going to test the reference RADEON 3850 and 3870 cards along with the similar products from HIS, TUL and Sapphire. Graphics Cards
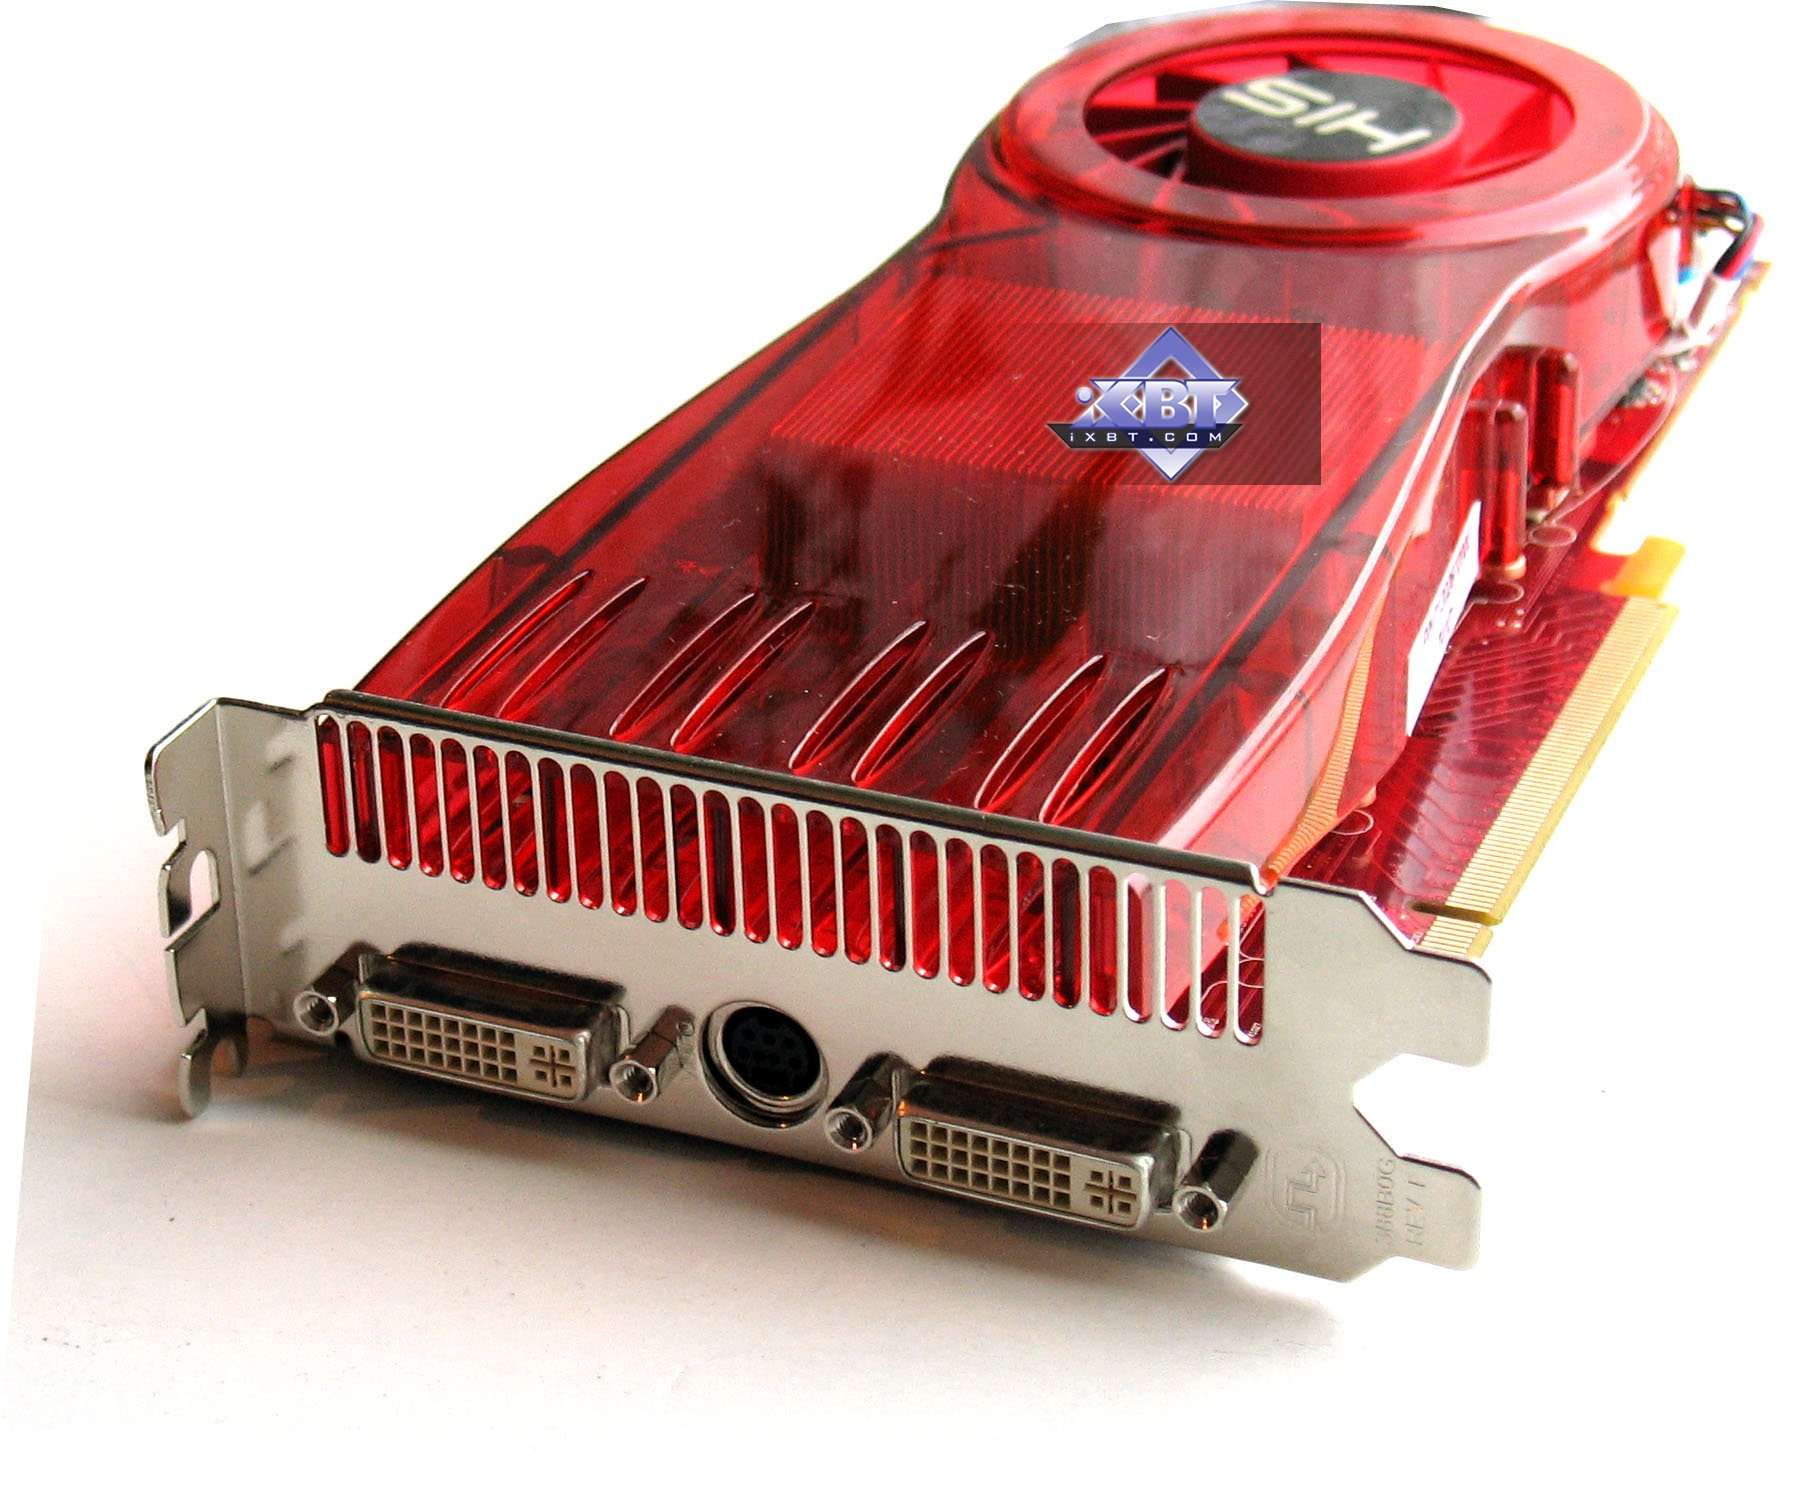
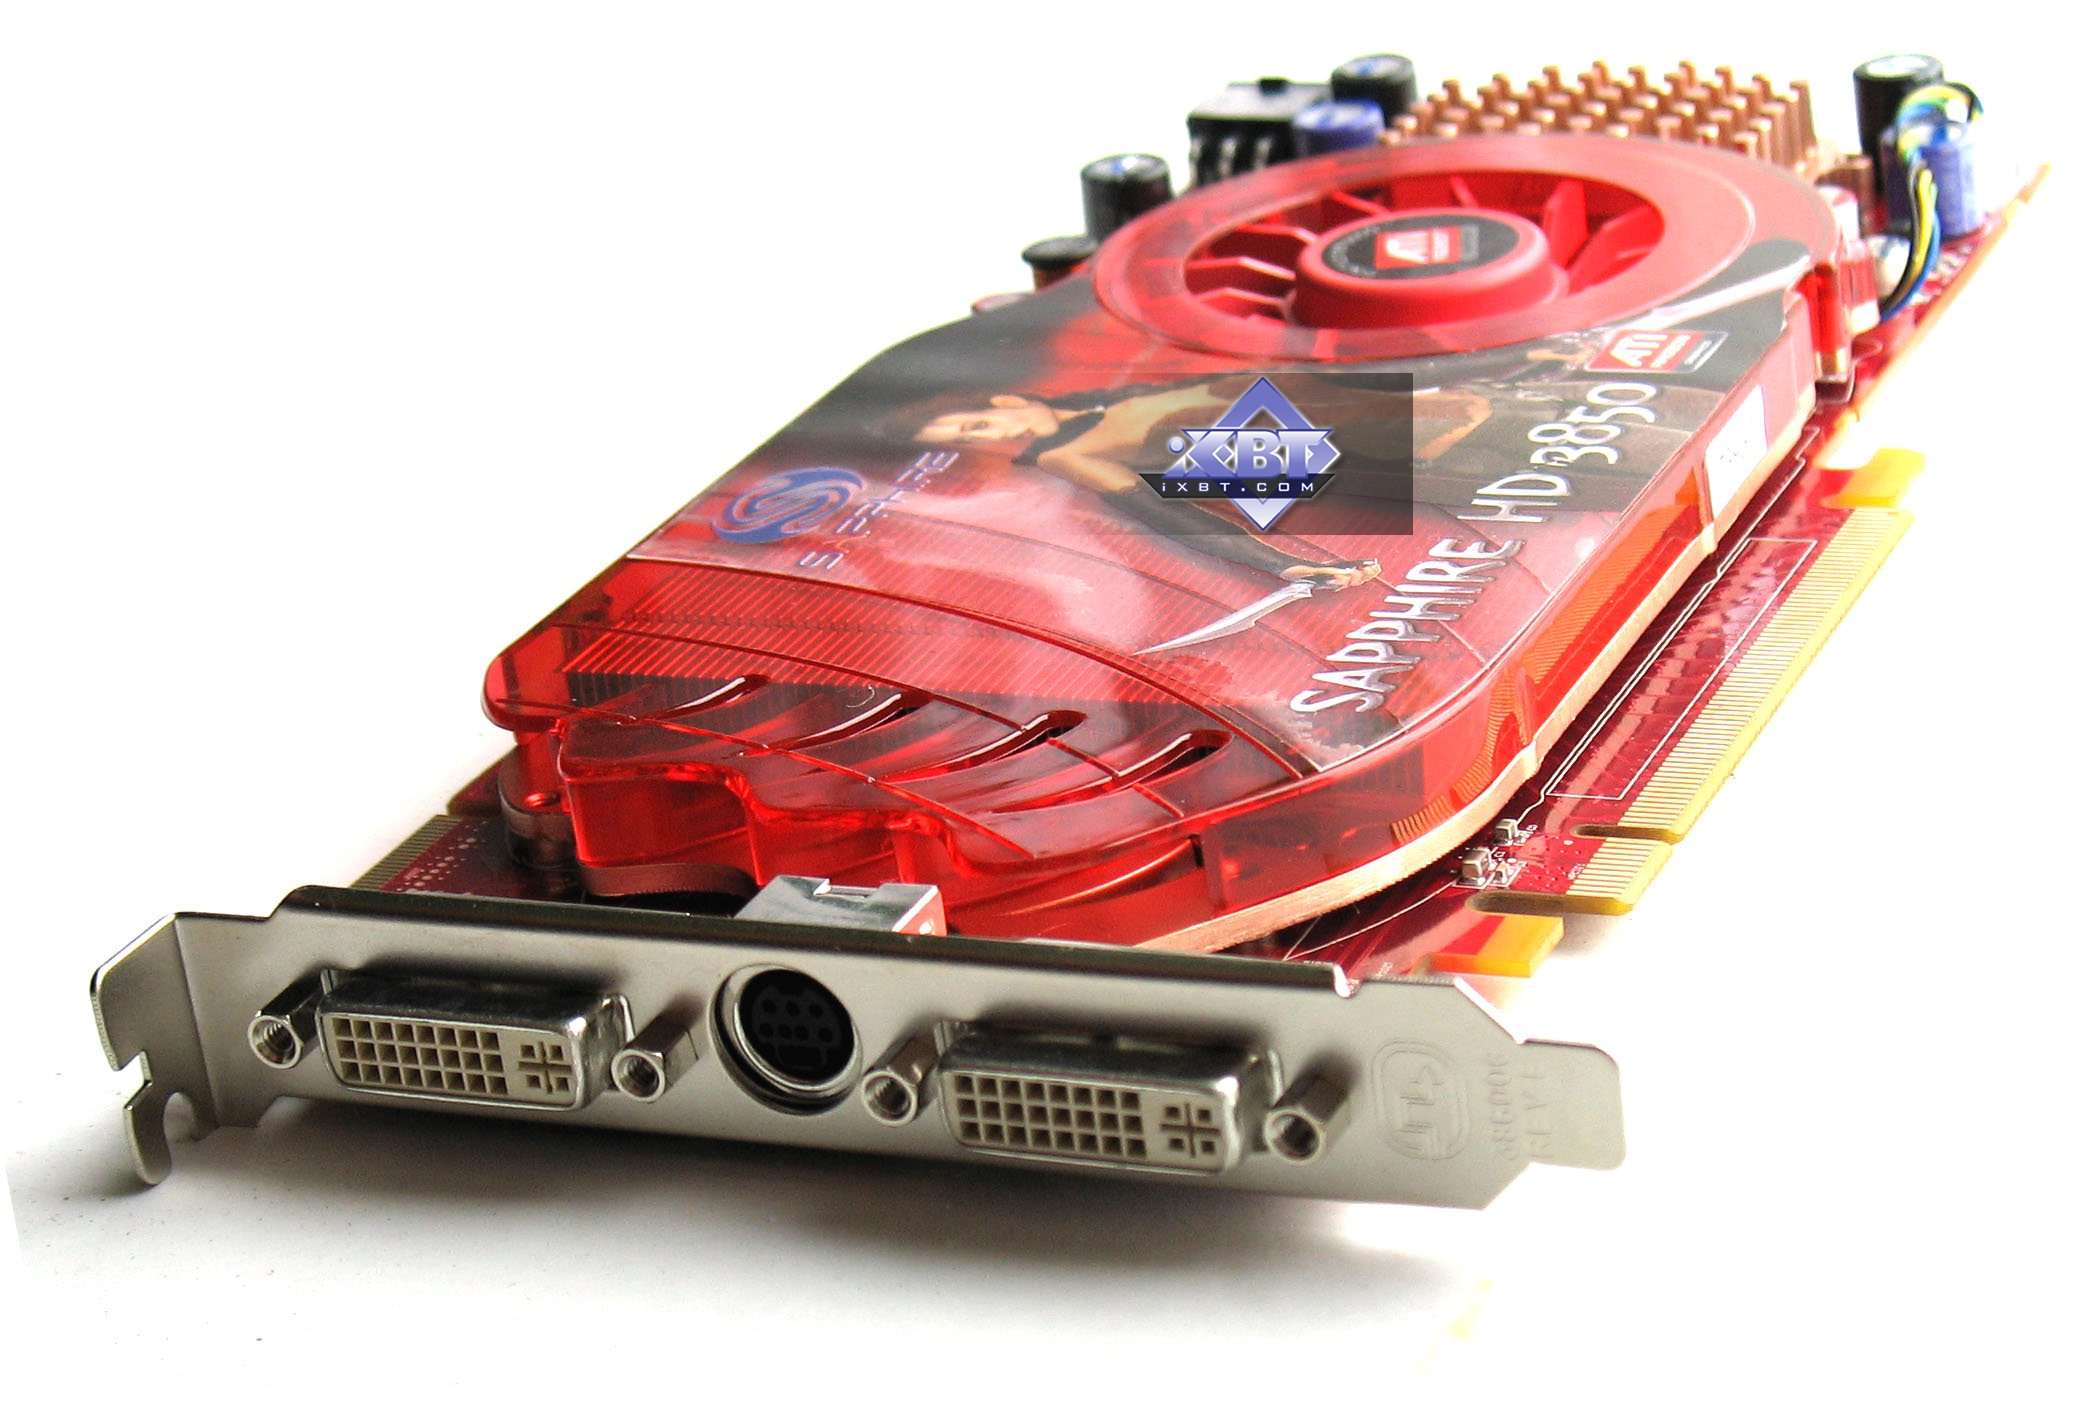
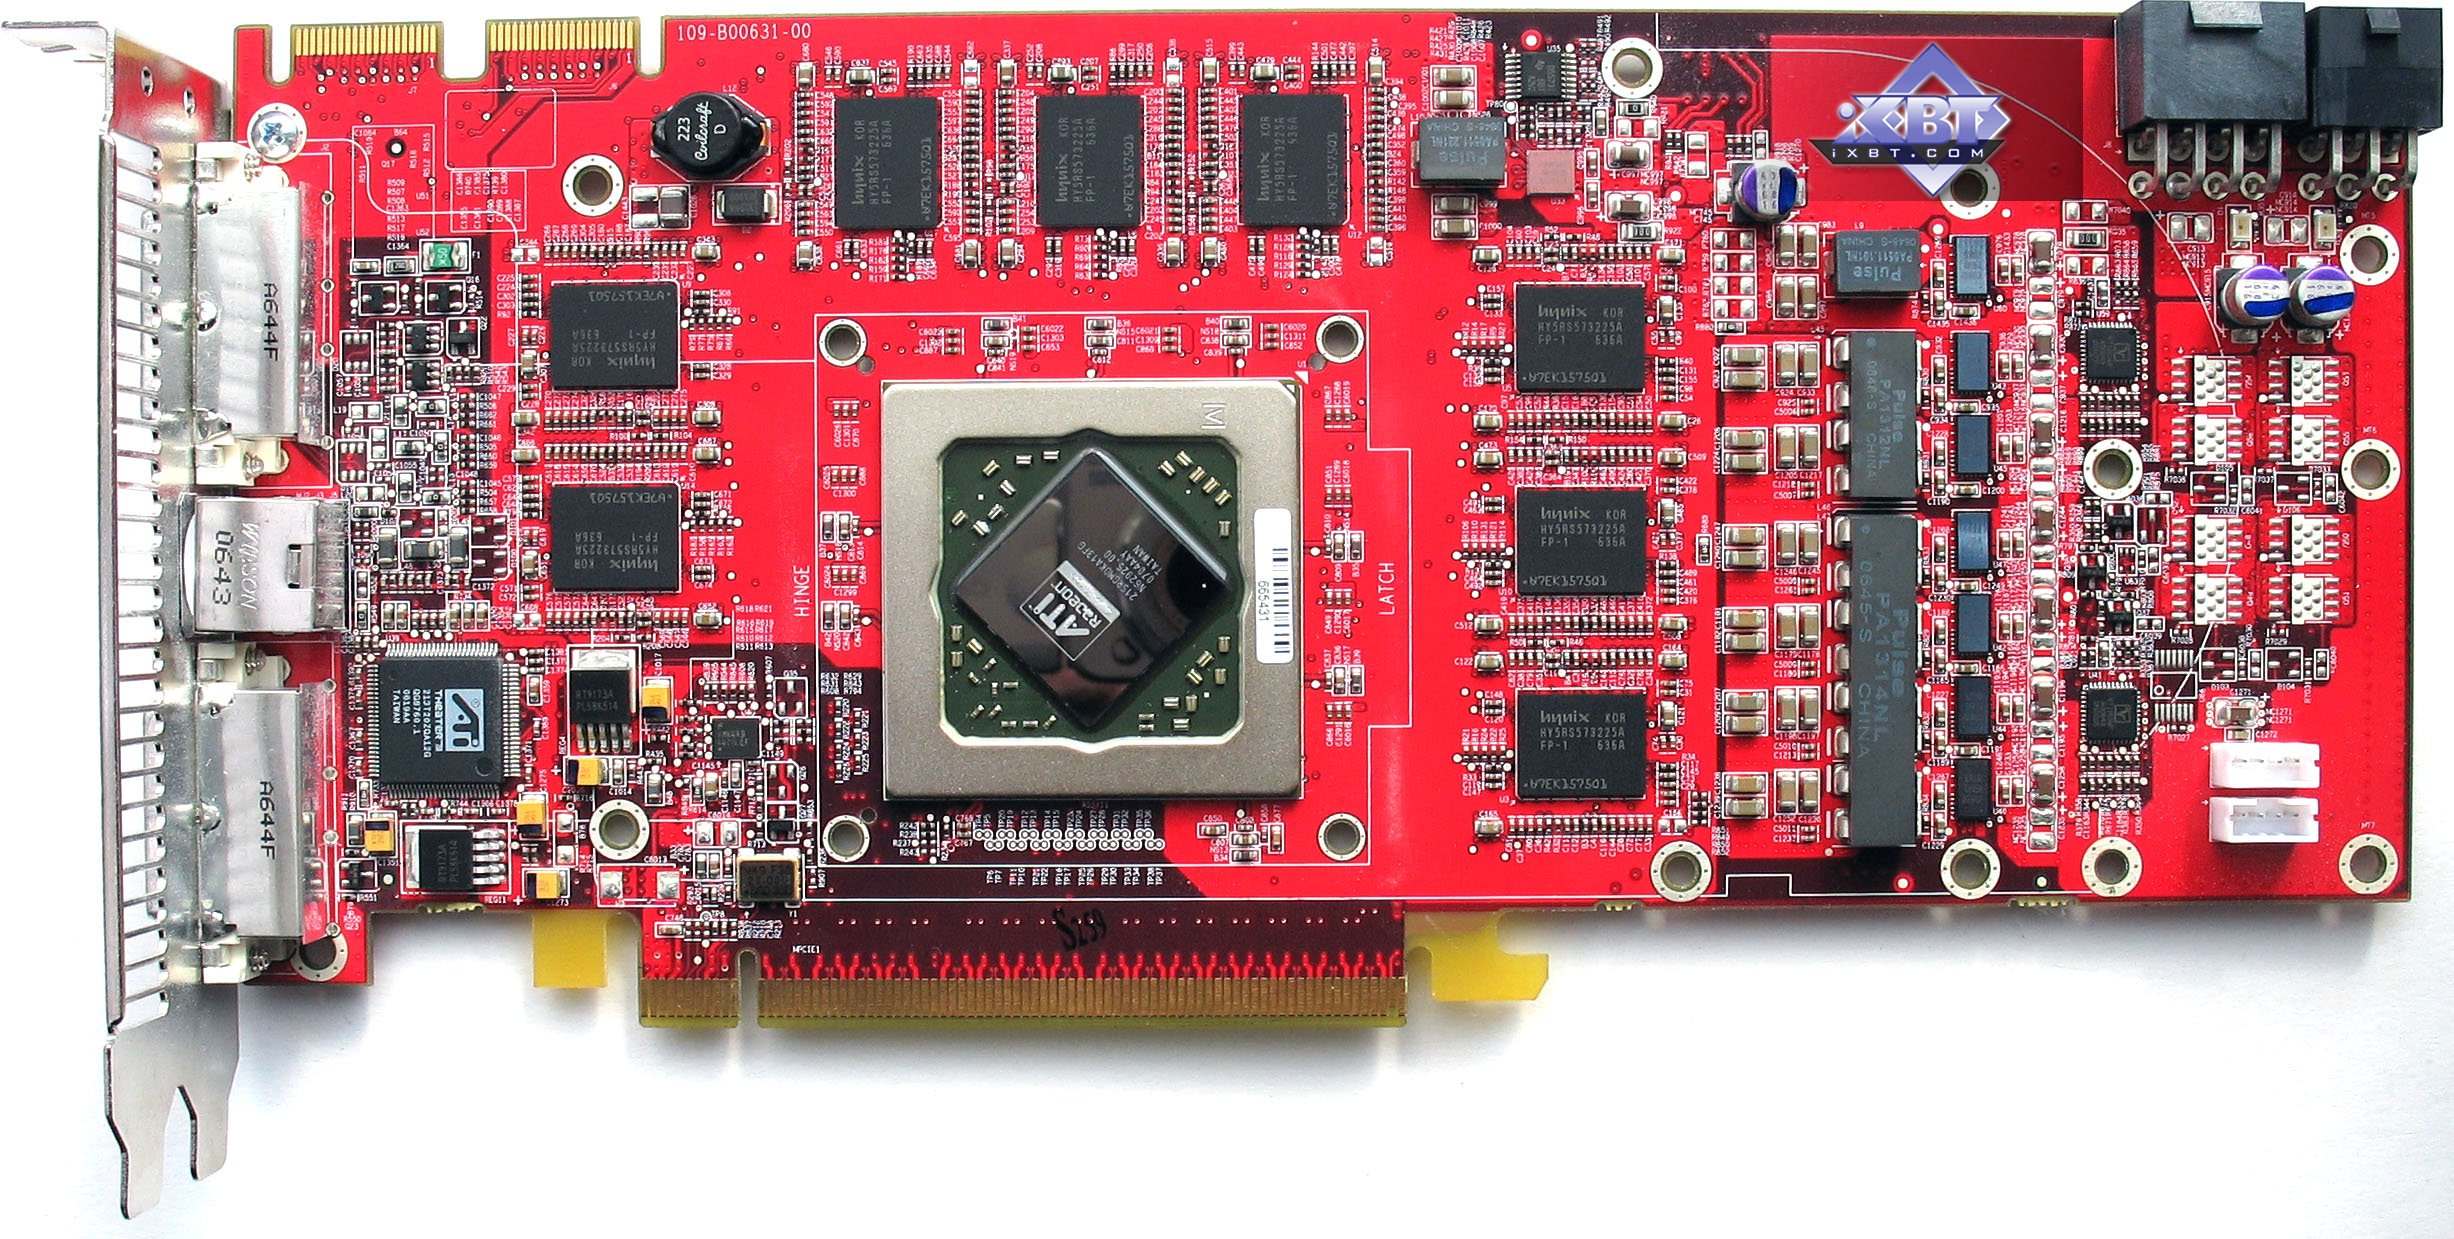
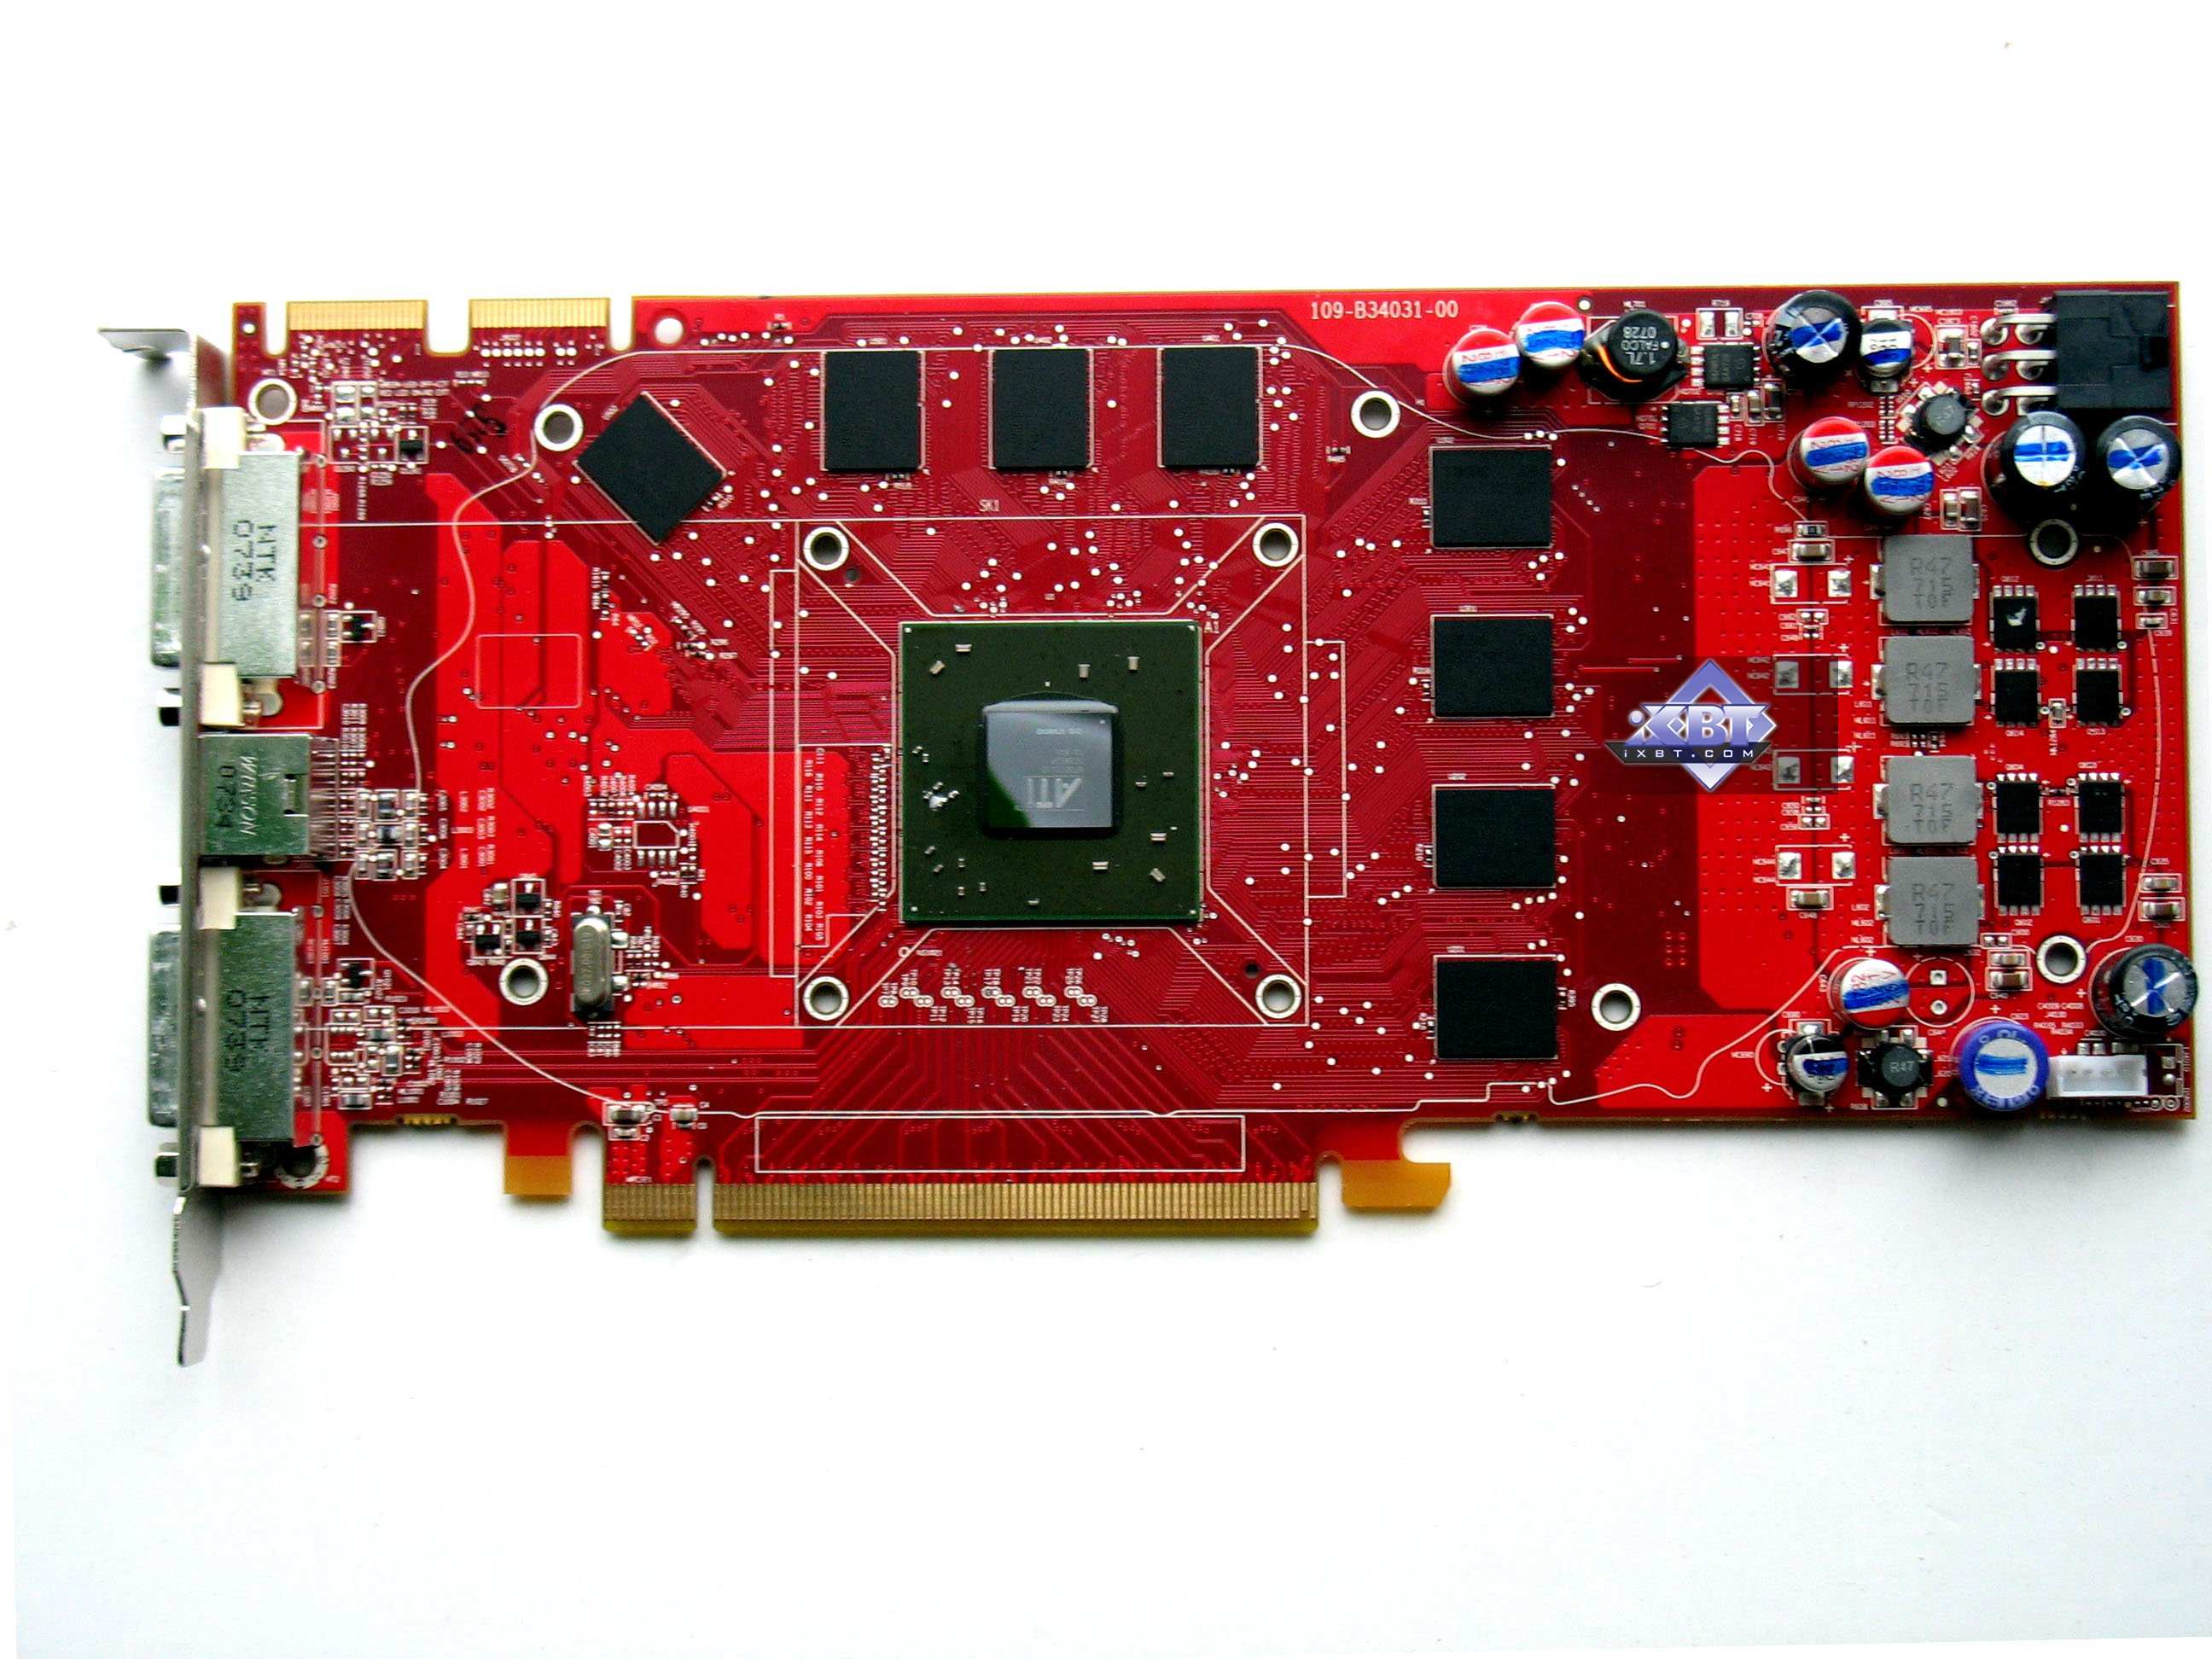
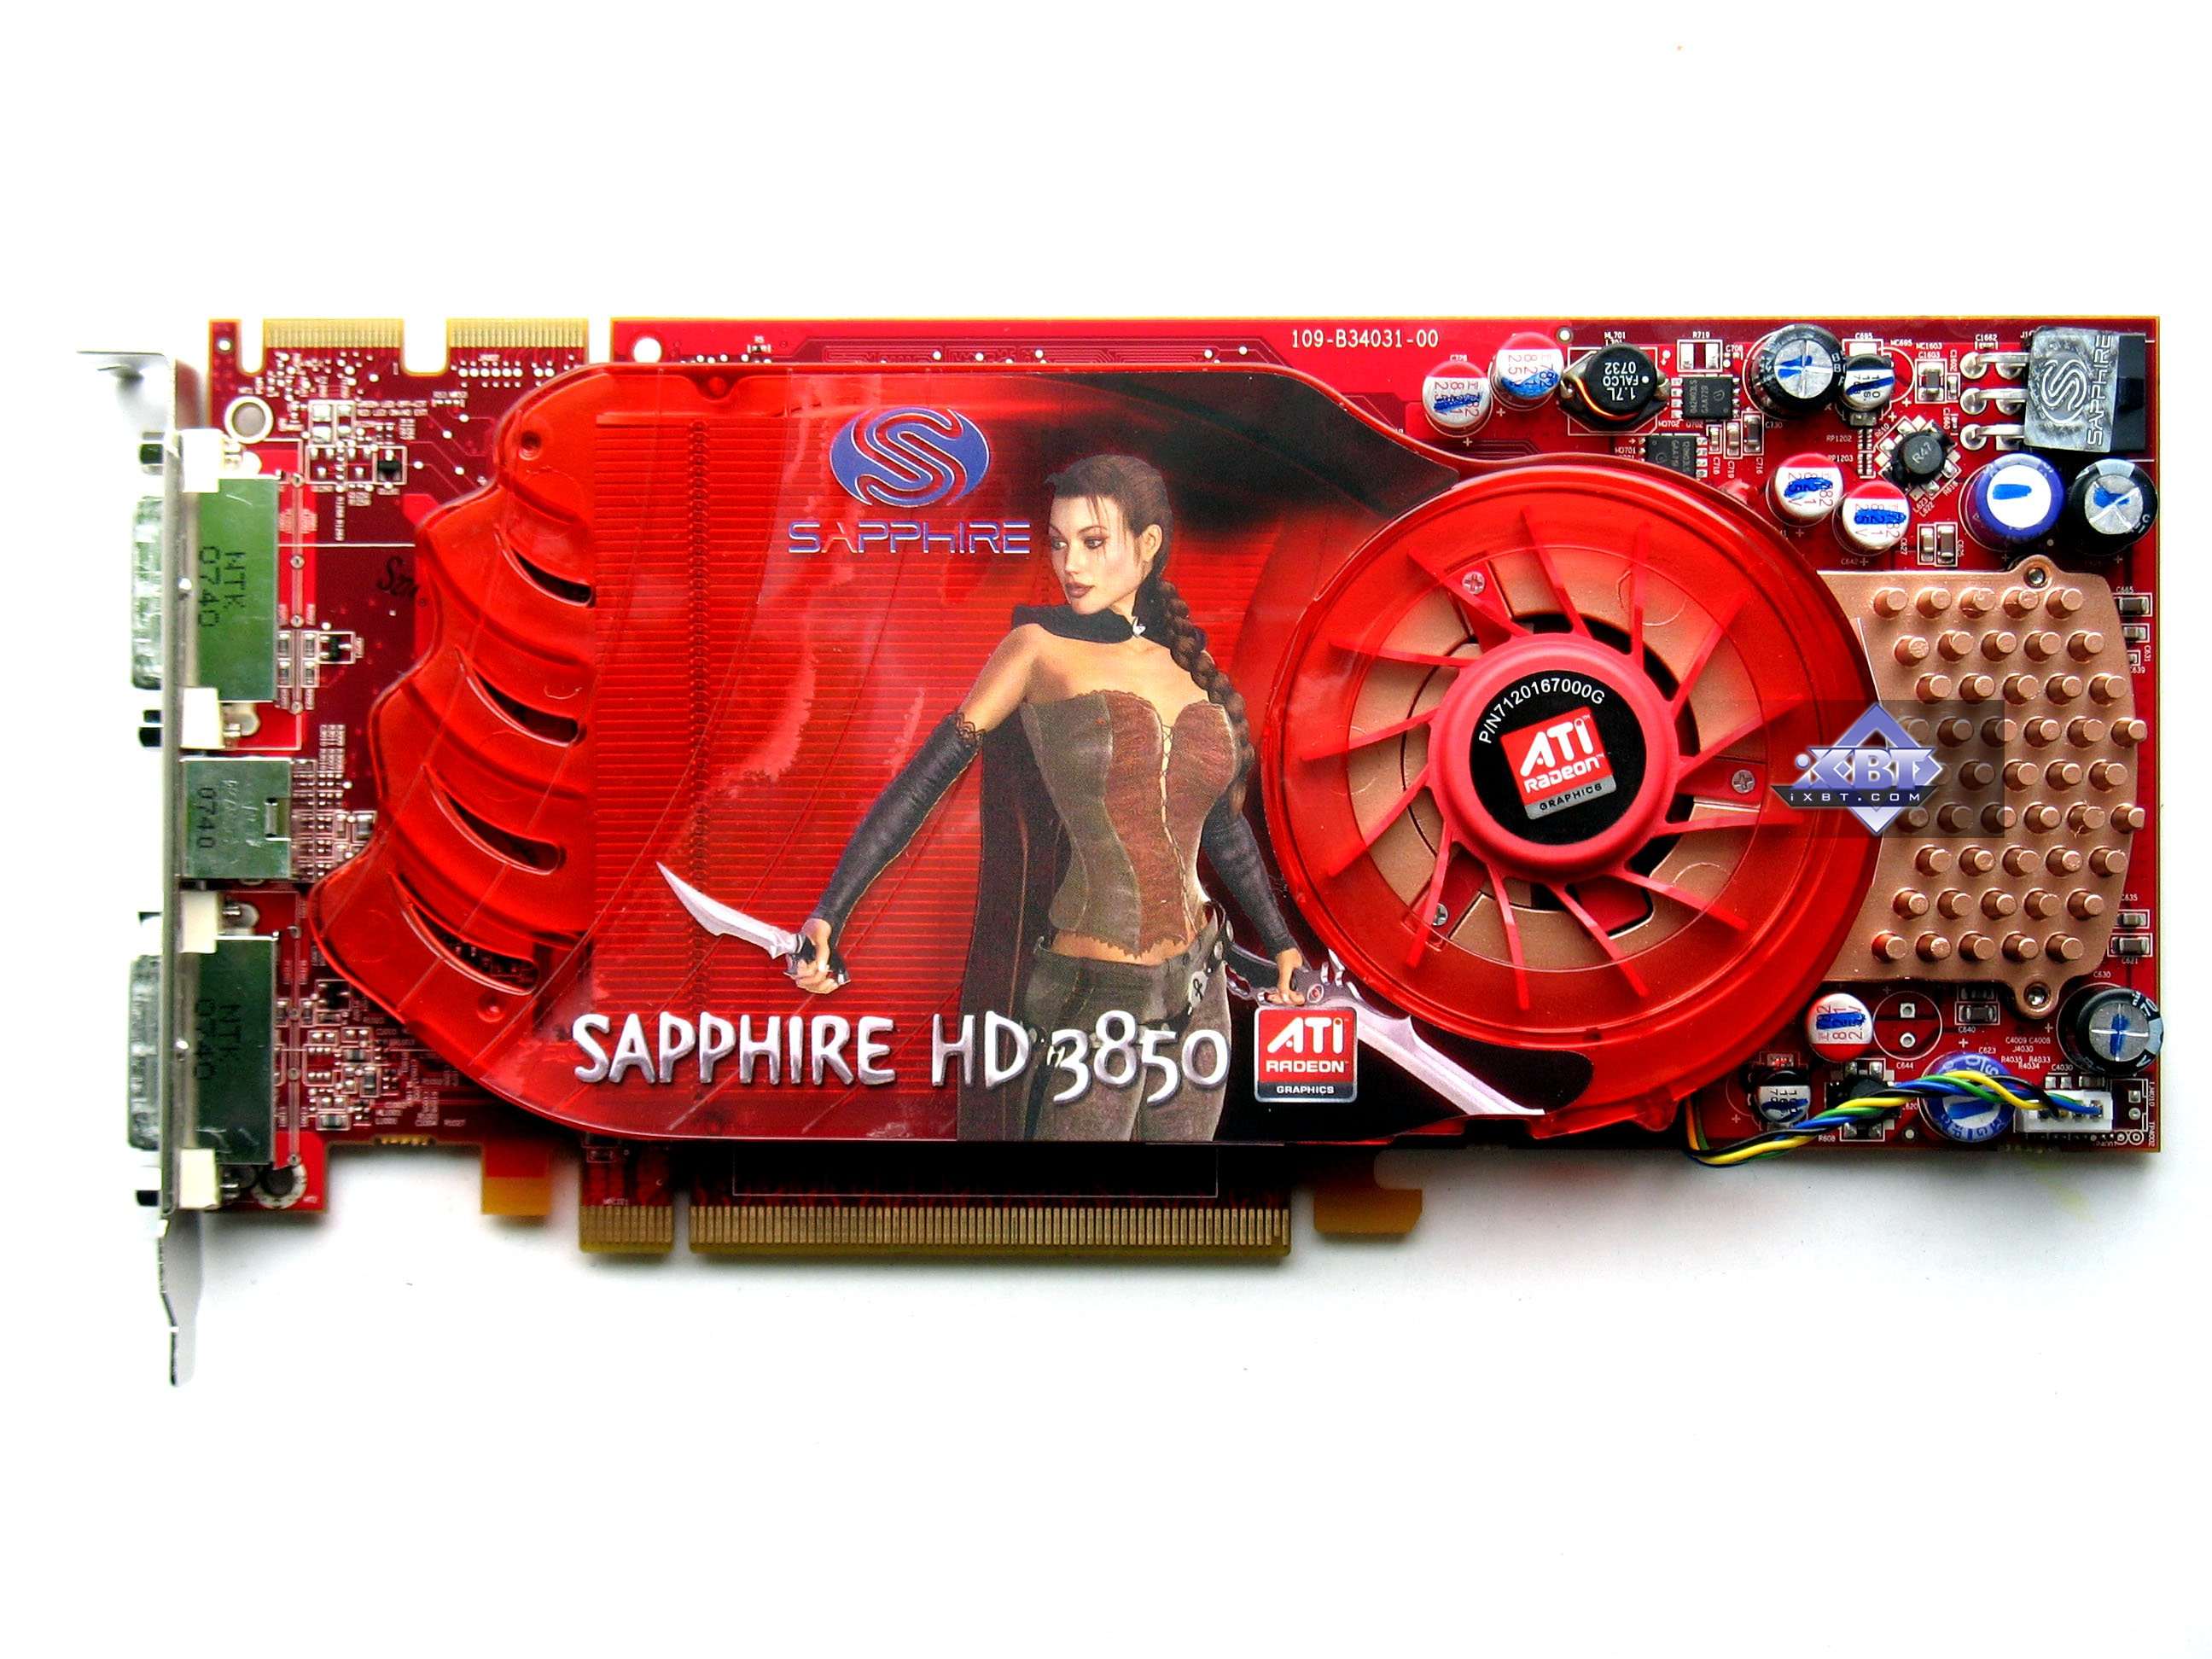
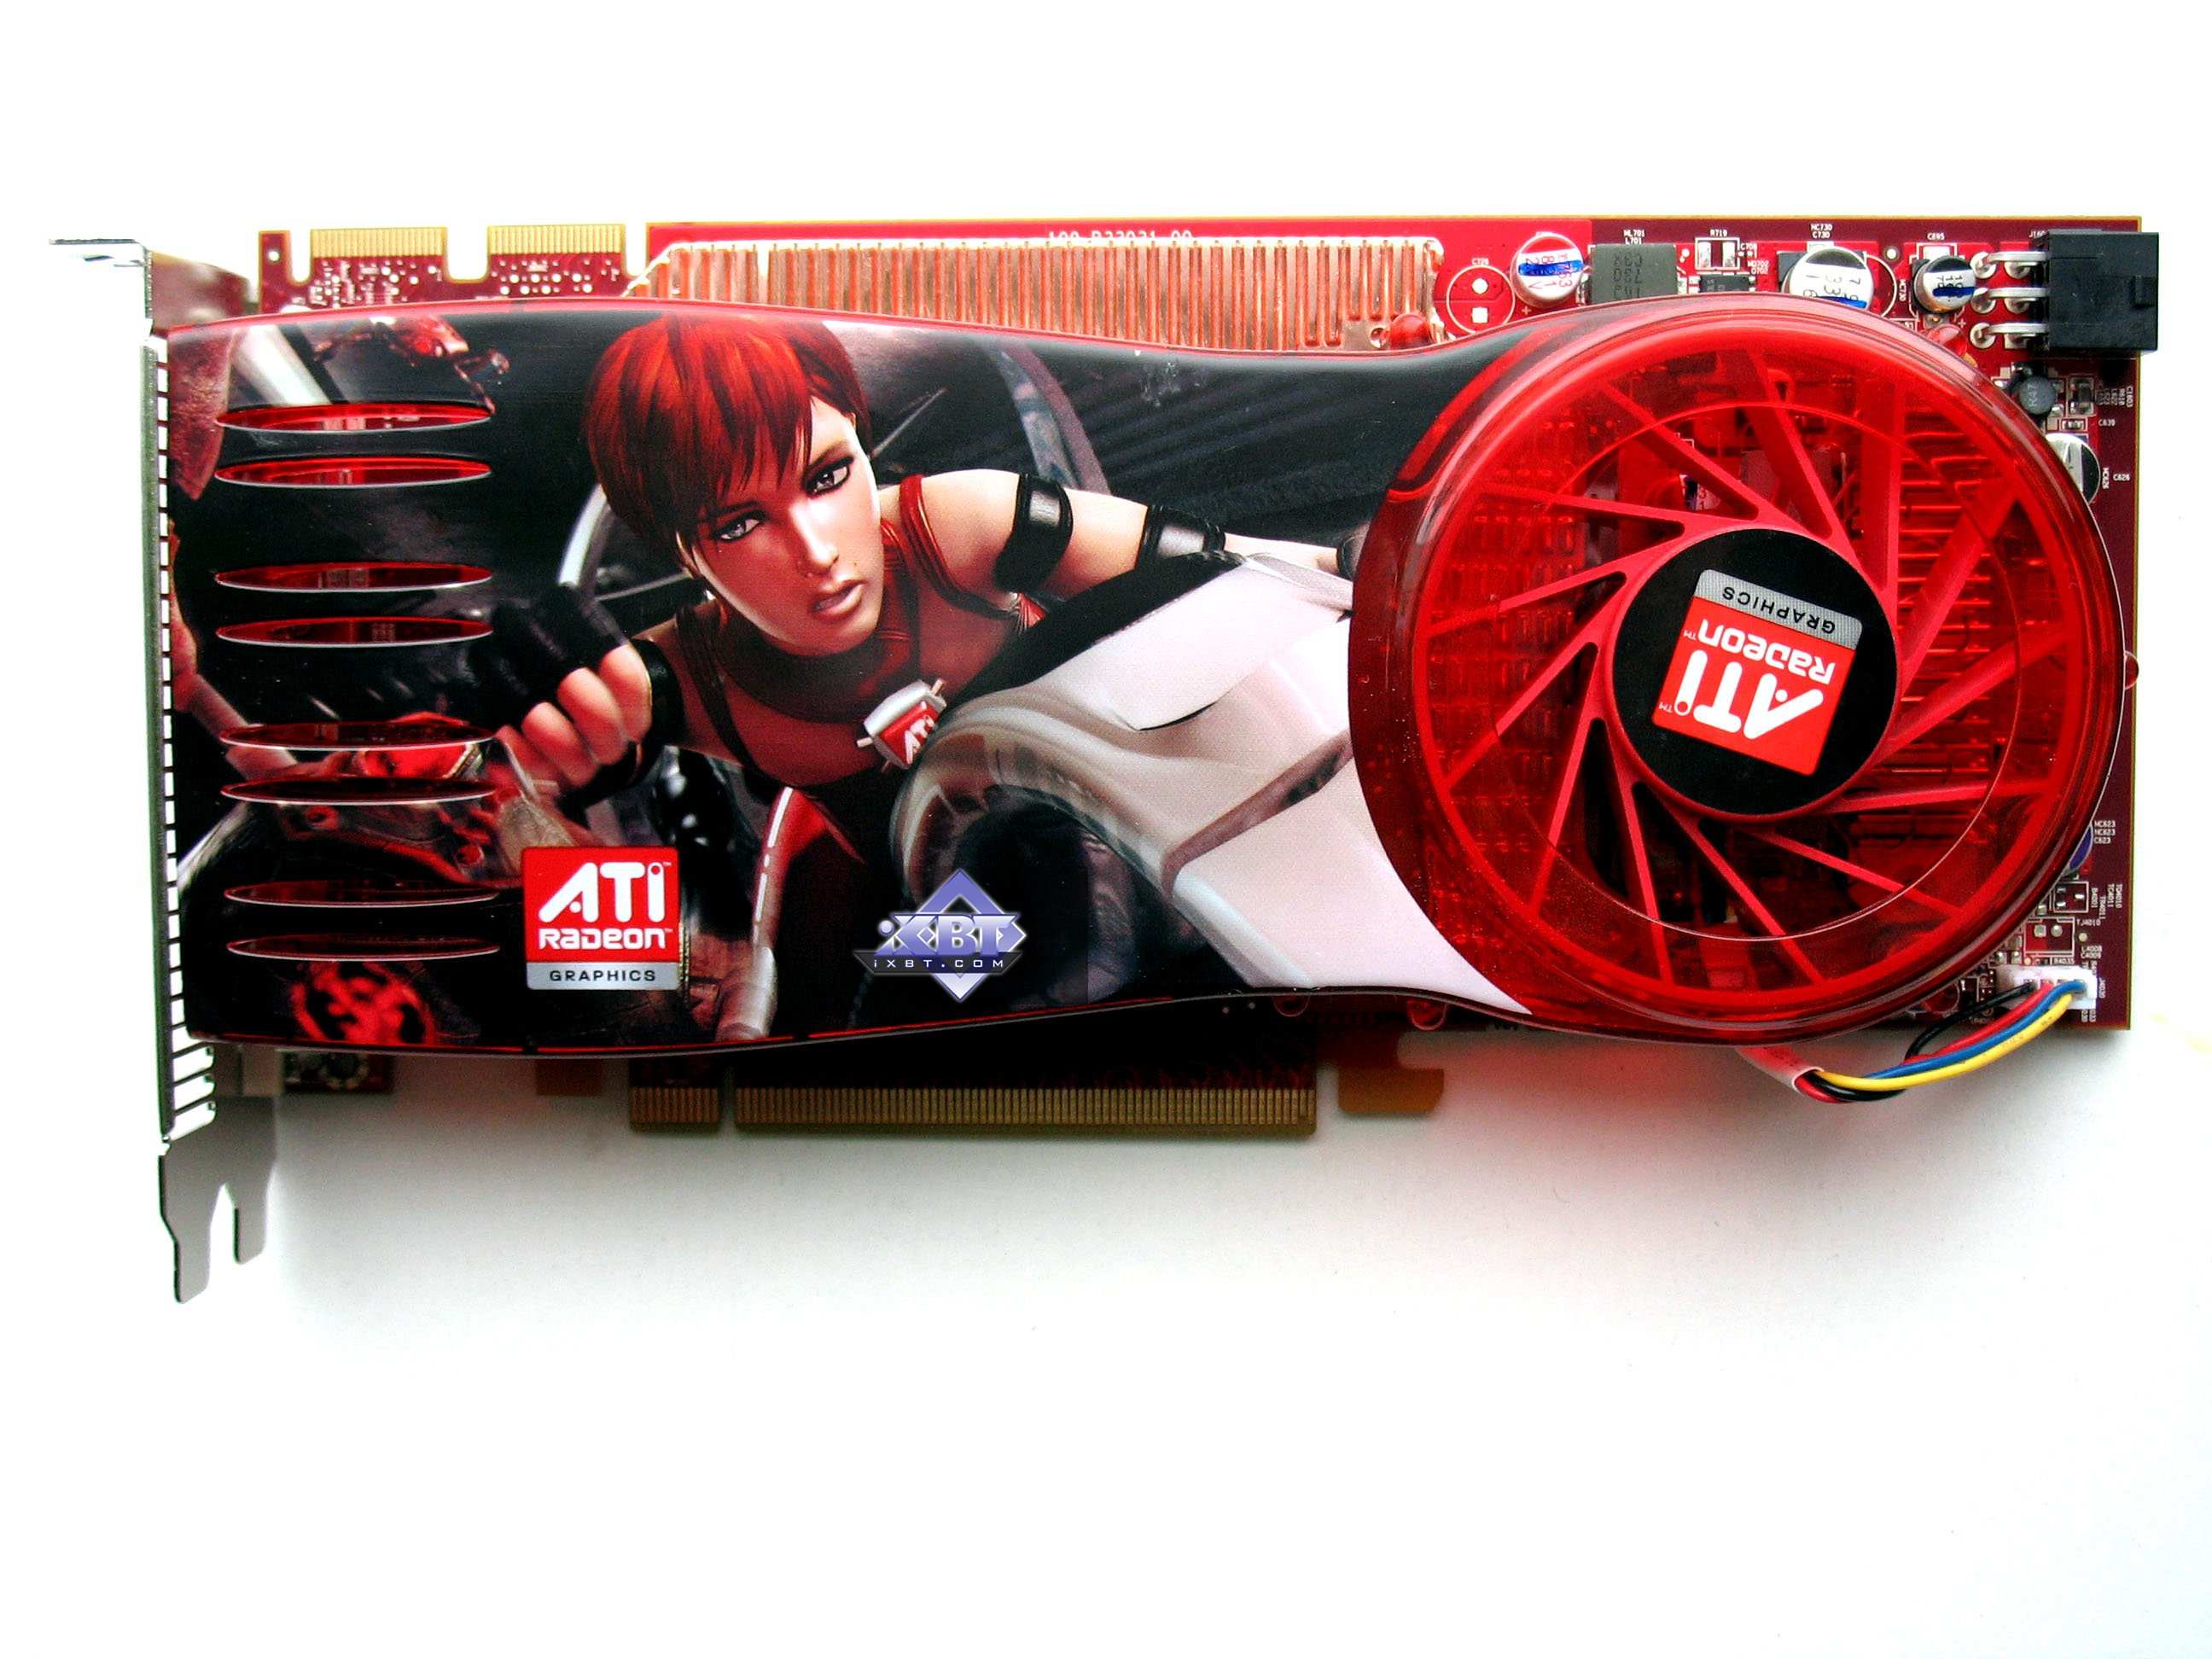
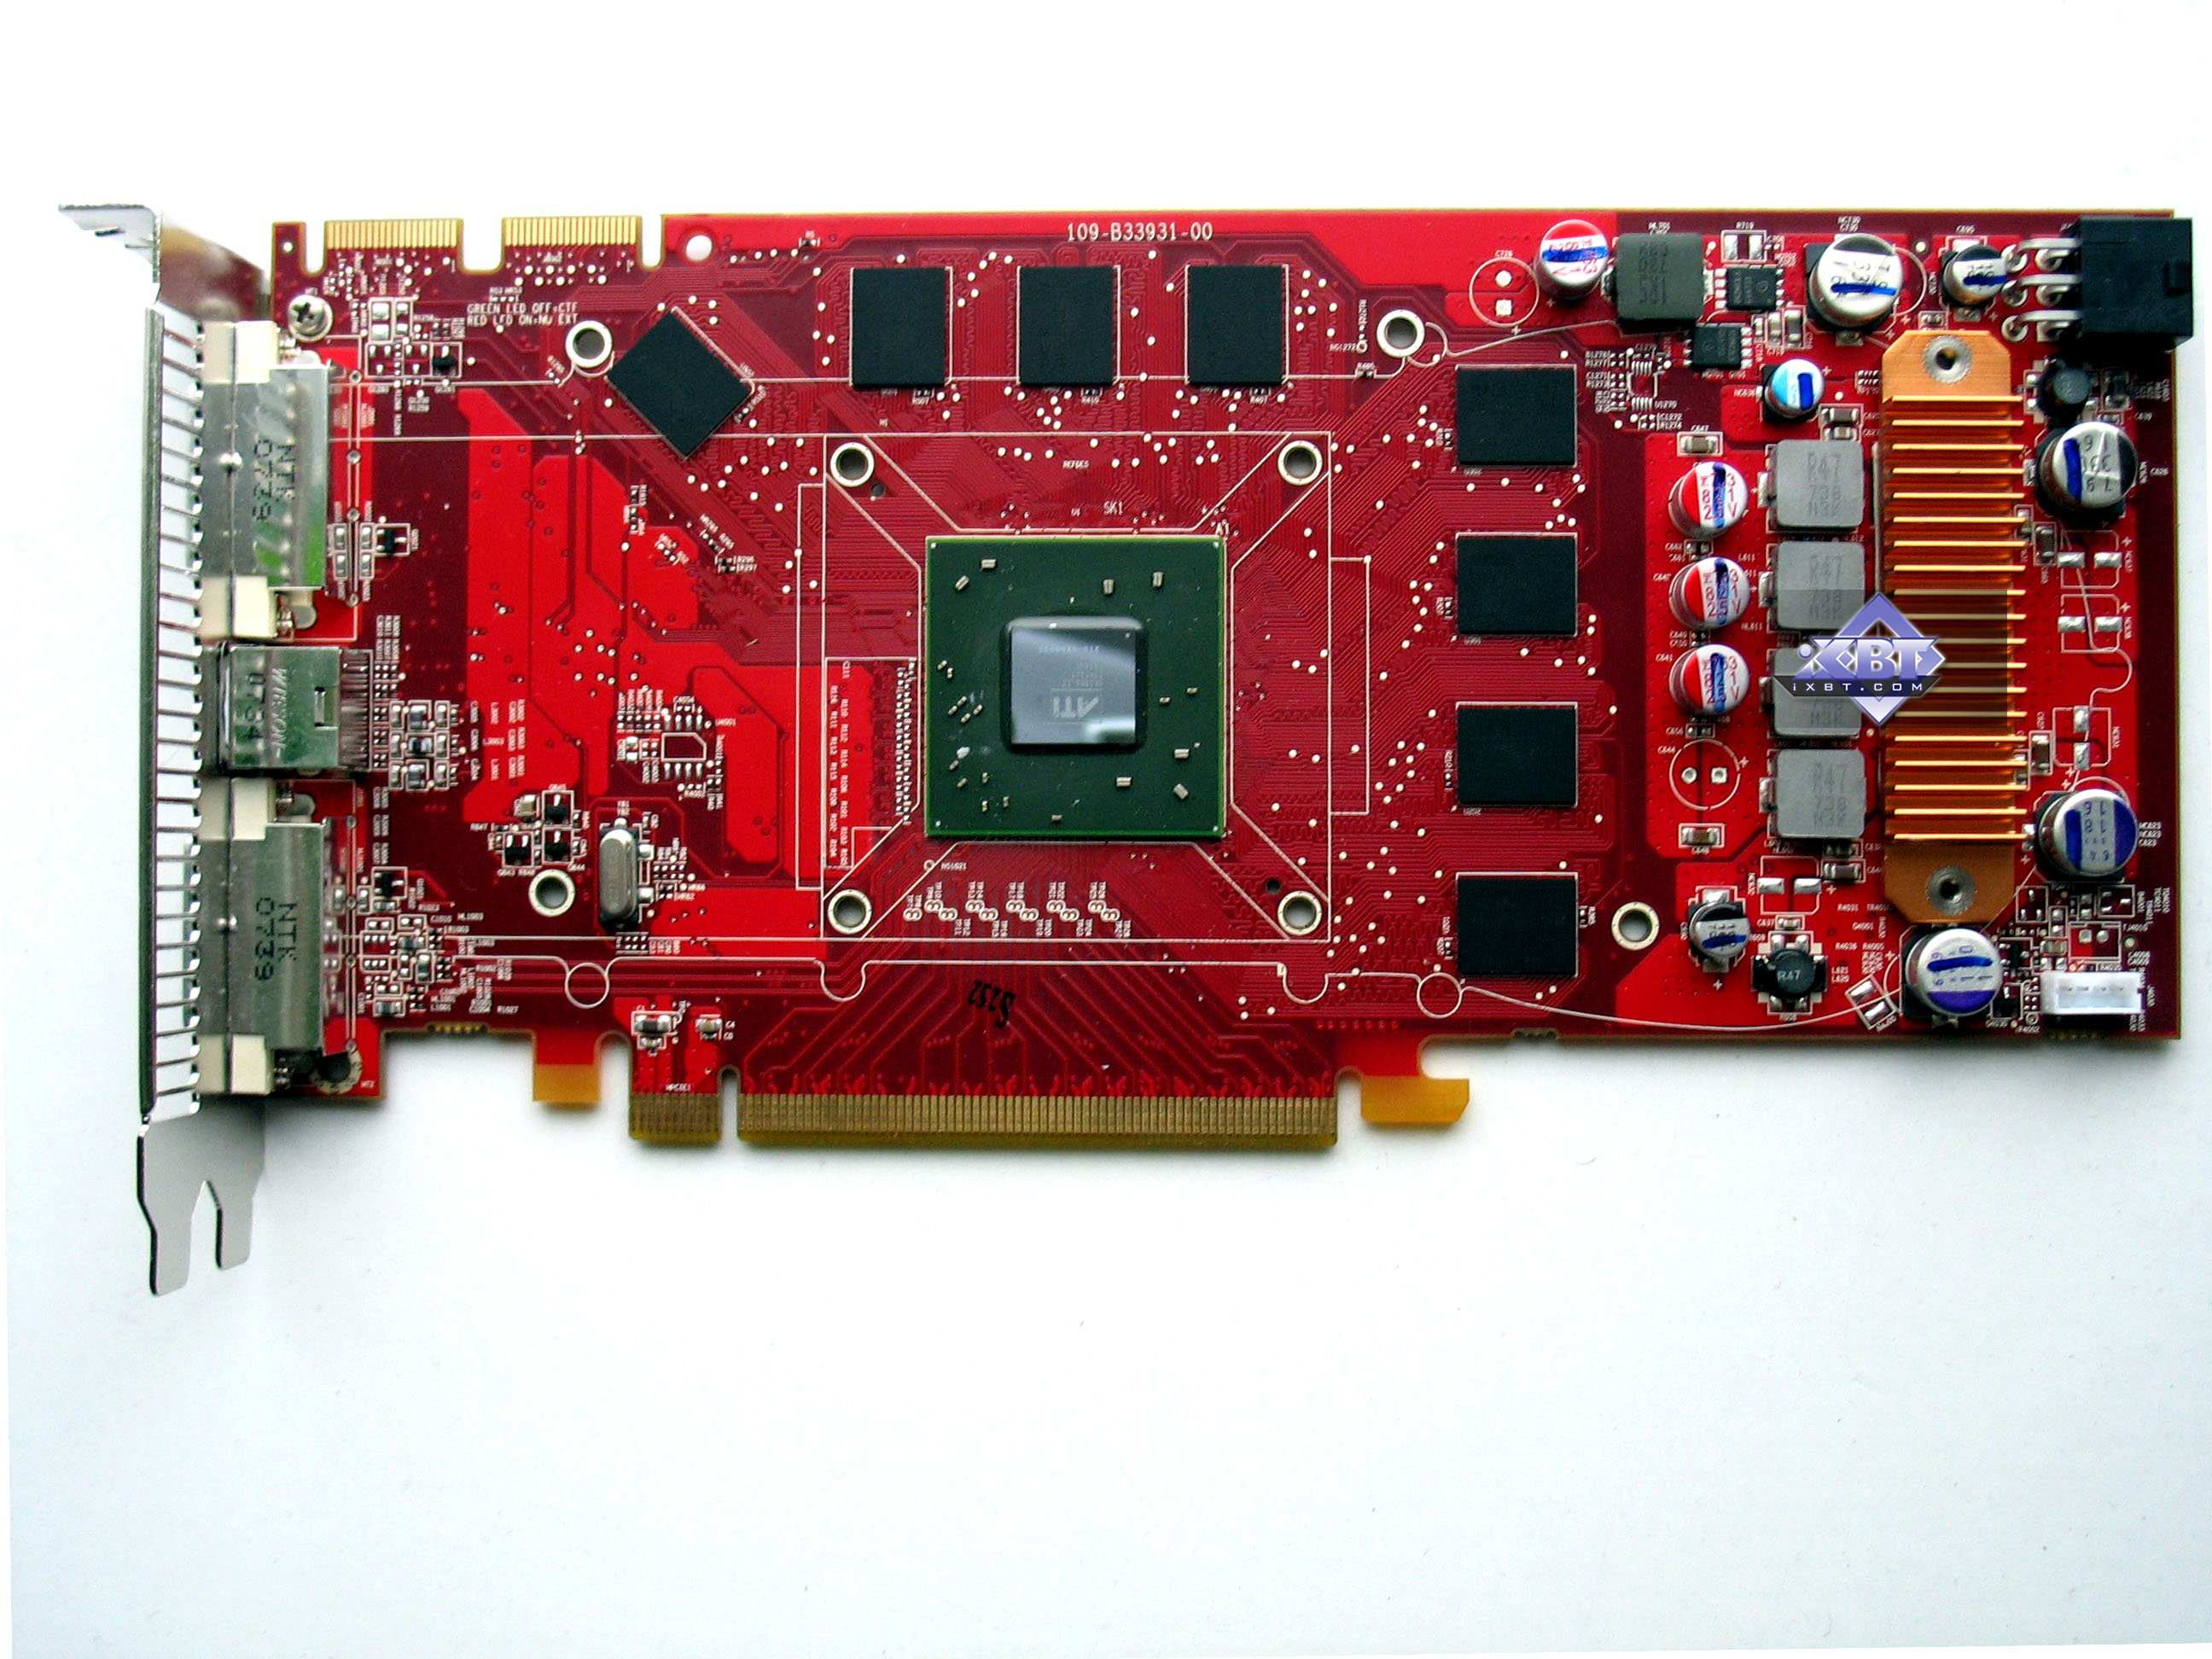
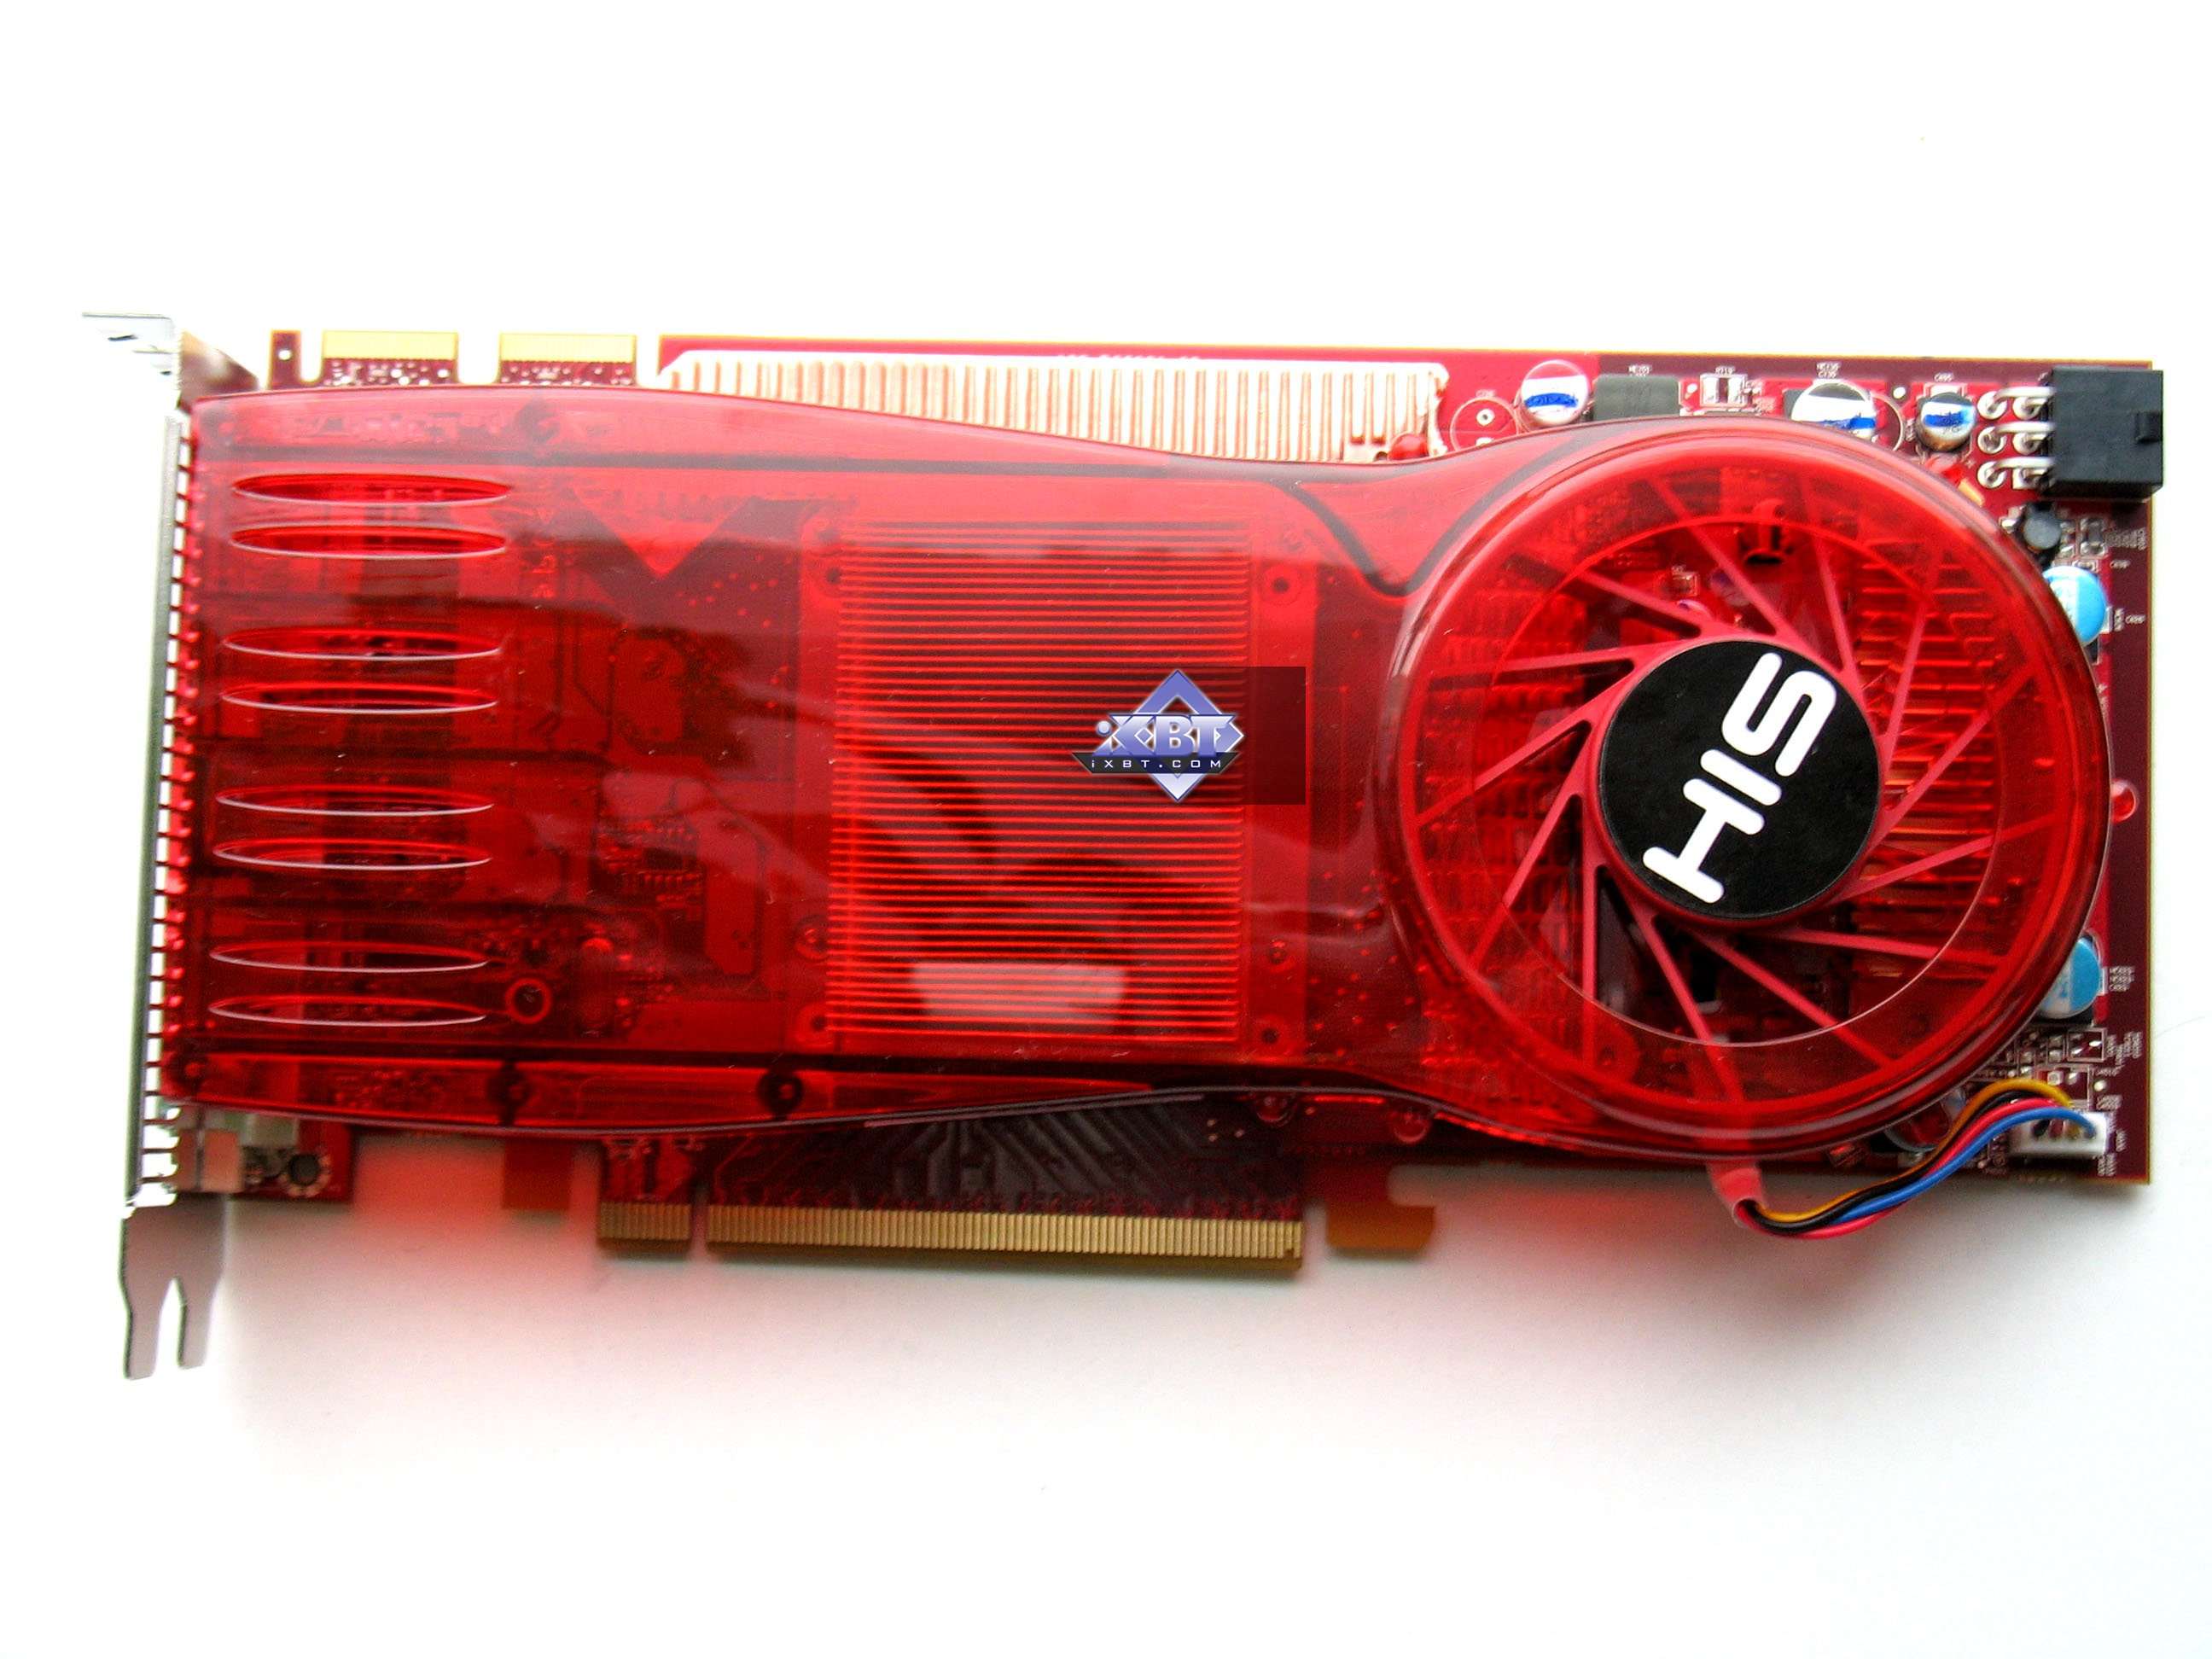
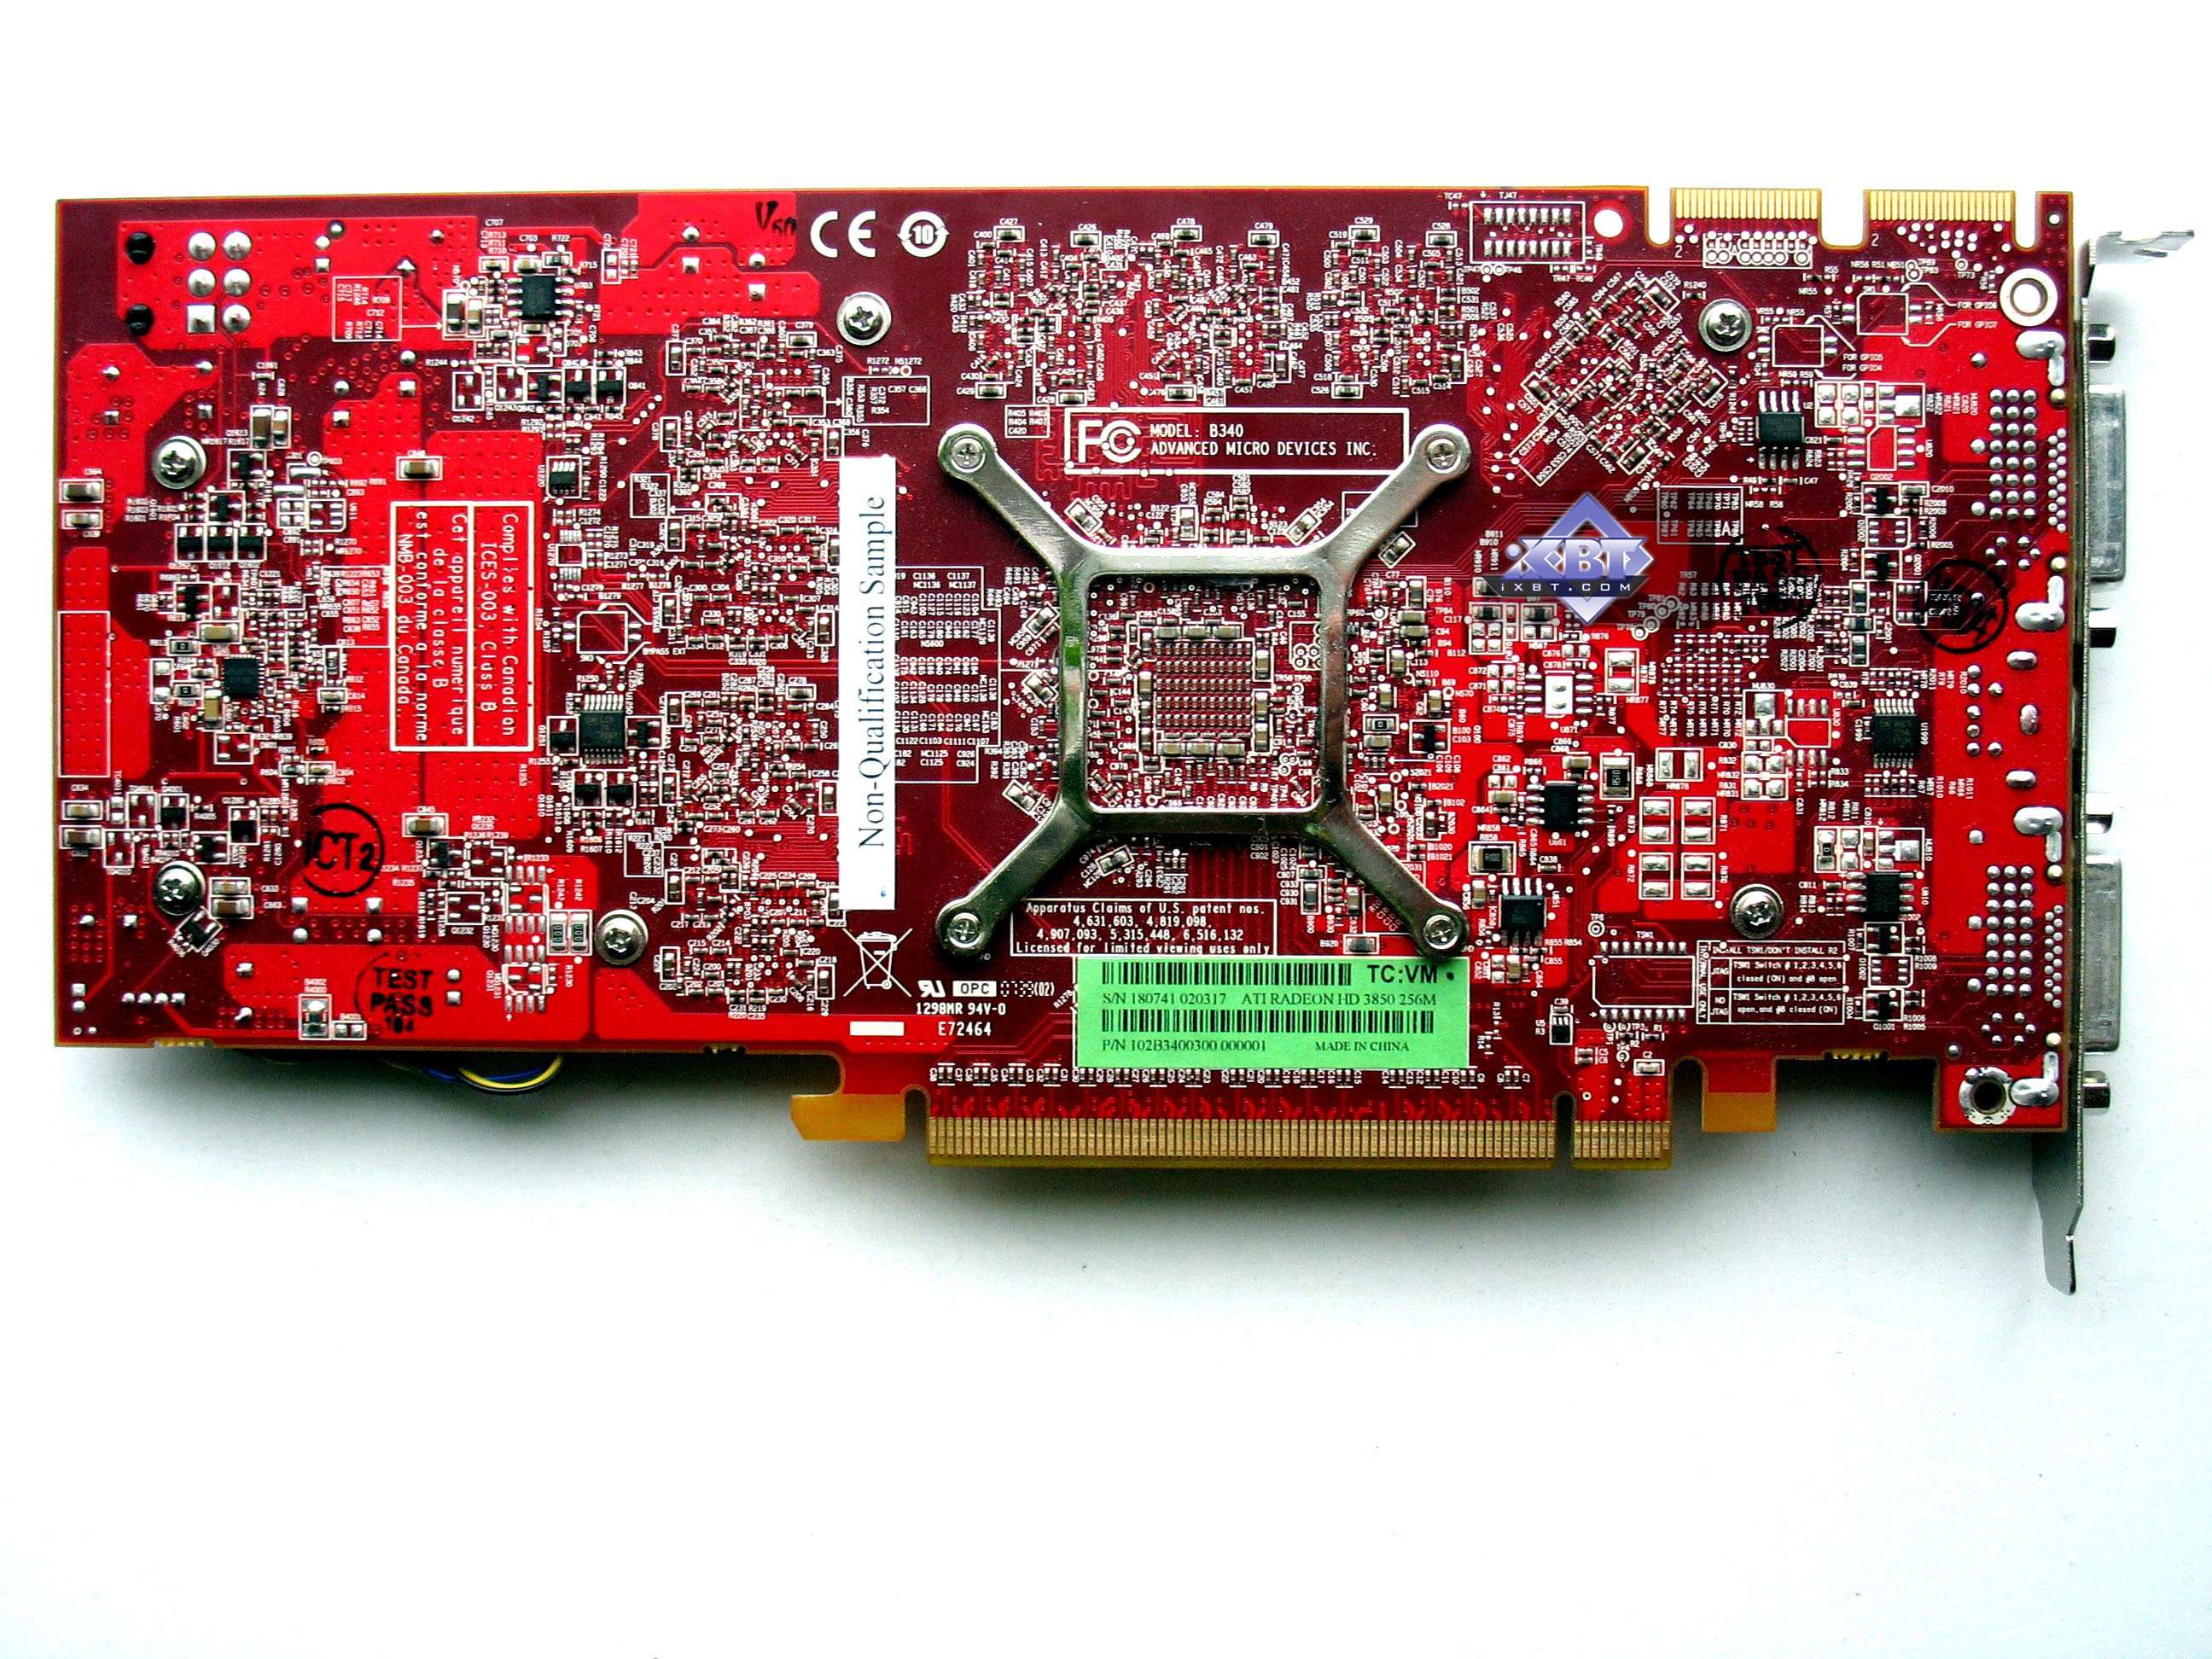
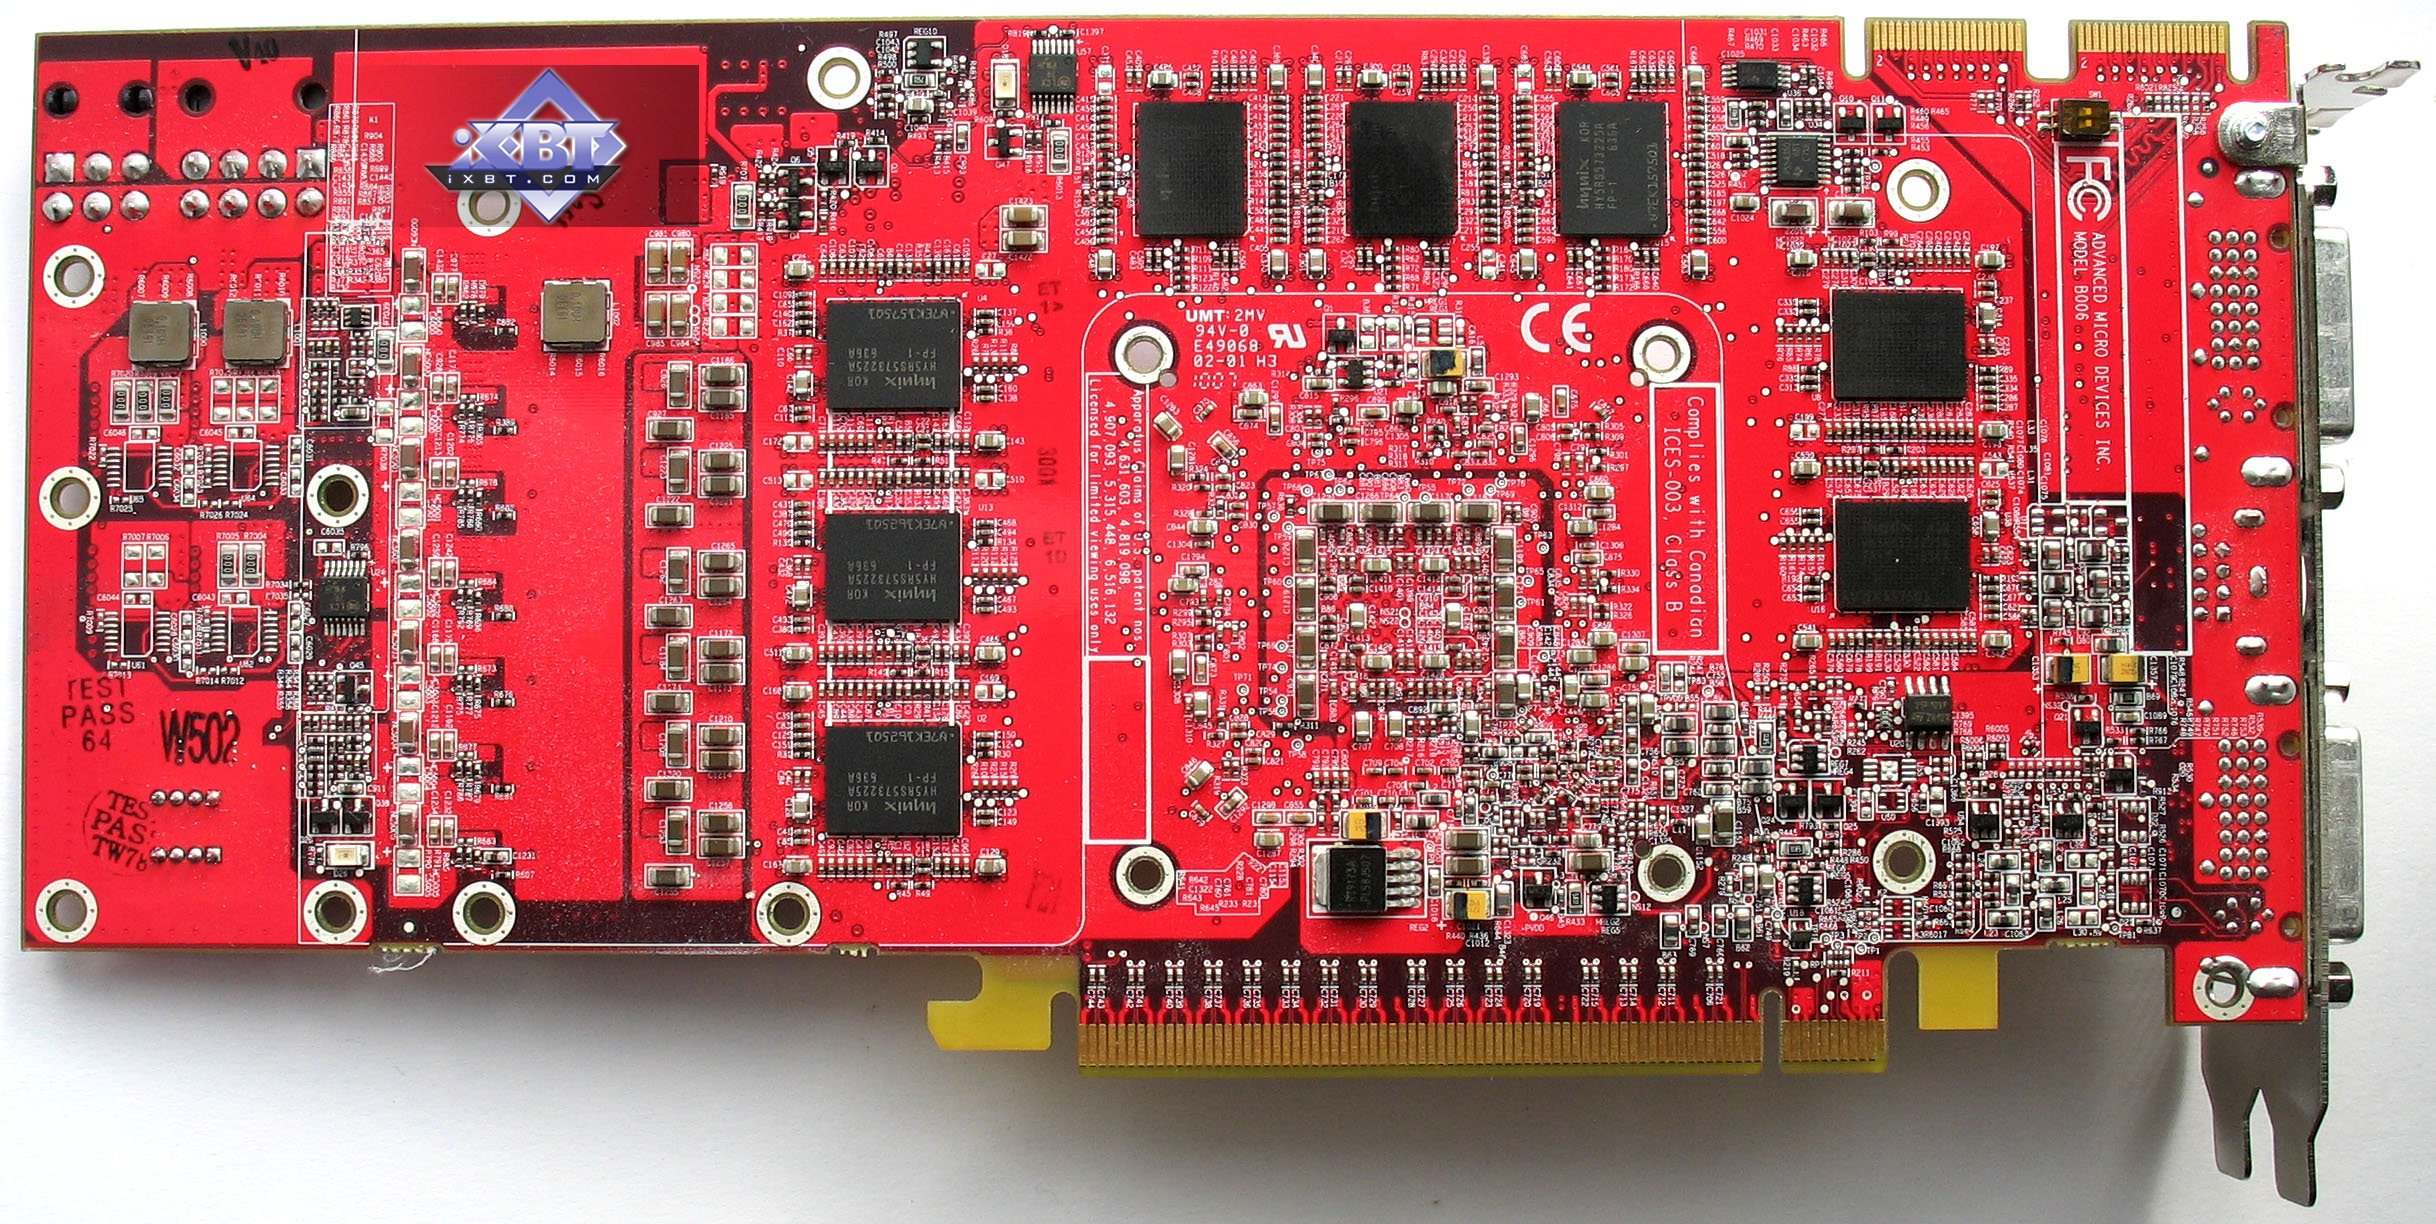
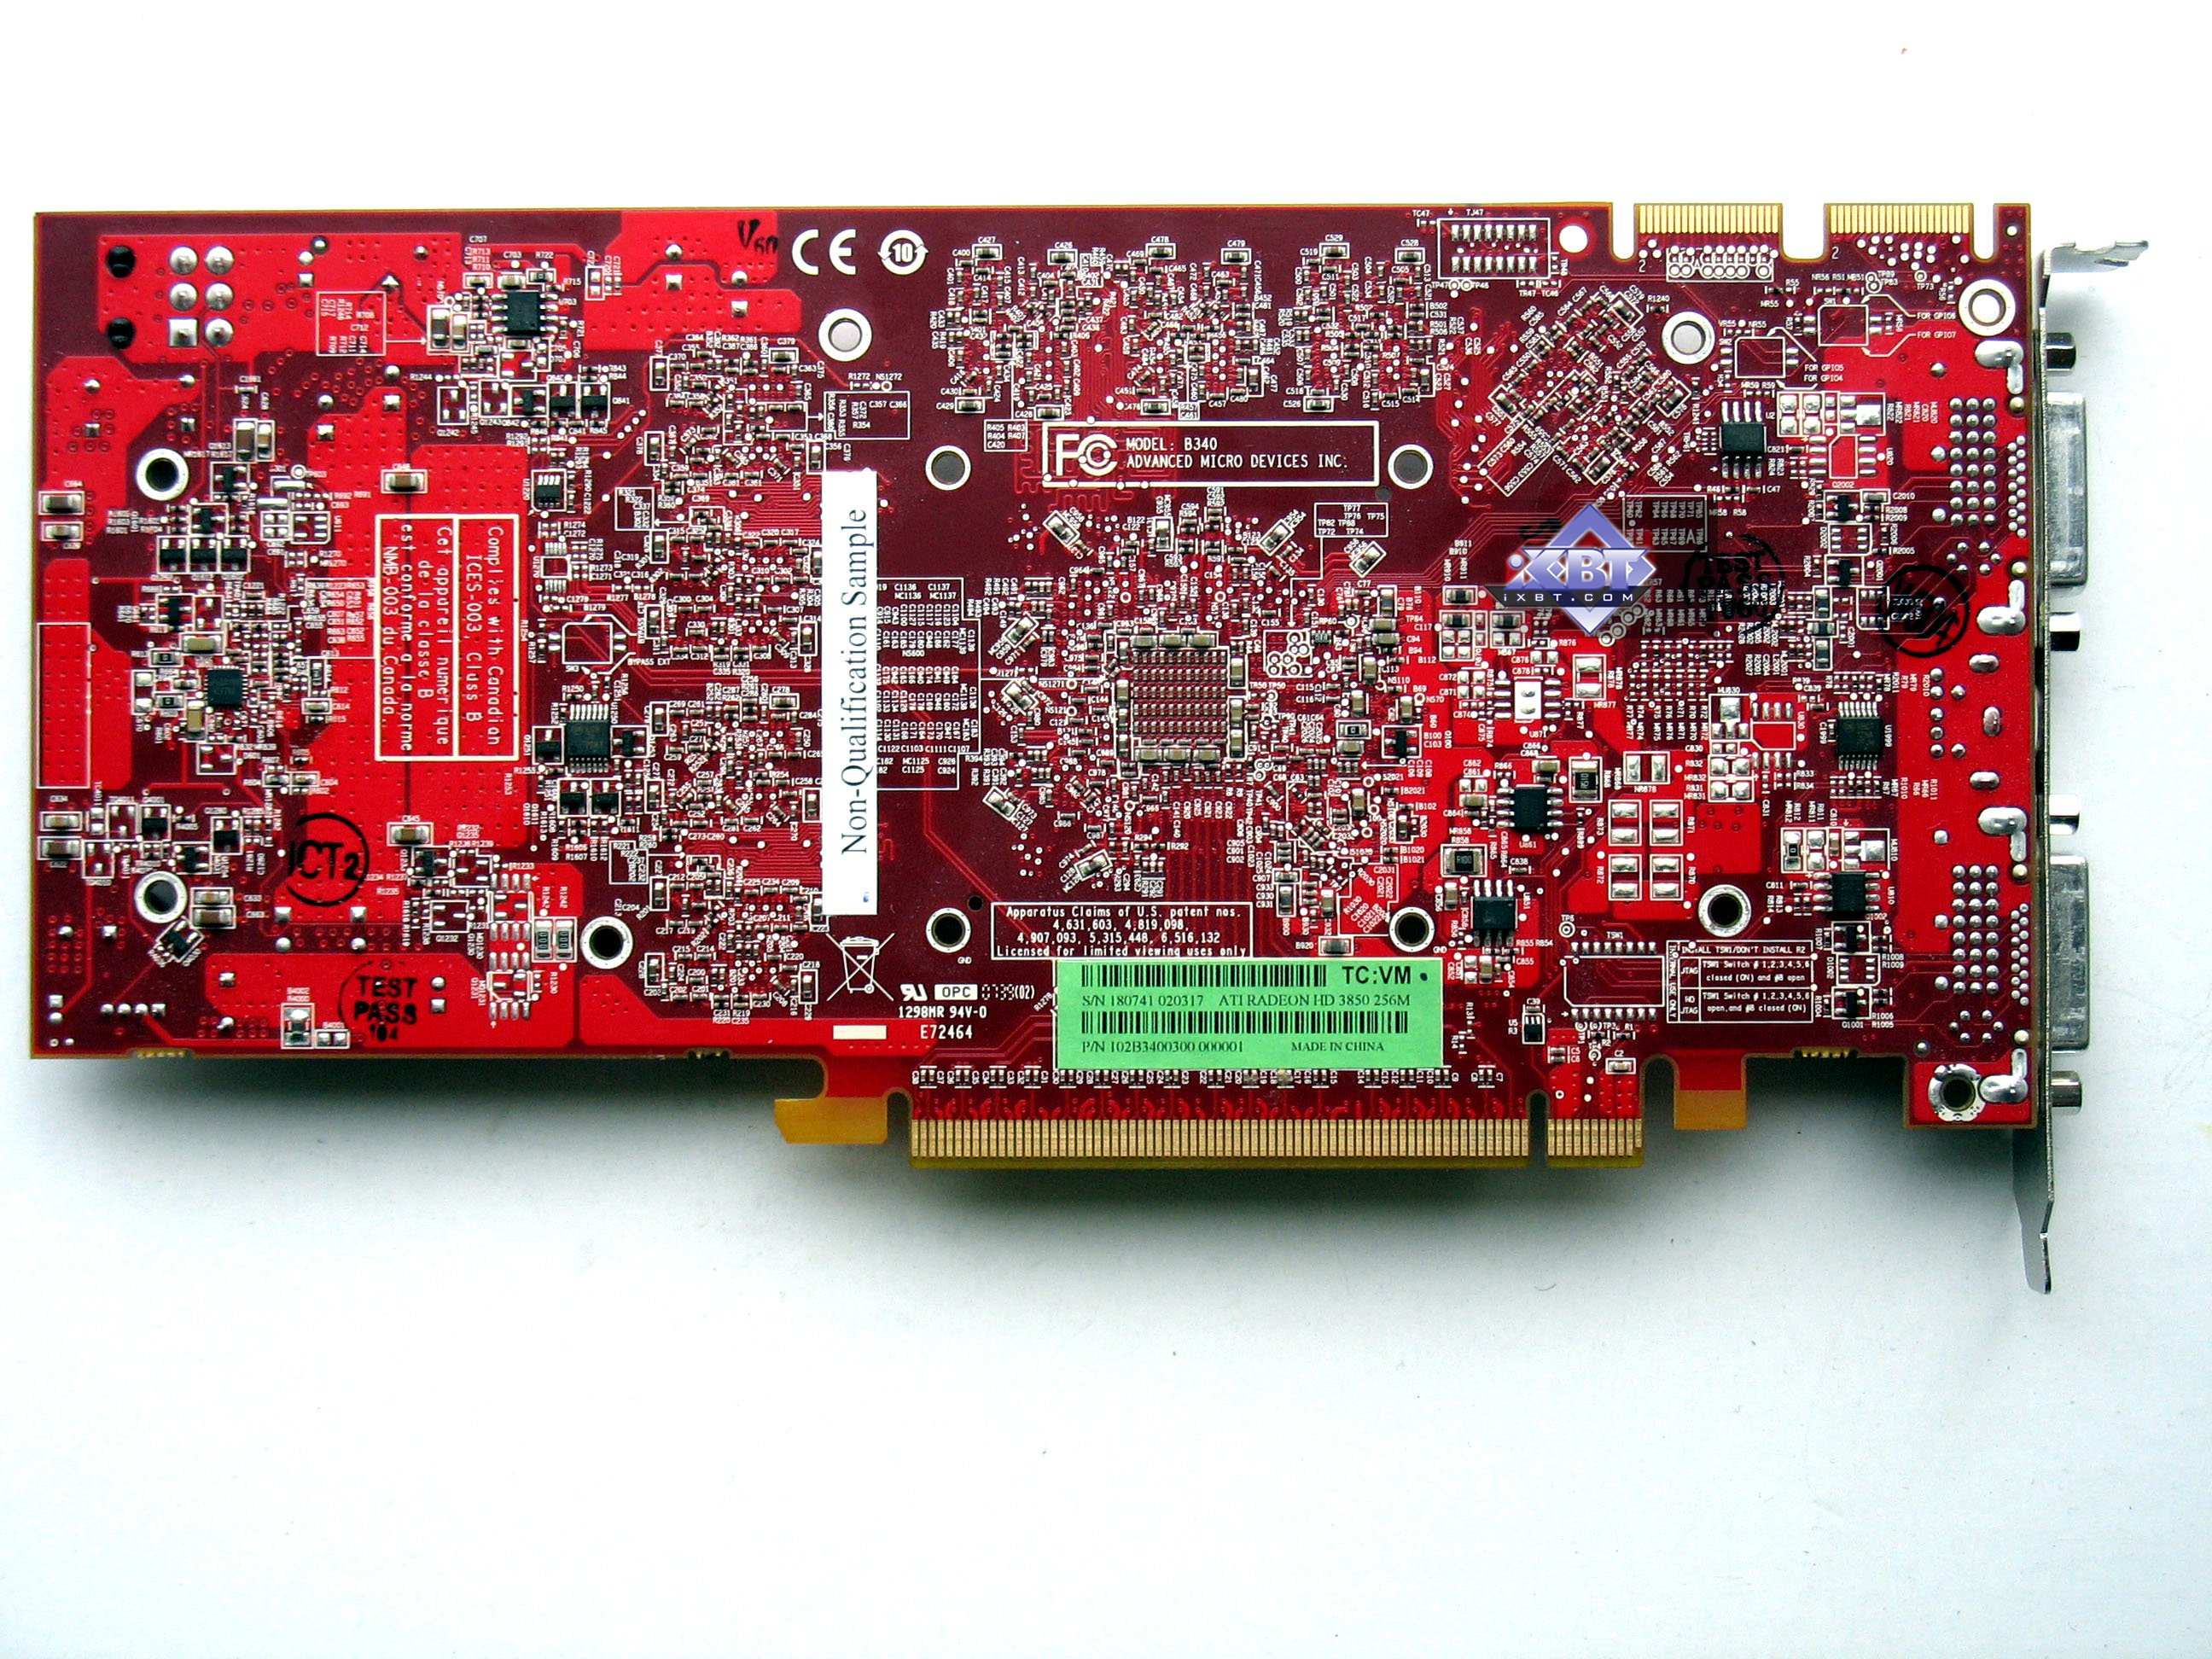
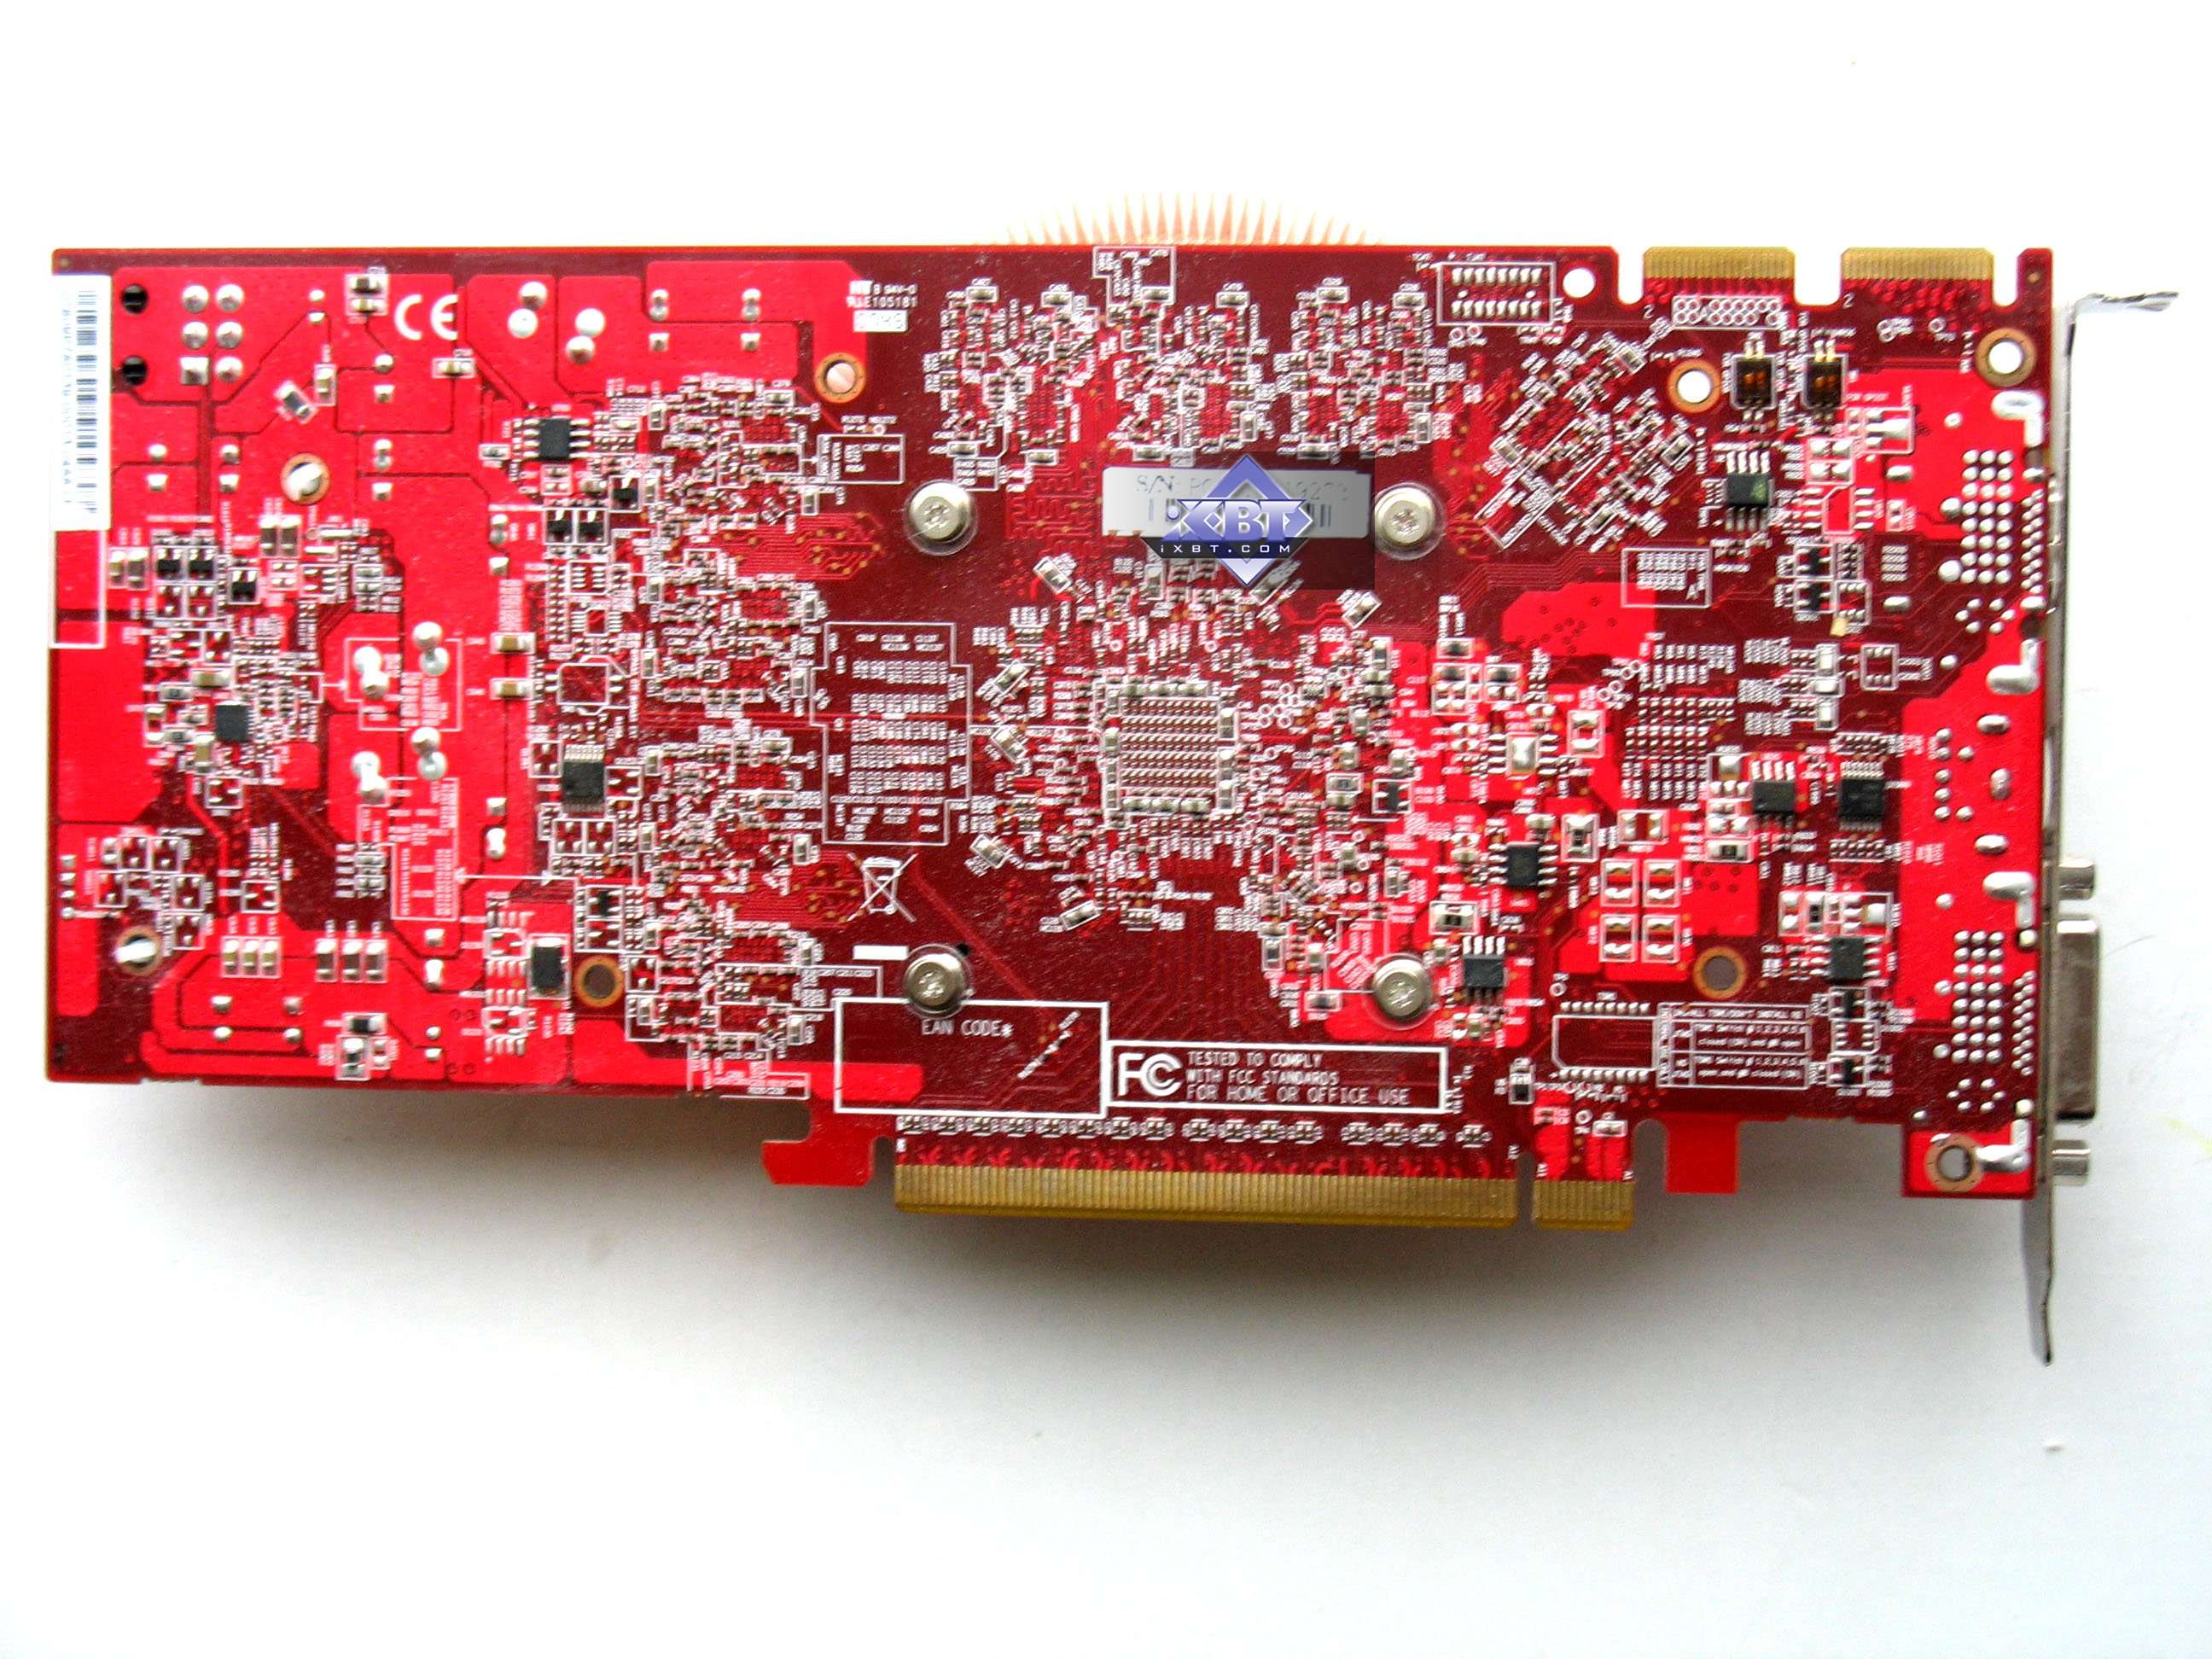
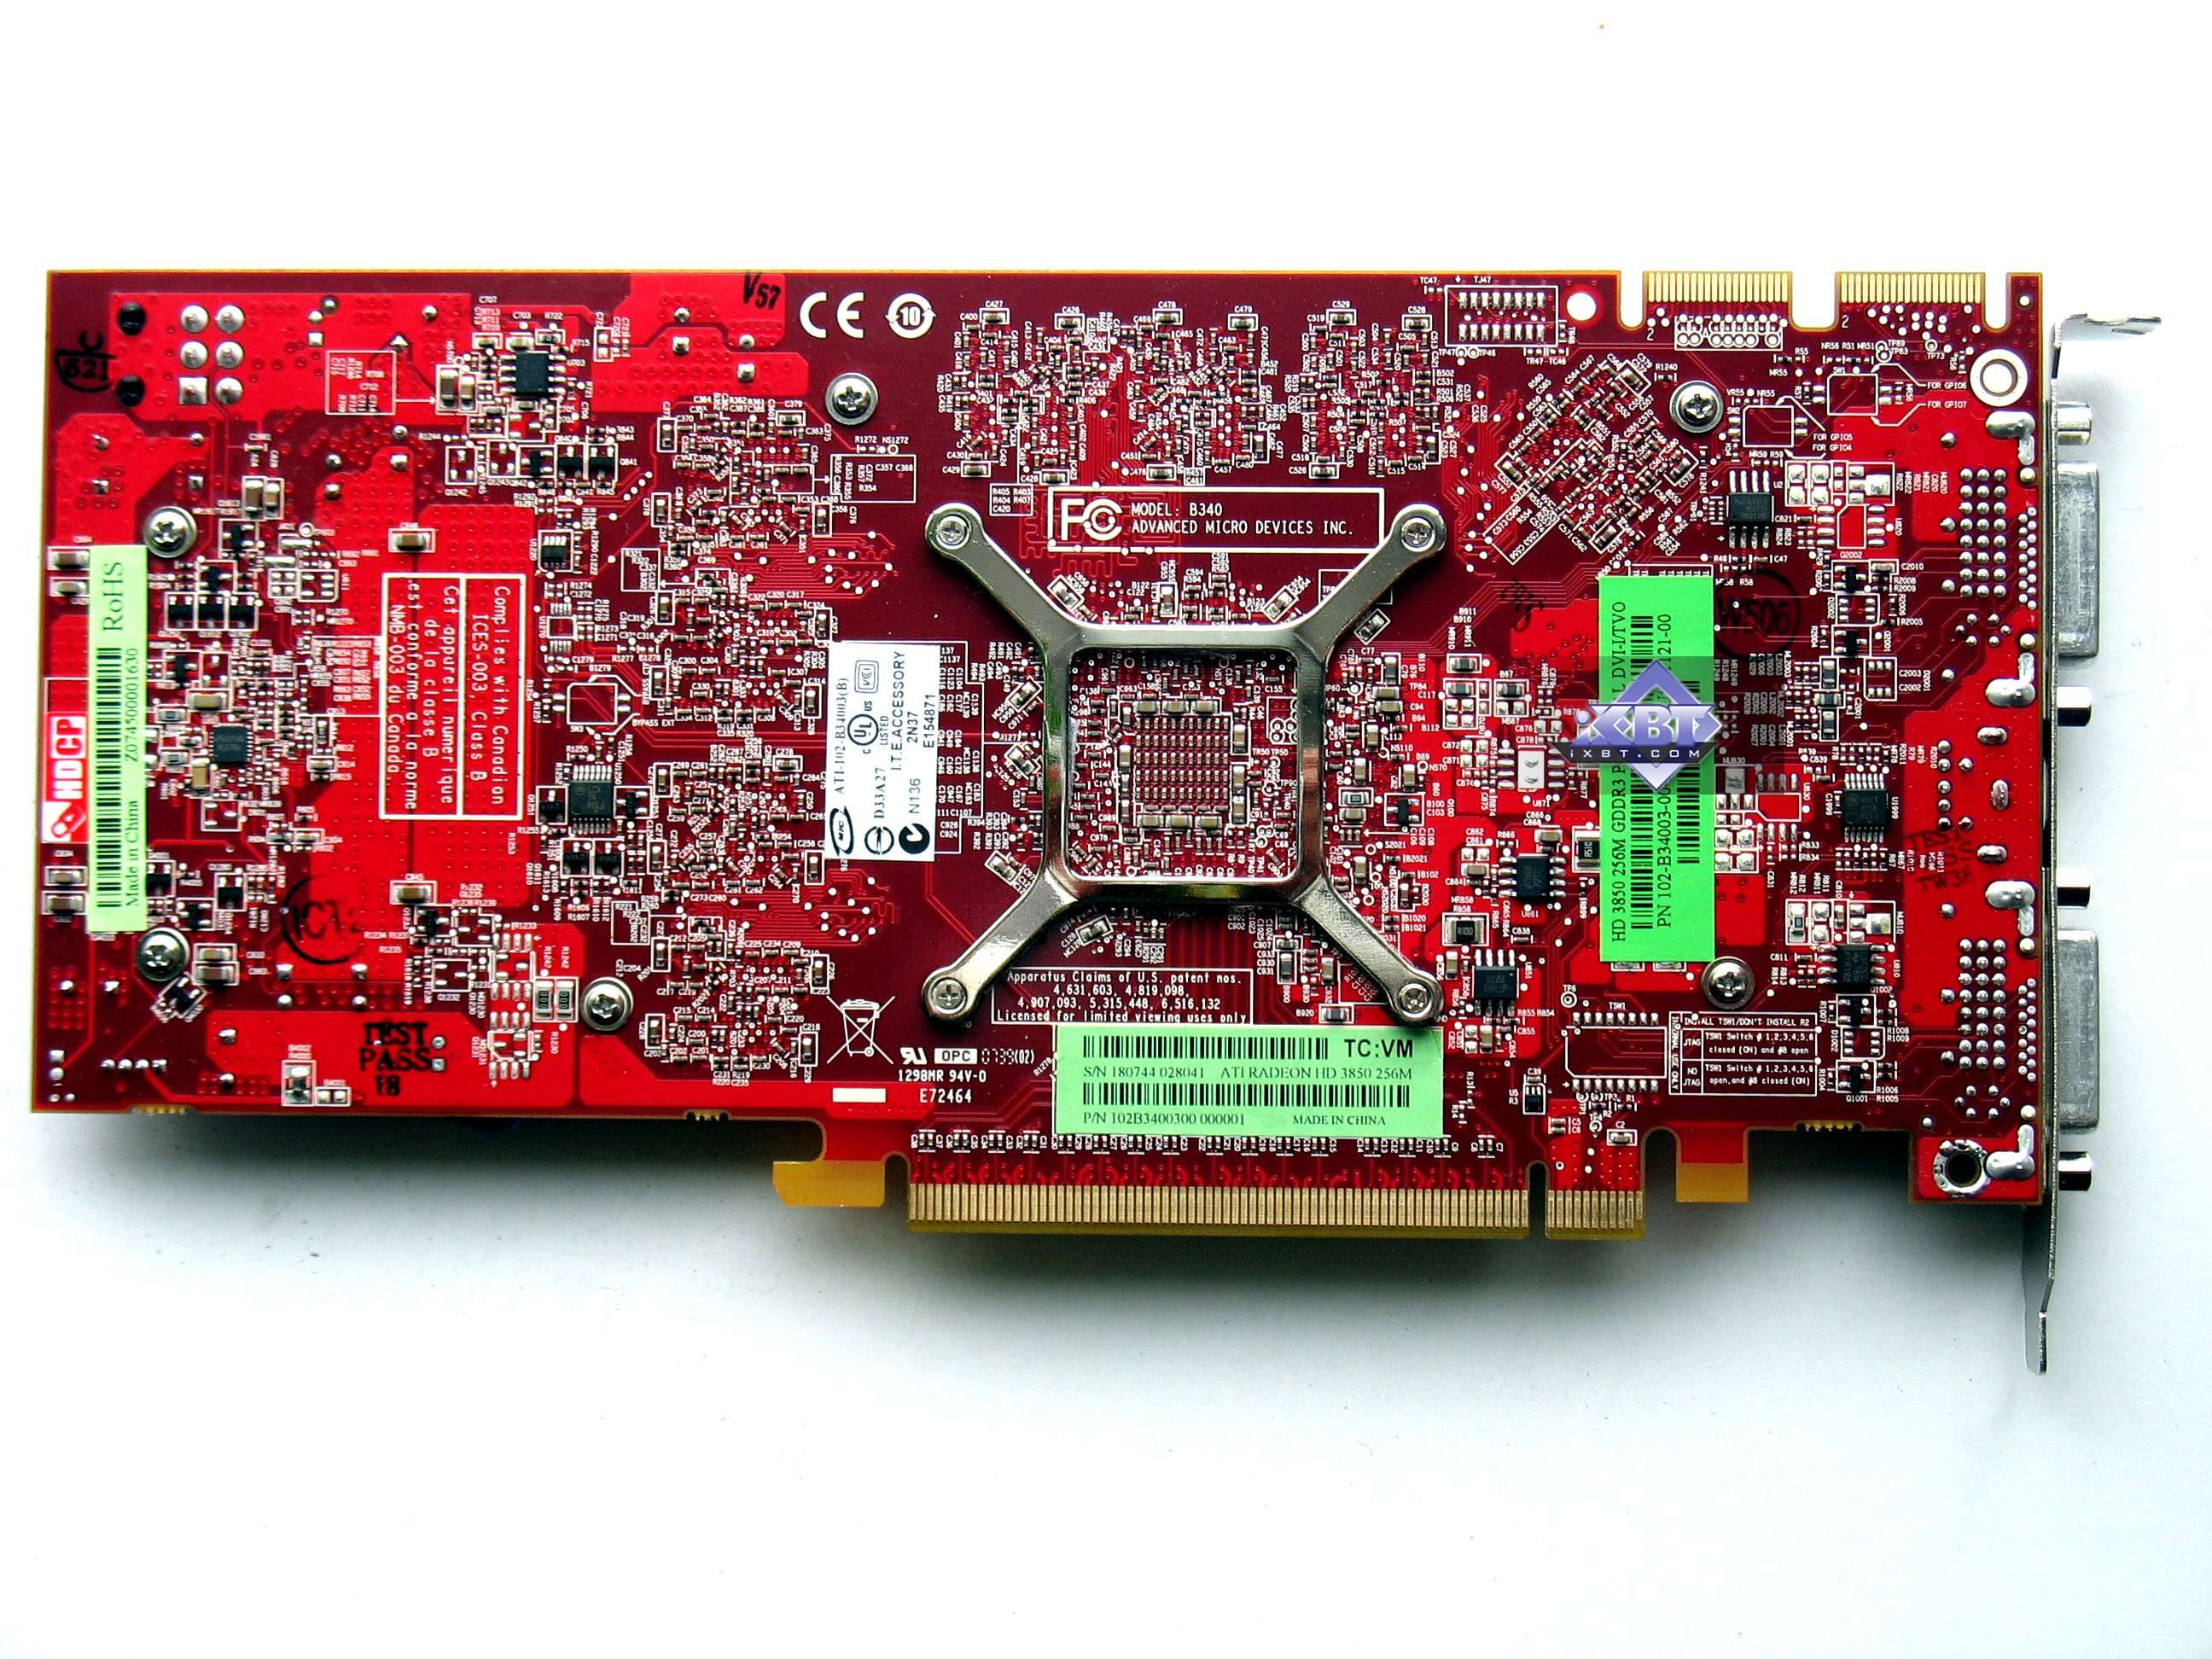
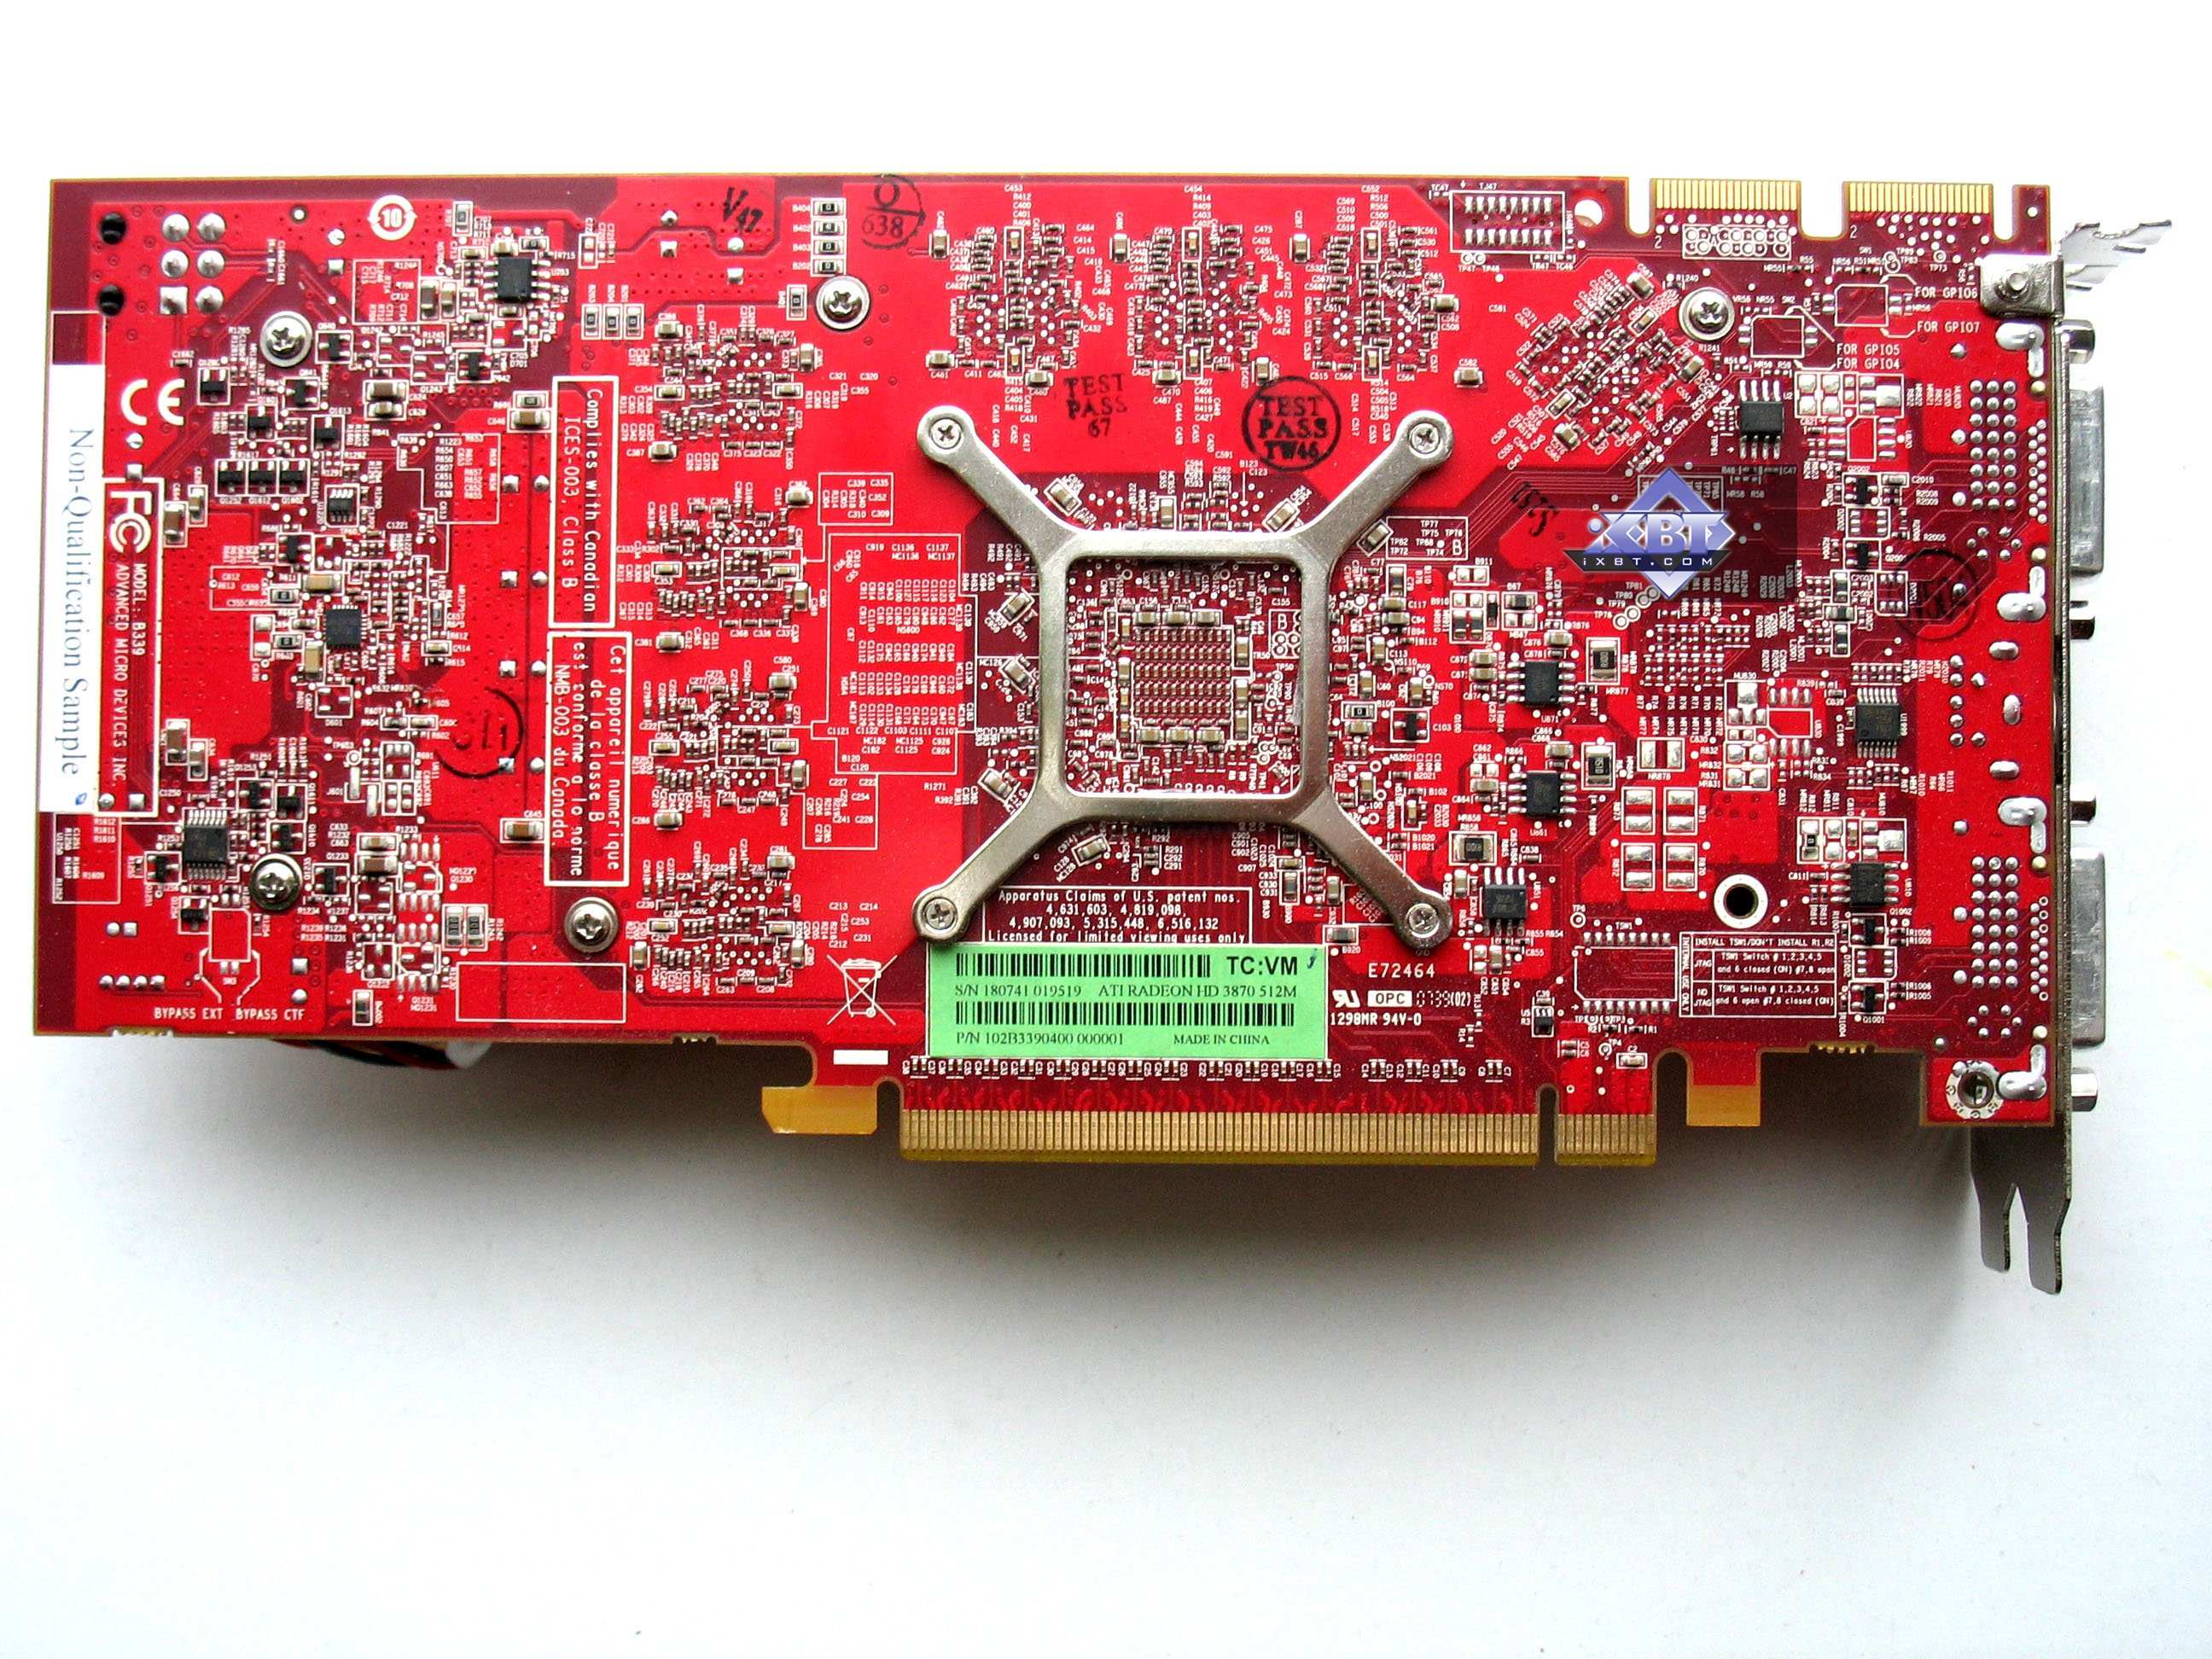
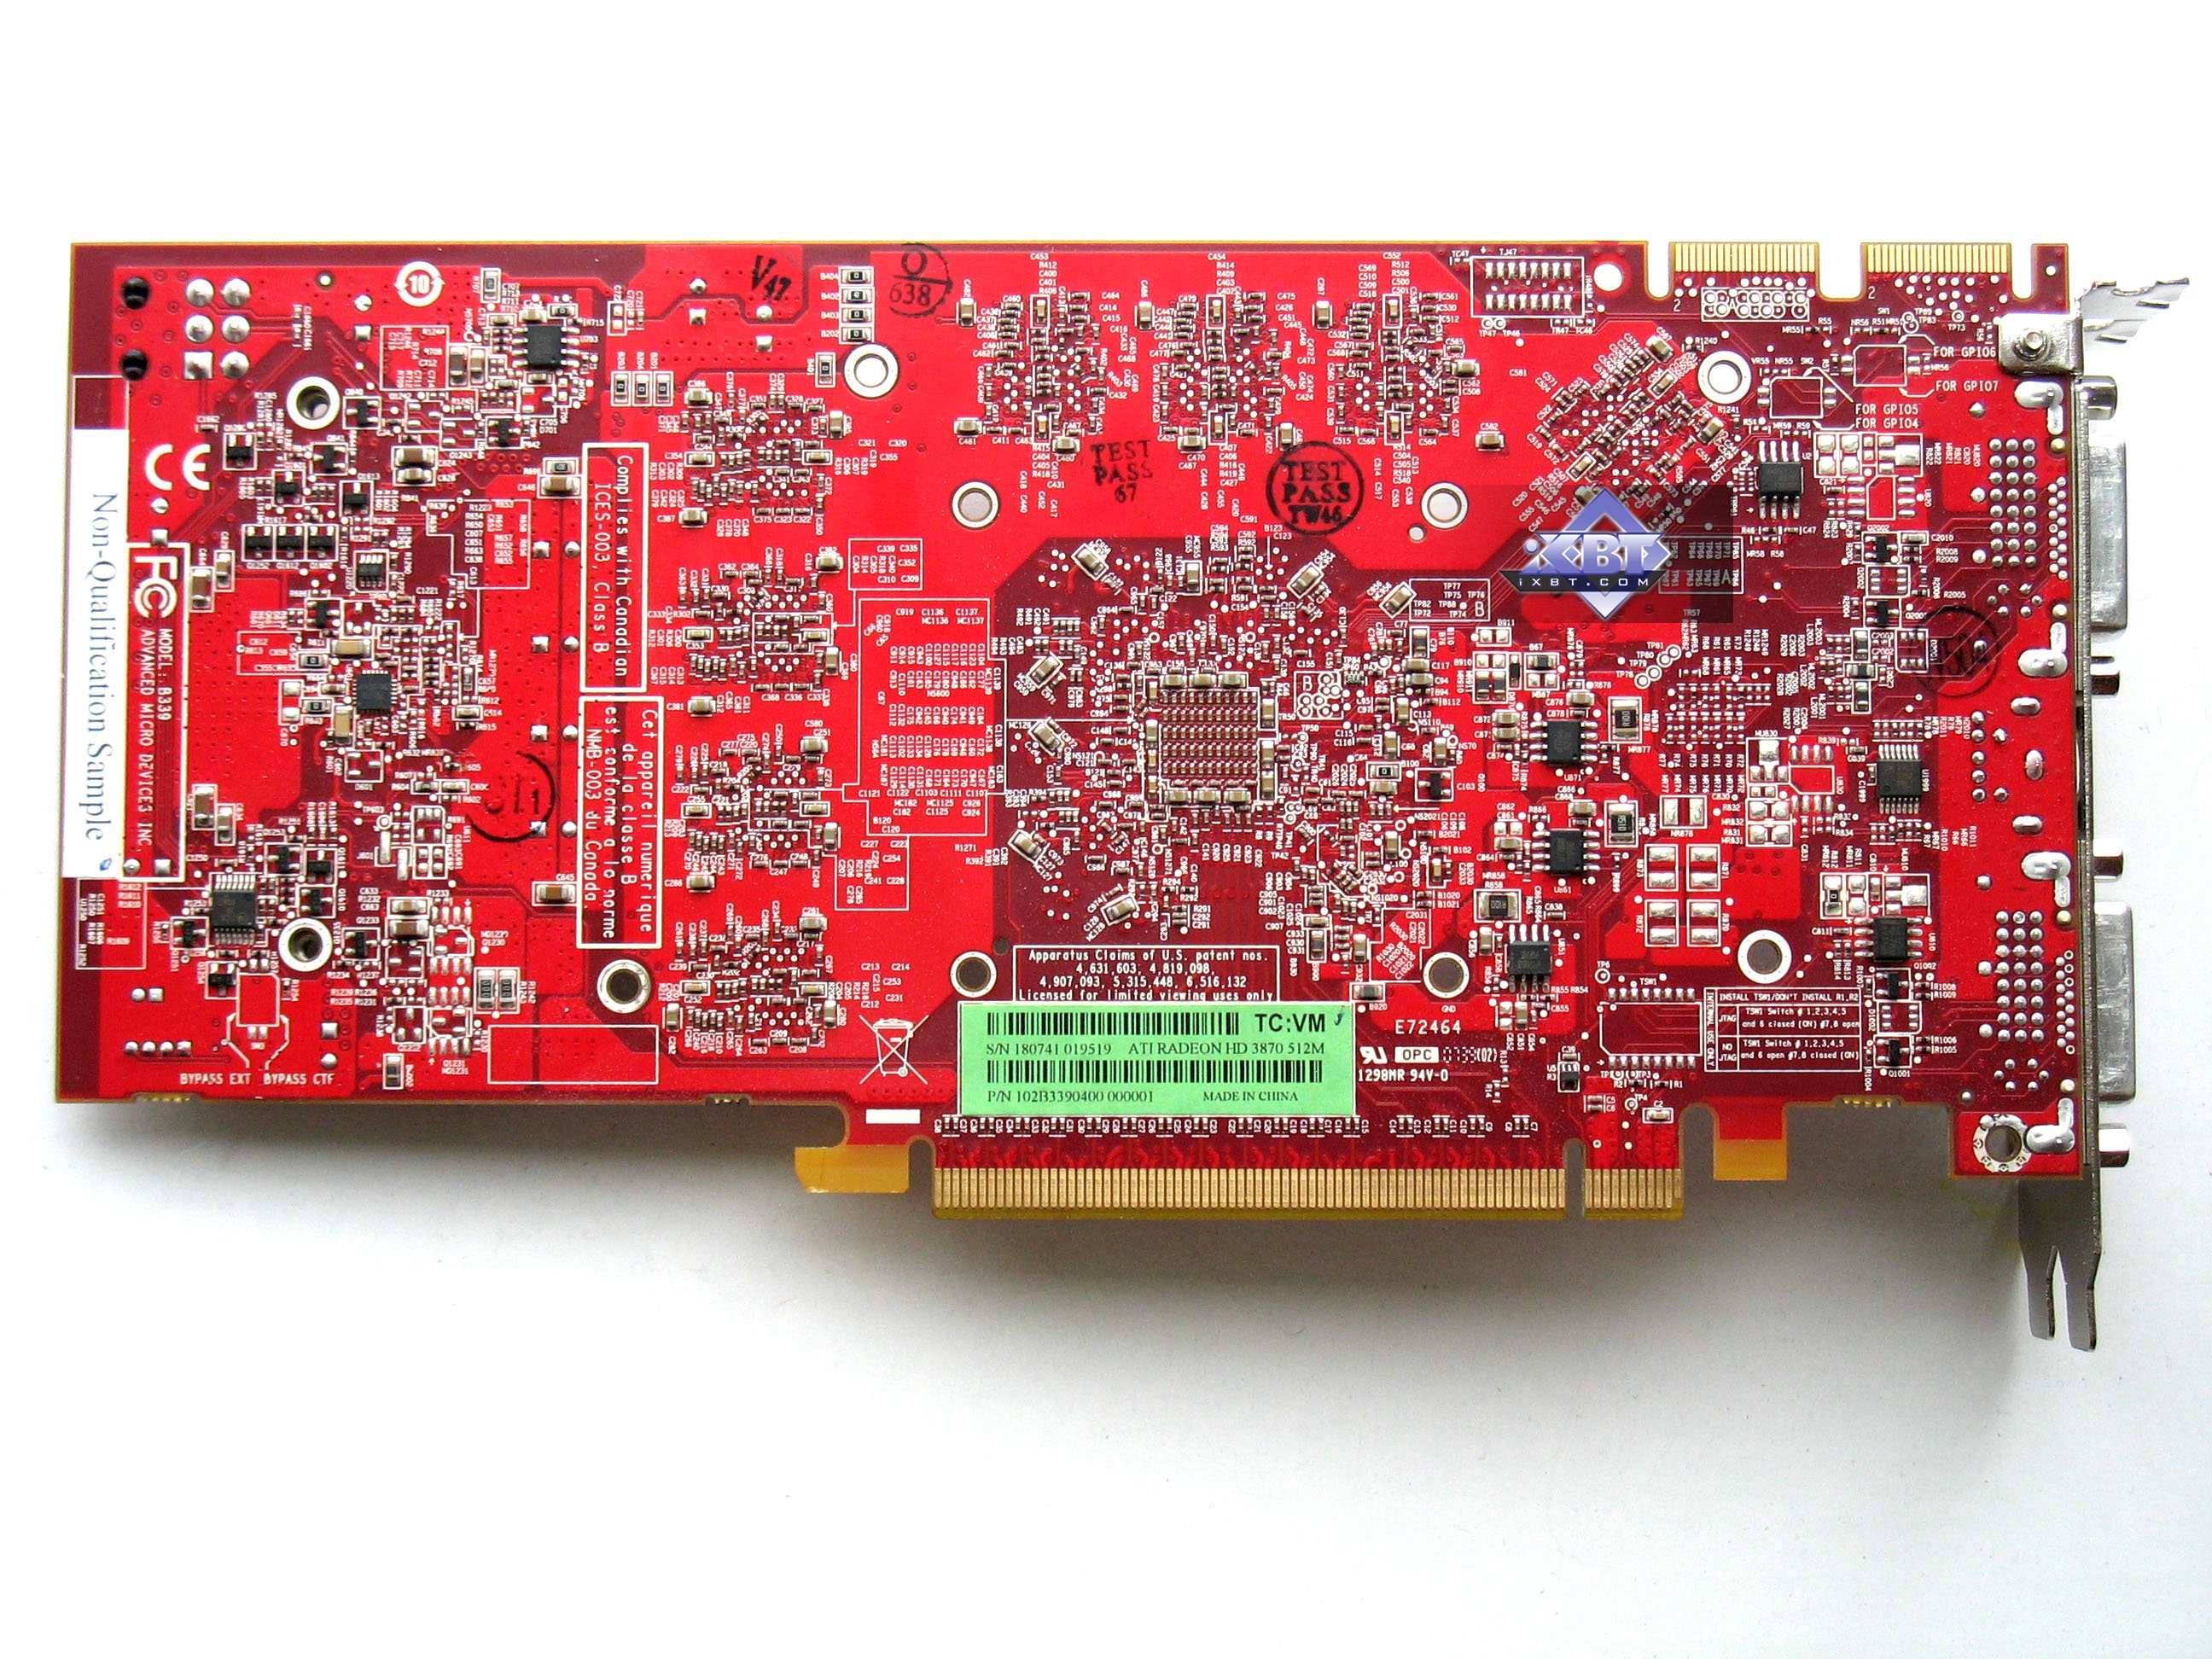
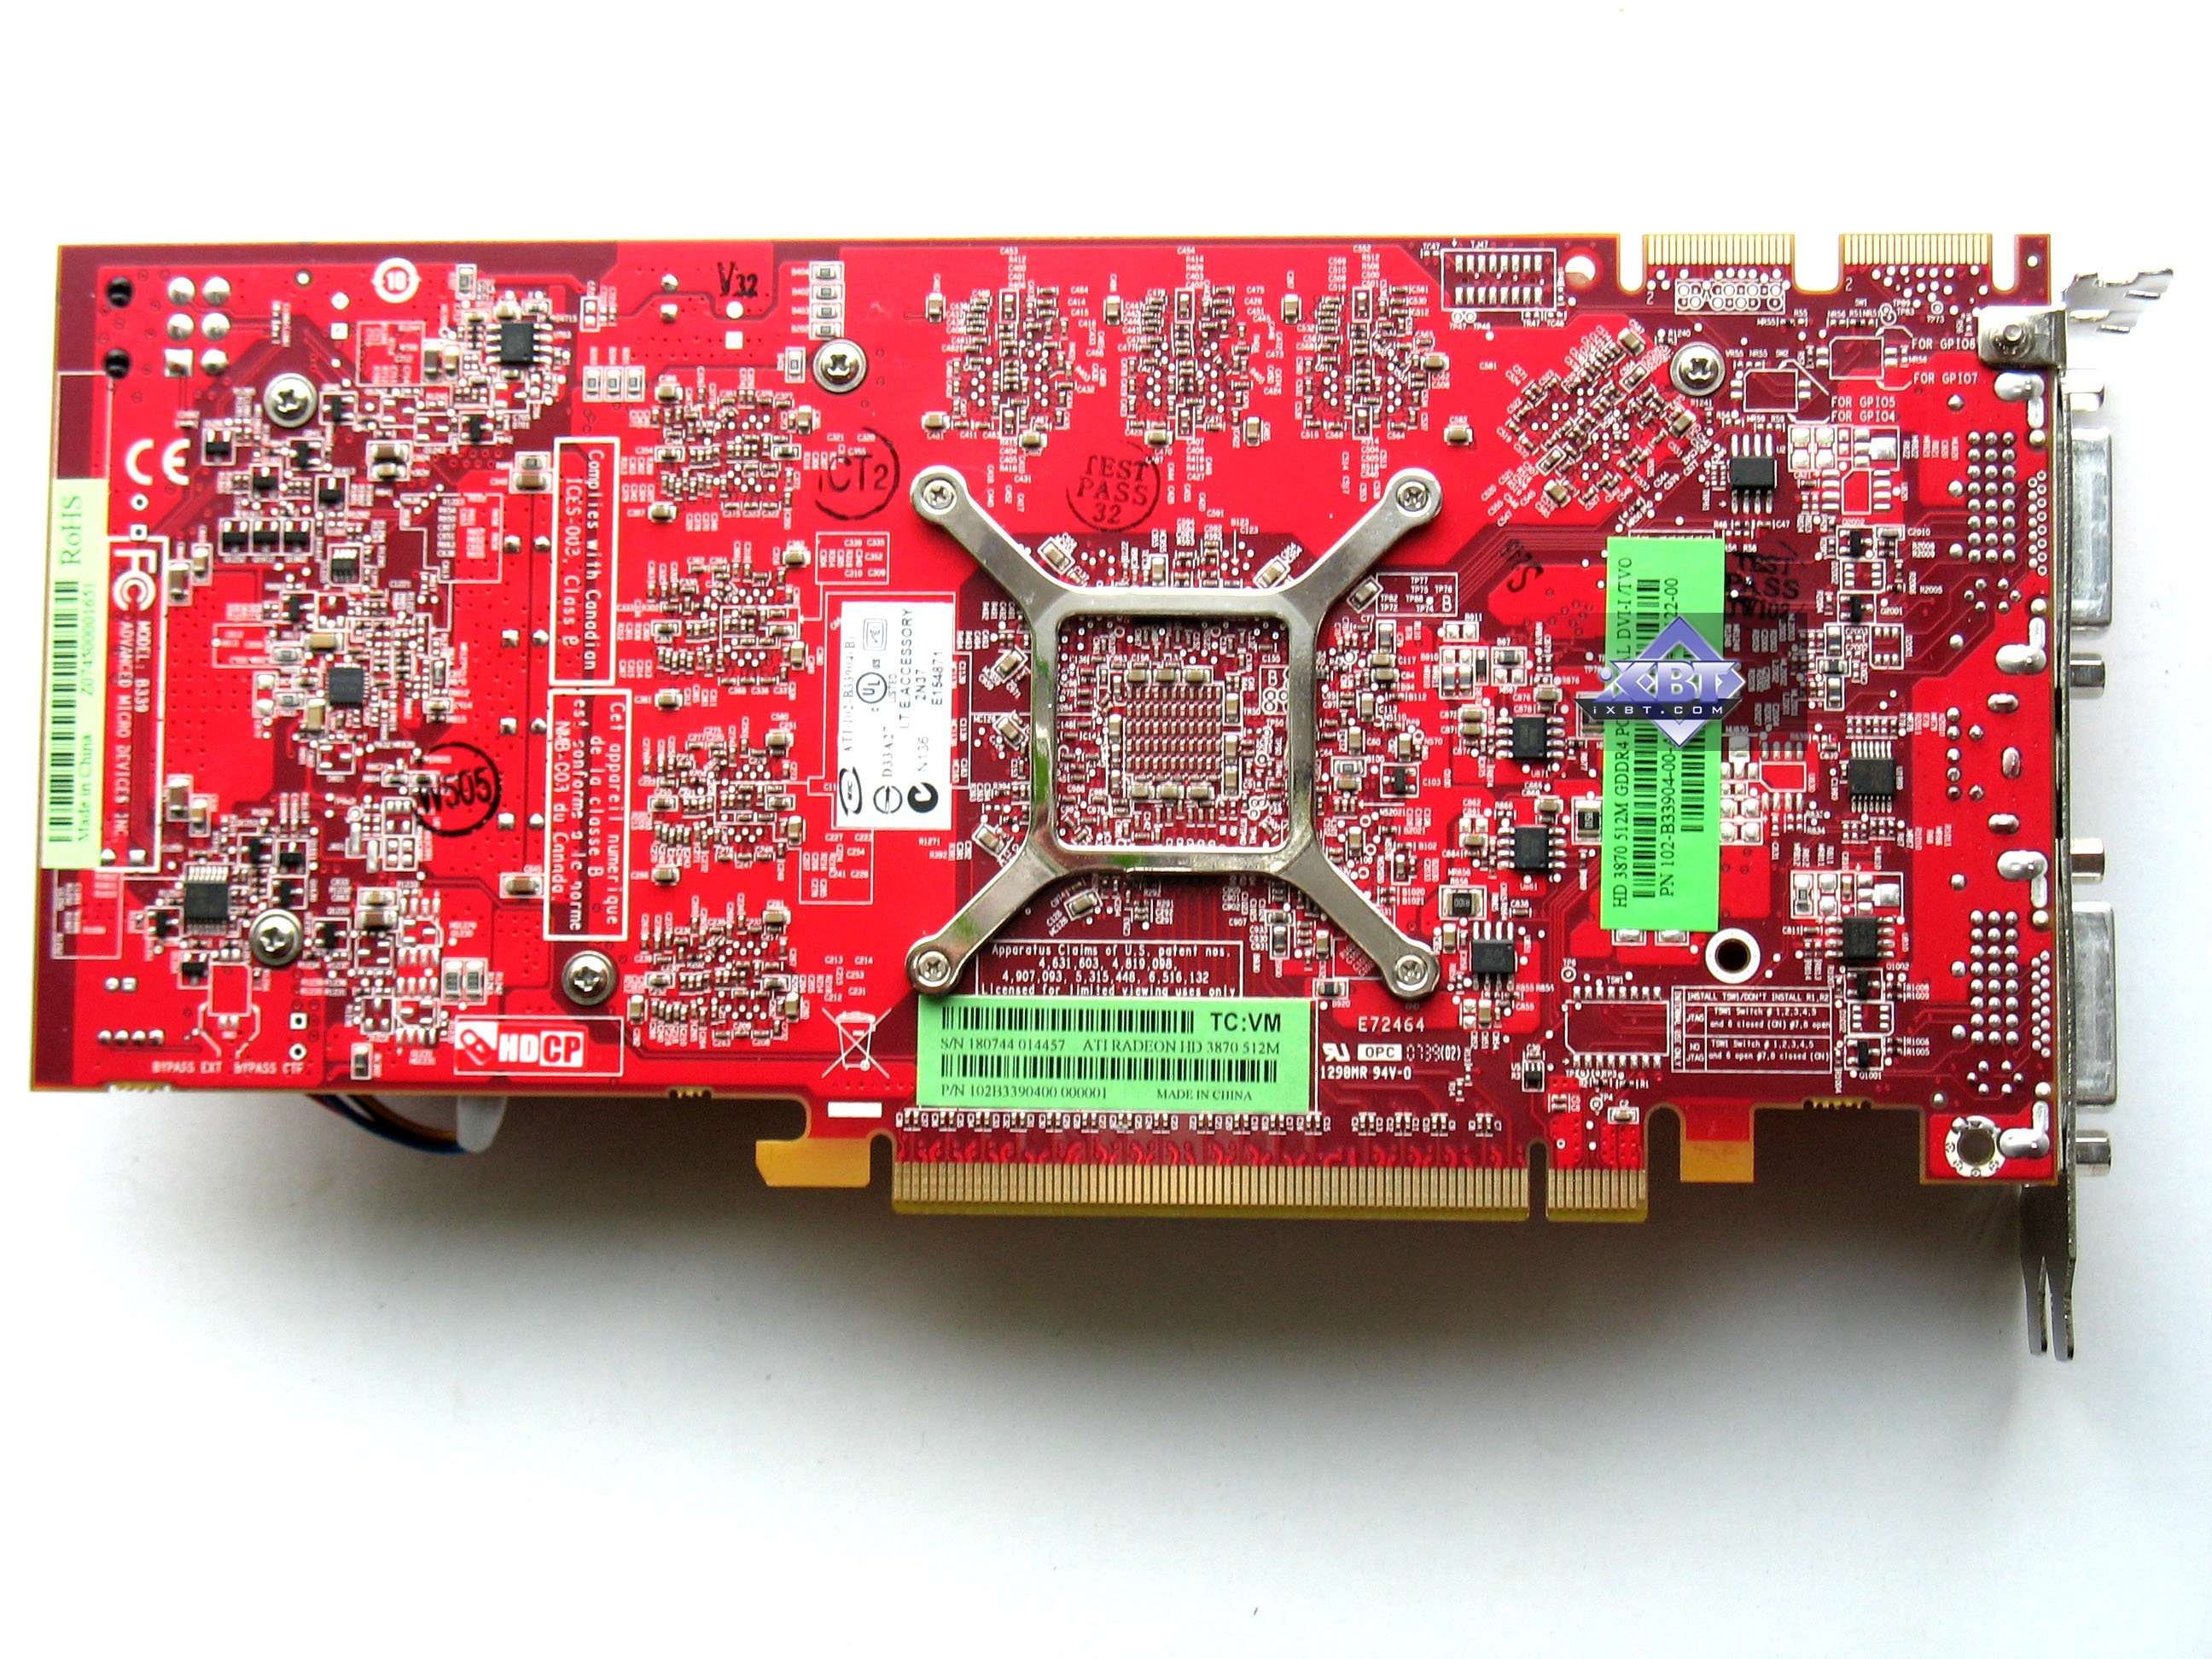
You can see on the photos that the 3850 and the 3870 differ in design, even though these cards actually differ only in frequencies and memory size. But different requirements to power supply as well as different DDR3 and DDR4 componentry made engineers come up with two designs.
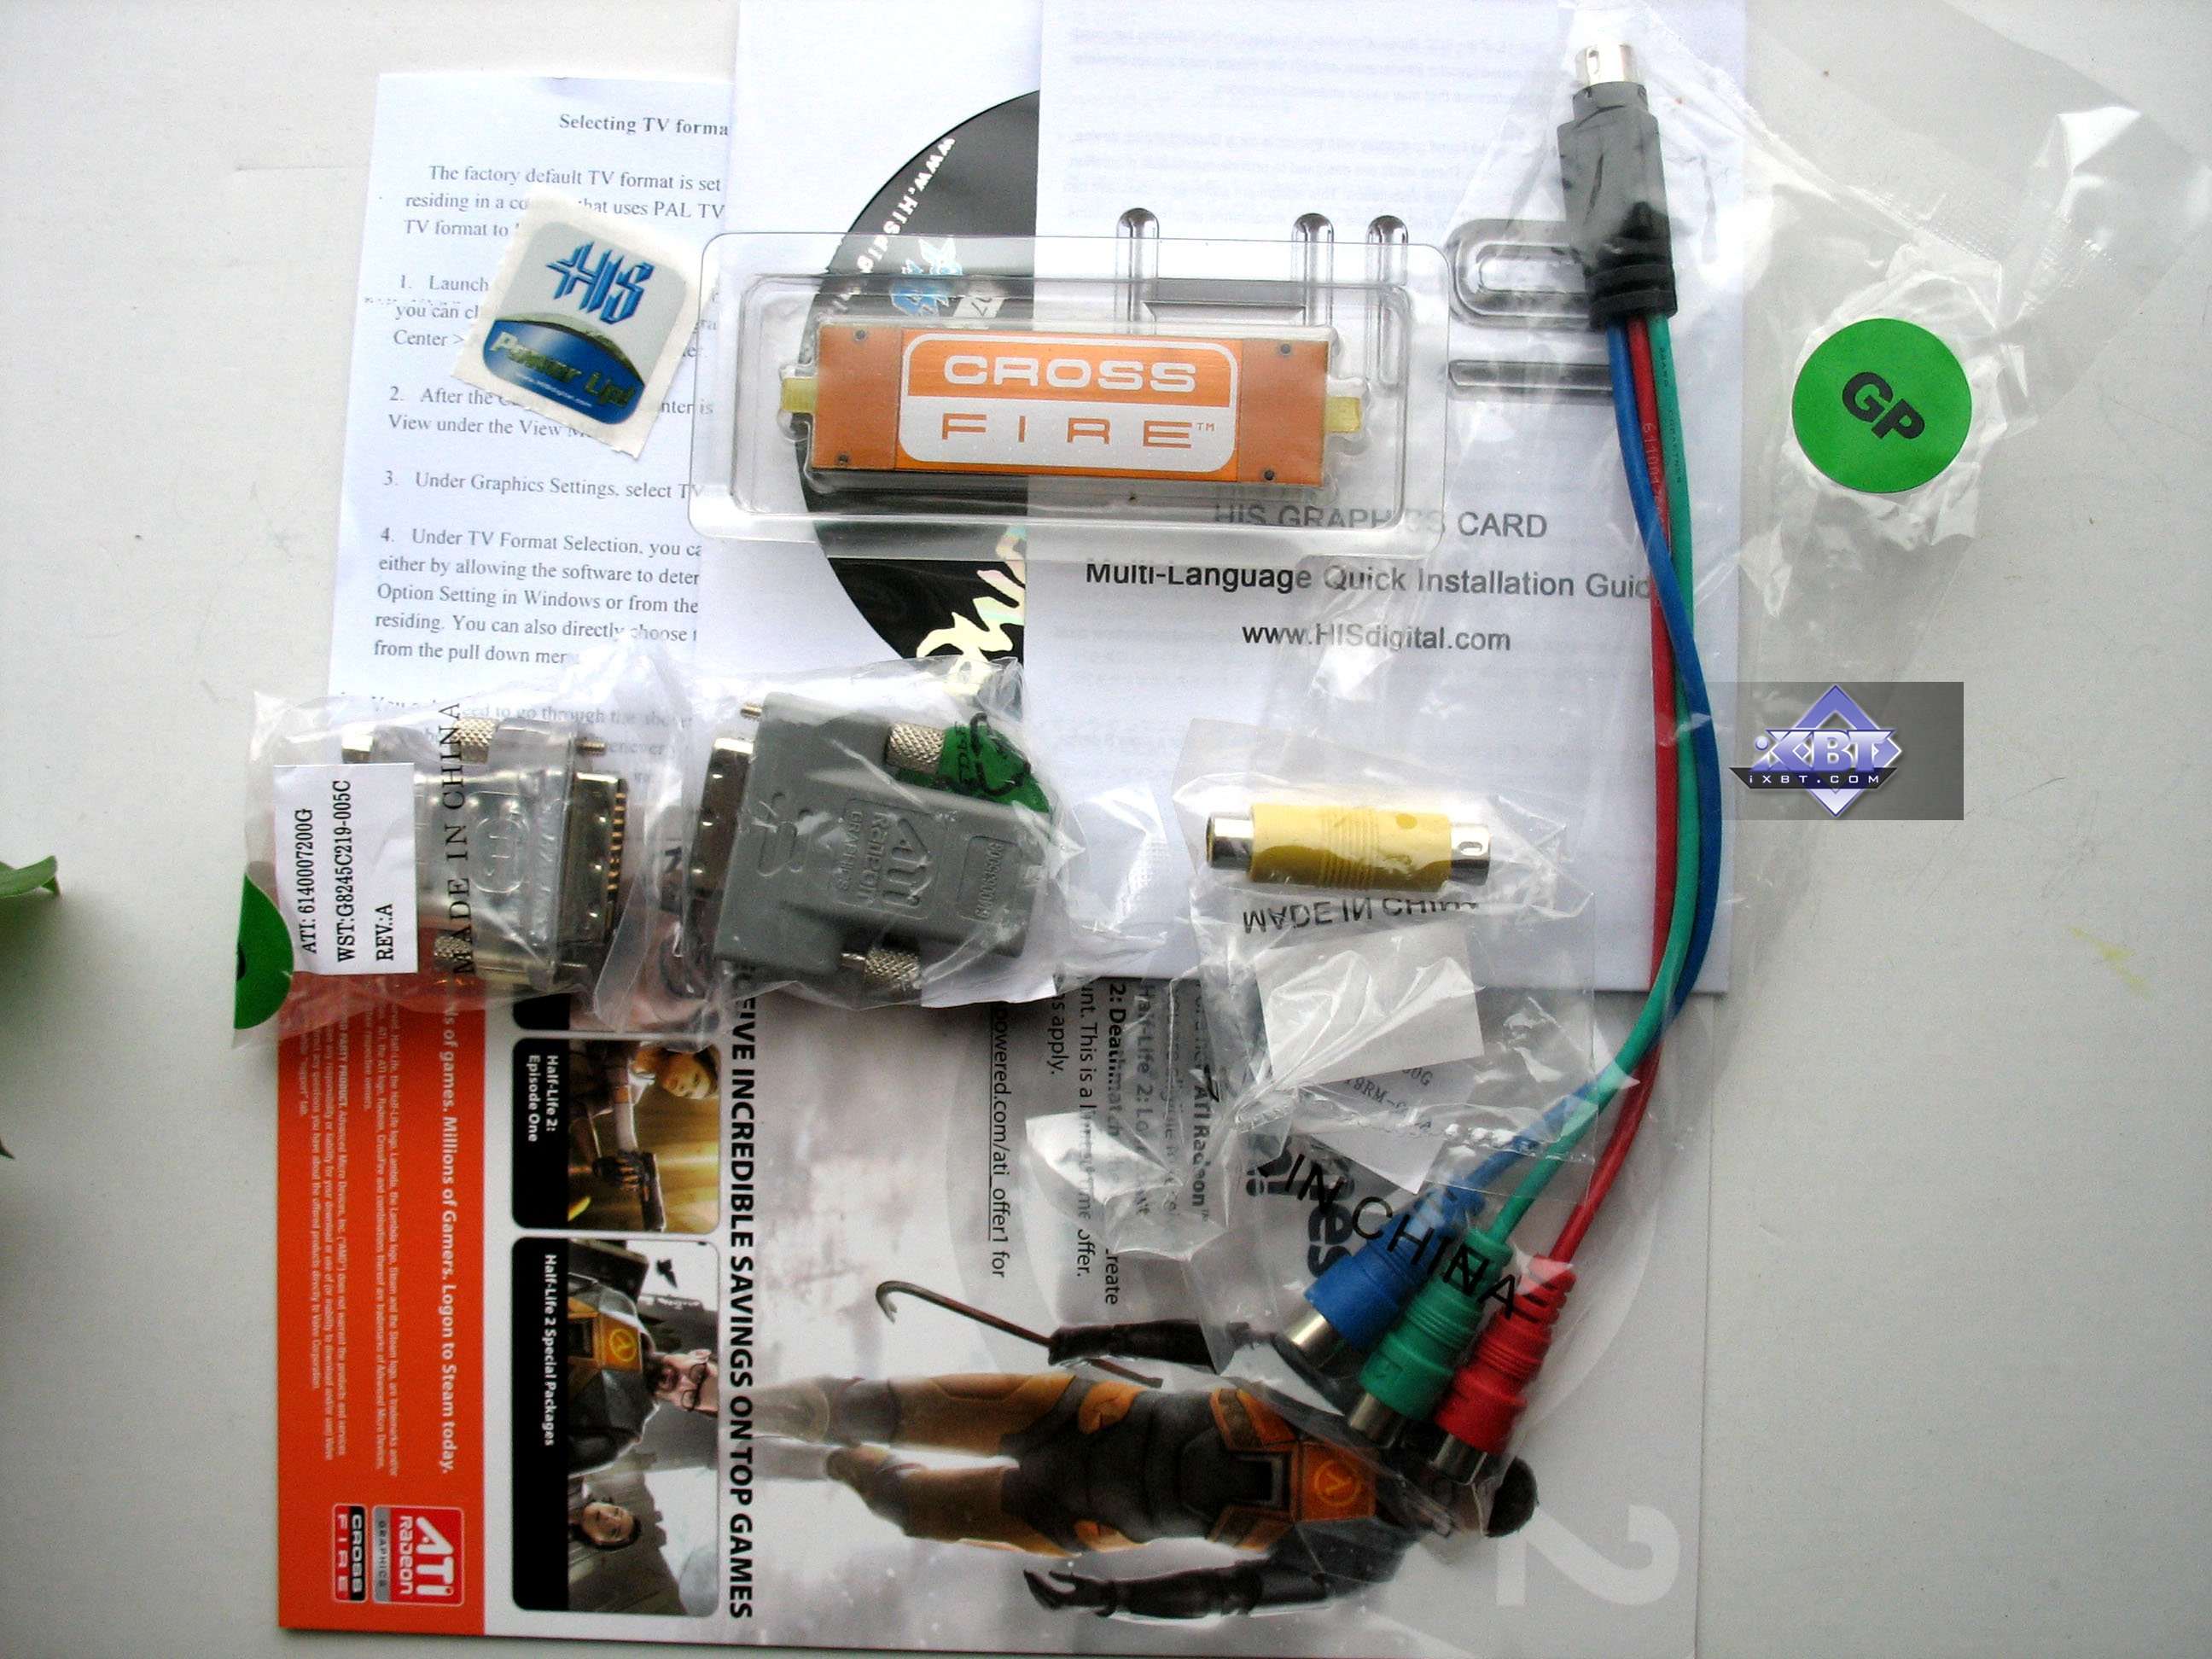
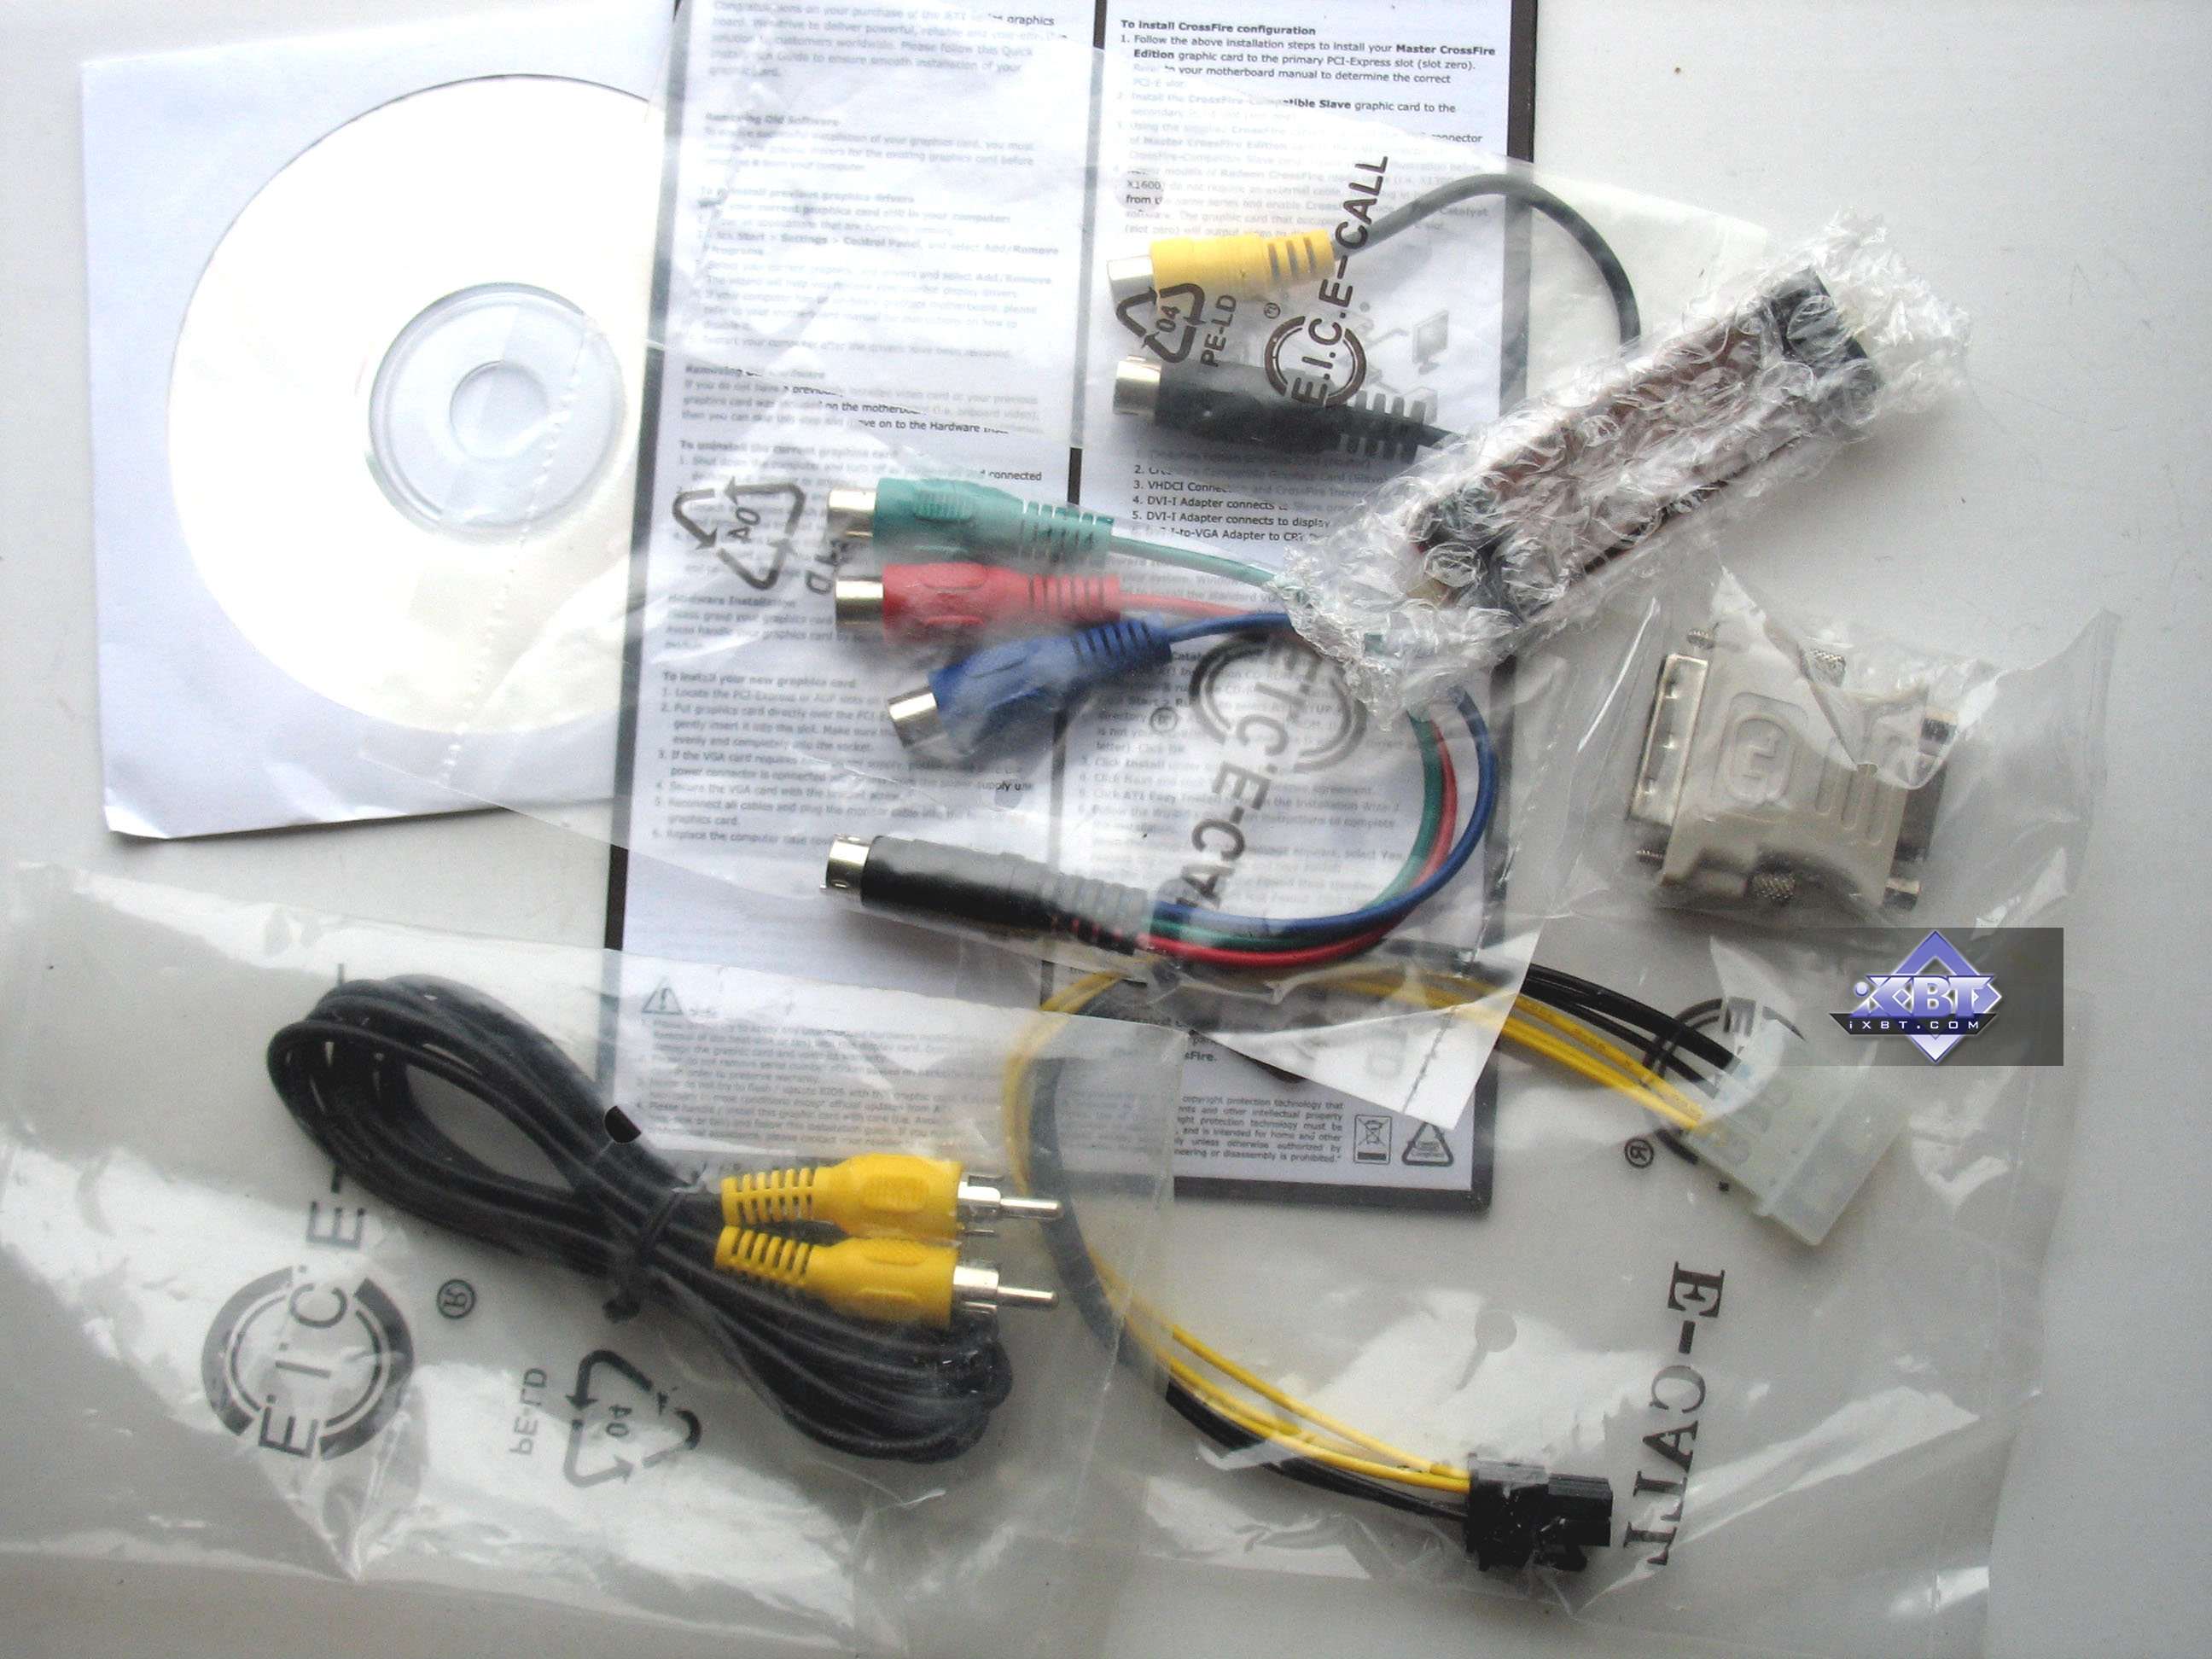
The photos show that each card requires one 6-pin PCI-E cable from a PSU. So you should keep it in mind. PSU requirements: you need a 350-400 W PSU or higher with the 12V channel supporting at least 18-20 A. The cards have TV-Out with a unique jack. You will need a special adapter (usually shipped with a card) to output video to a TV-set via S-Video or RCA. You can read about TV Out here. The cards are equipped with a couple of DVIs. Dual link DVI allows resolutions above 1600x1200 via the digital interface. Analog monitors with d-Sub (VGA) interface are connected with special DVI-to-d-Sub adapters. Maximum resolutions and frequencies:
What concerns MPEG2 playback features (DVD-Video), we analyzed this issue in 2002. Little has changed since that time. CPU load during video playback on modern graphics cards does not exceed 25%. What concerns HDTV and other trendy video features, you can read one of our reviews here.
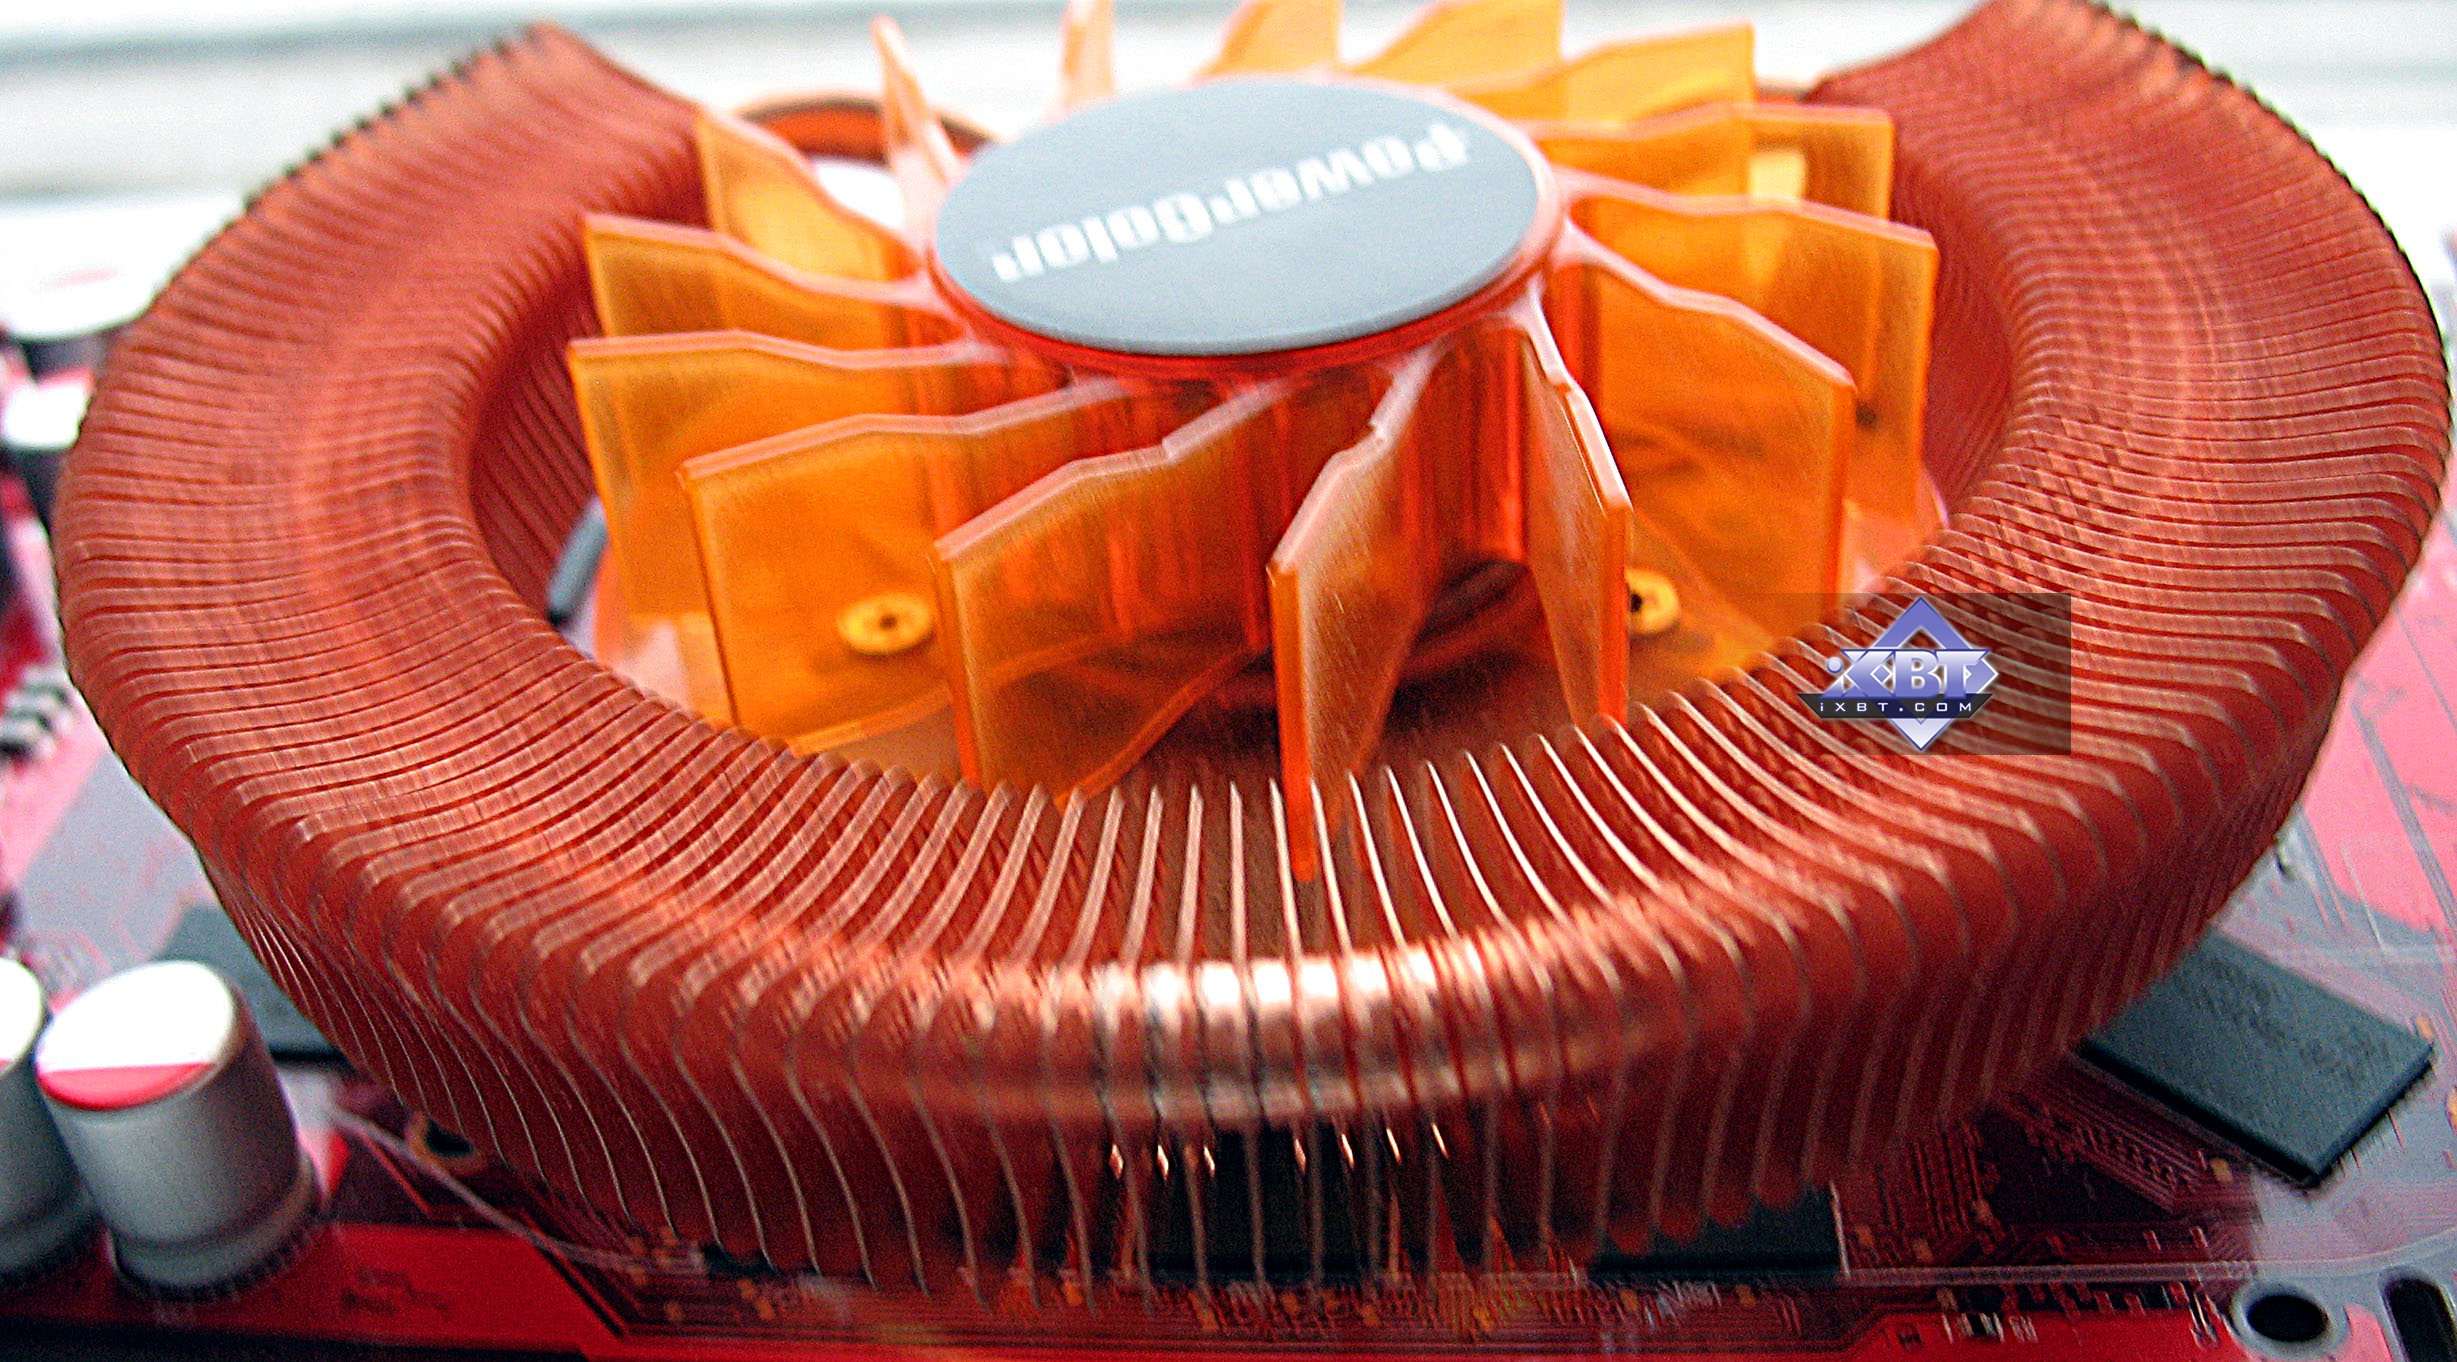
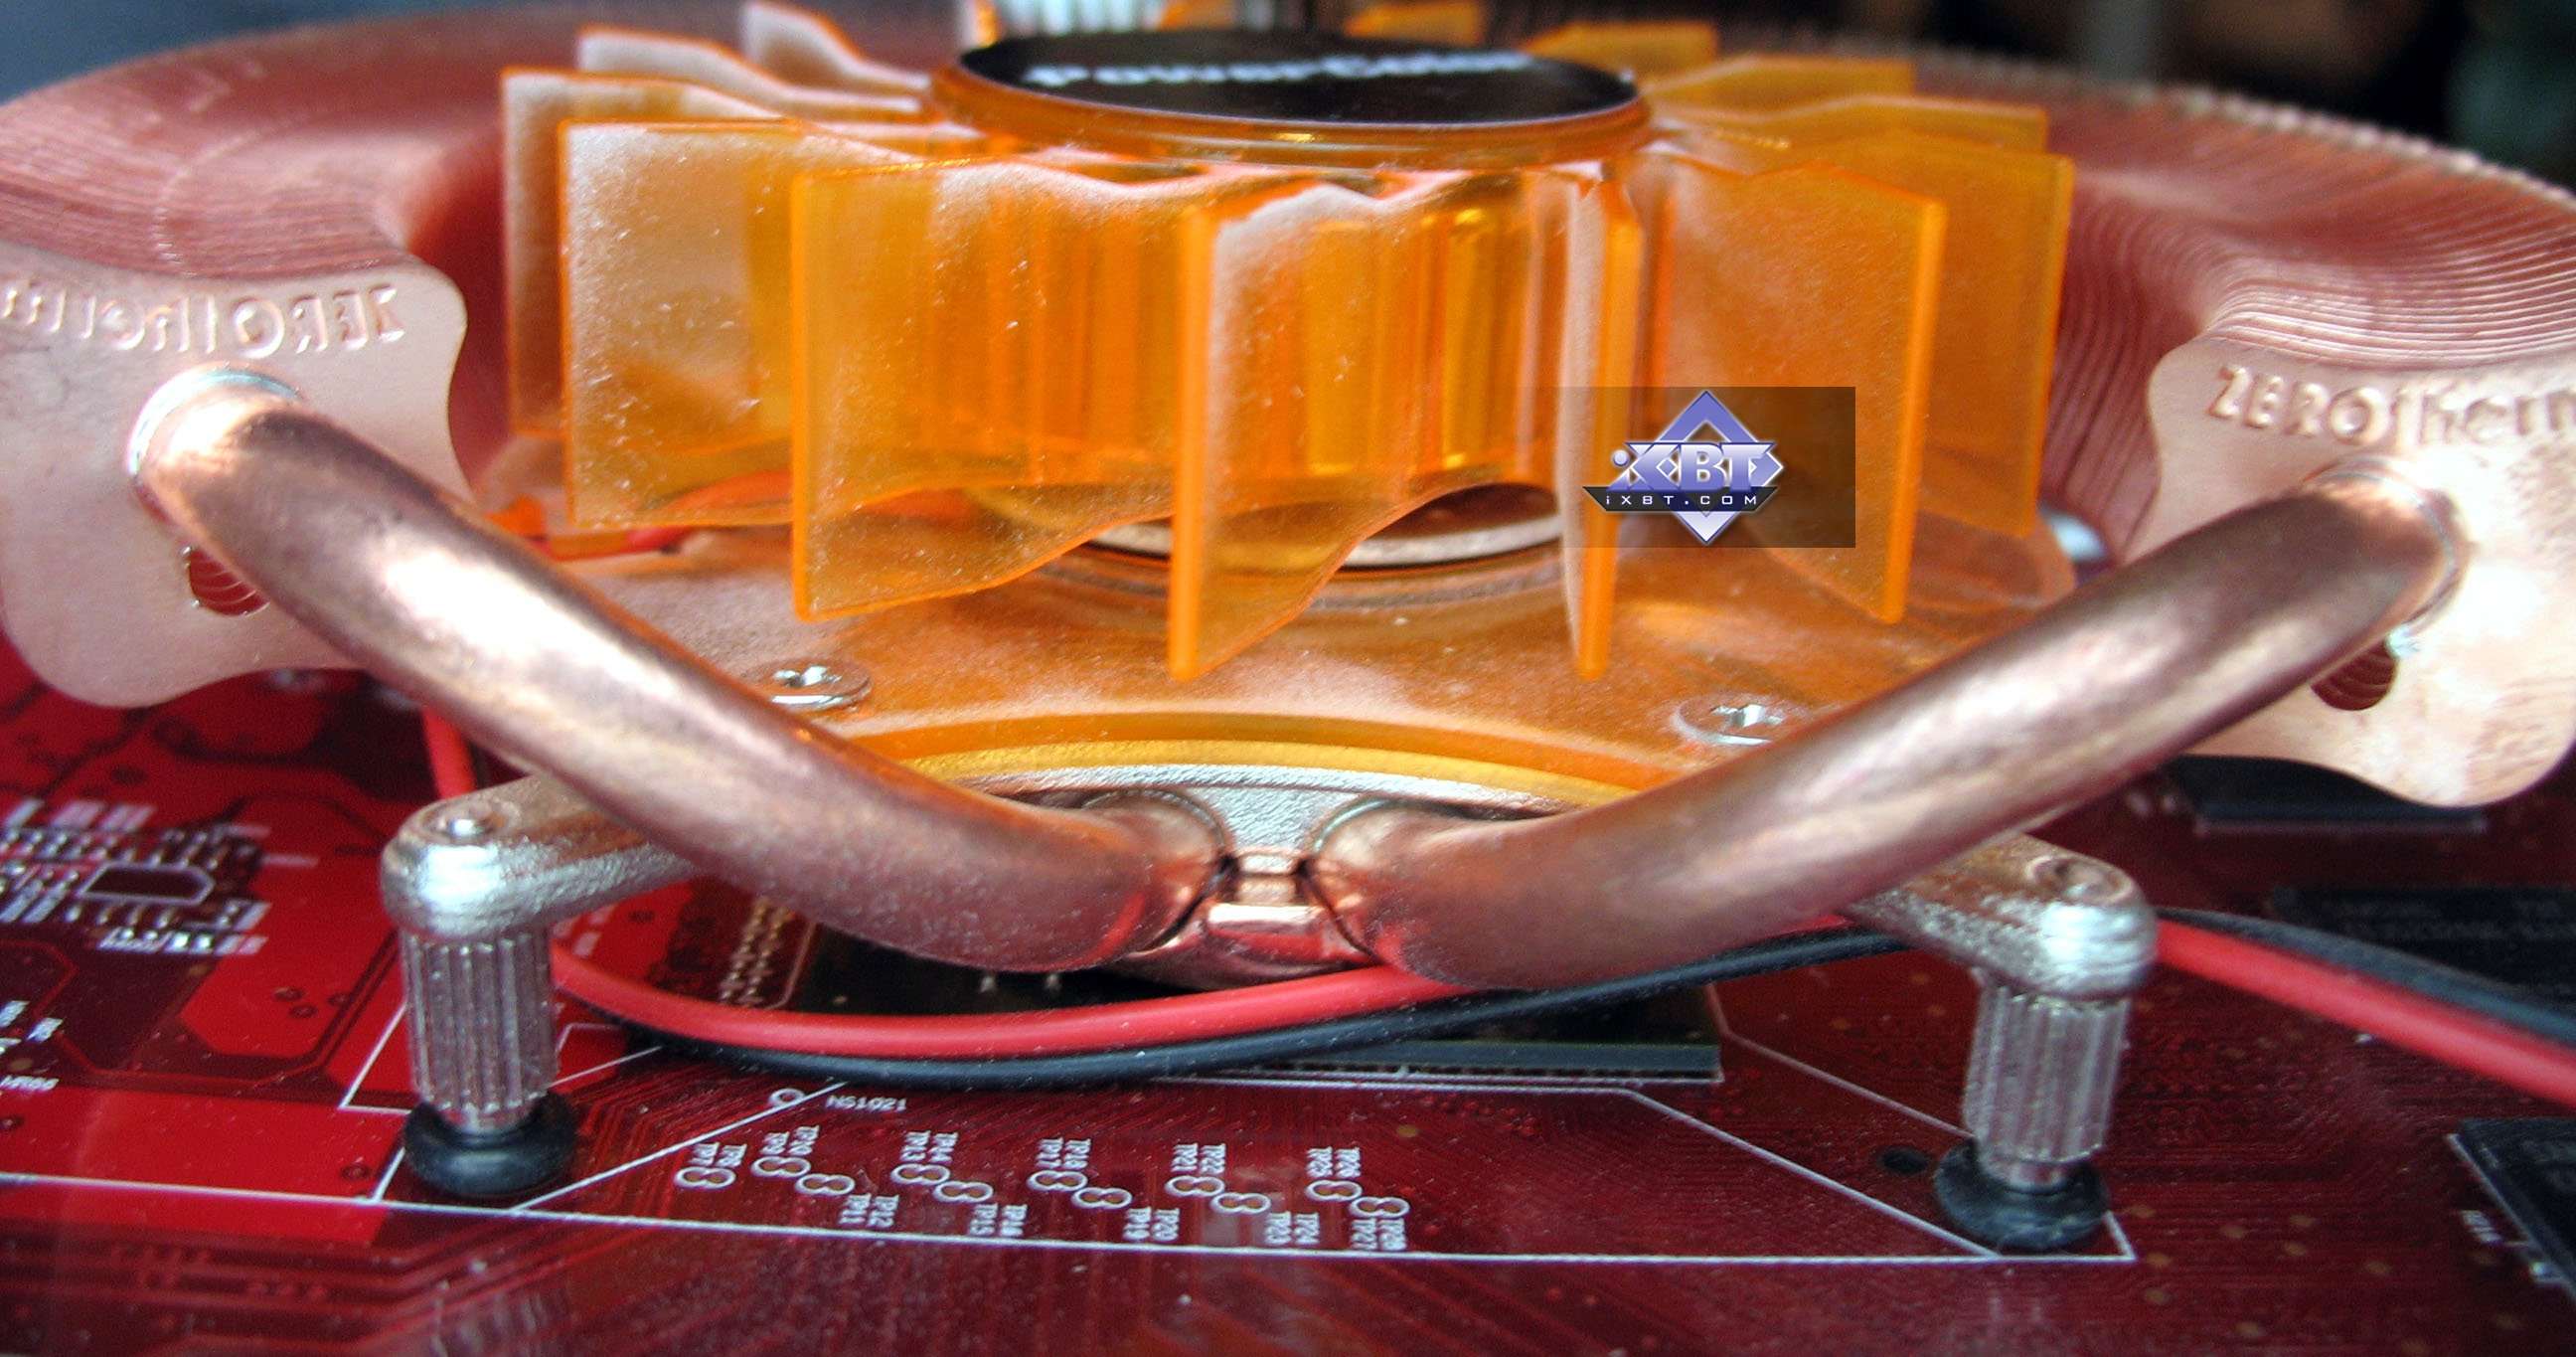
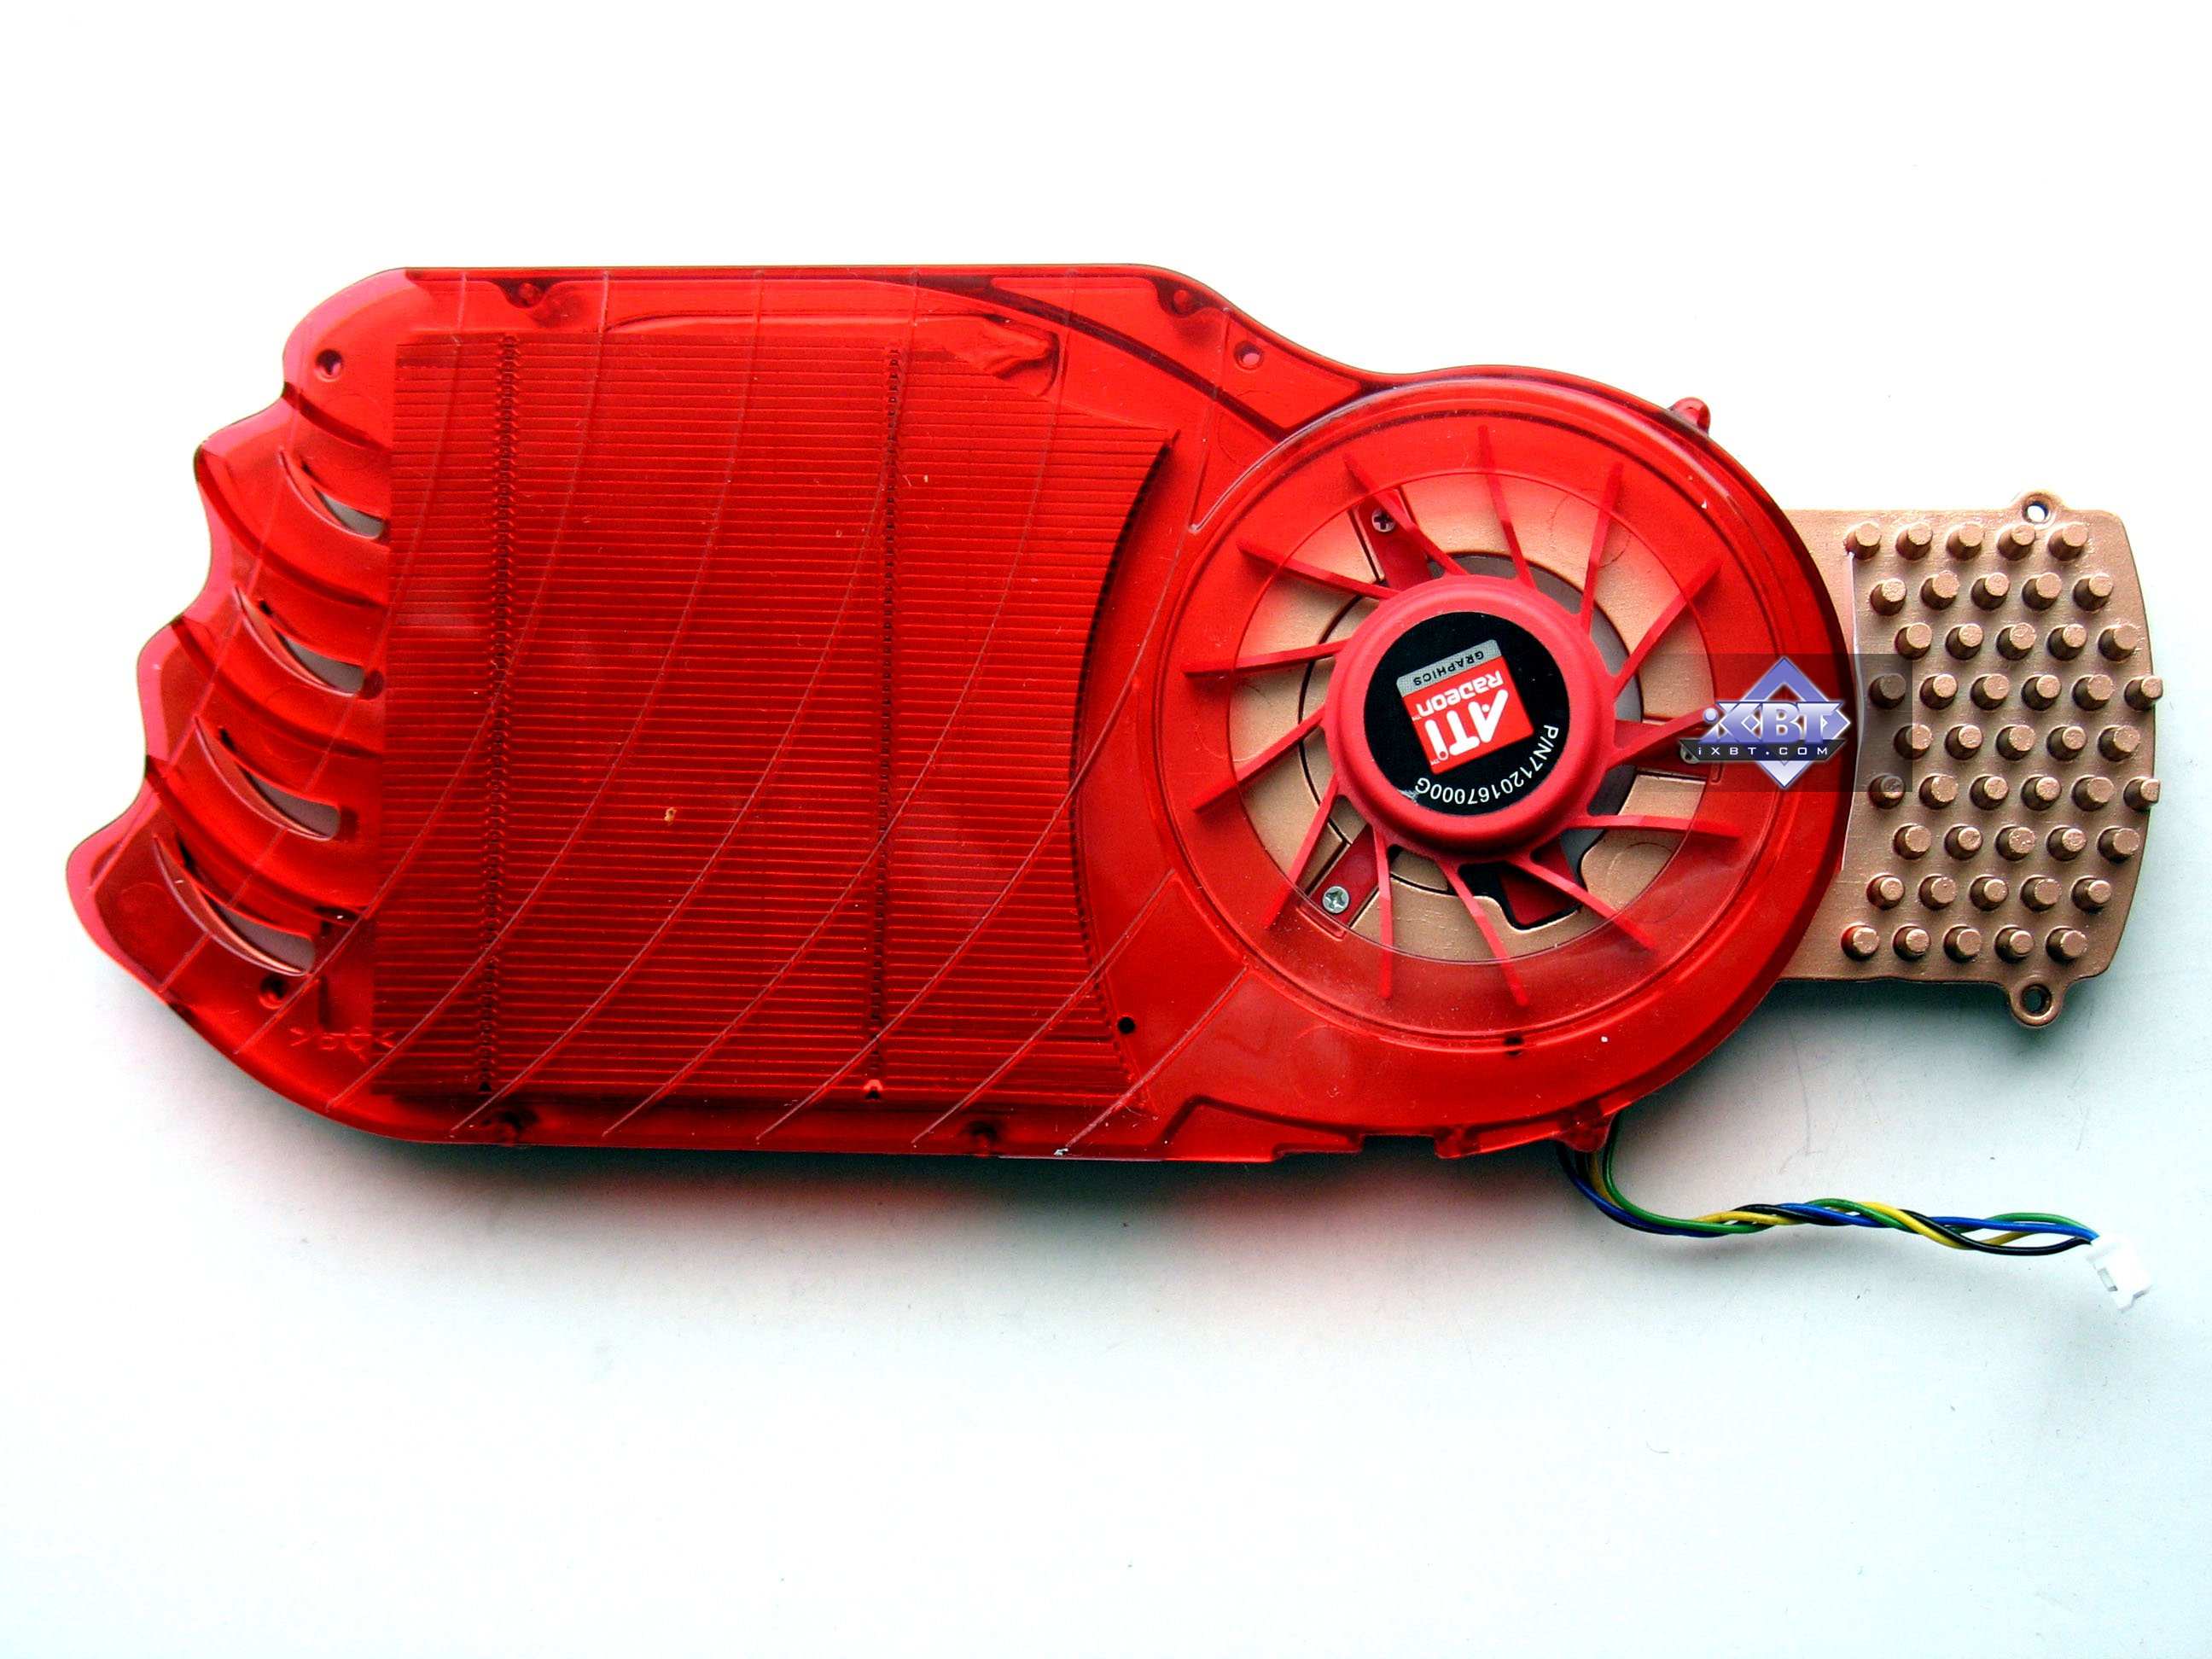
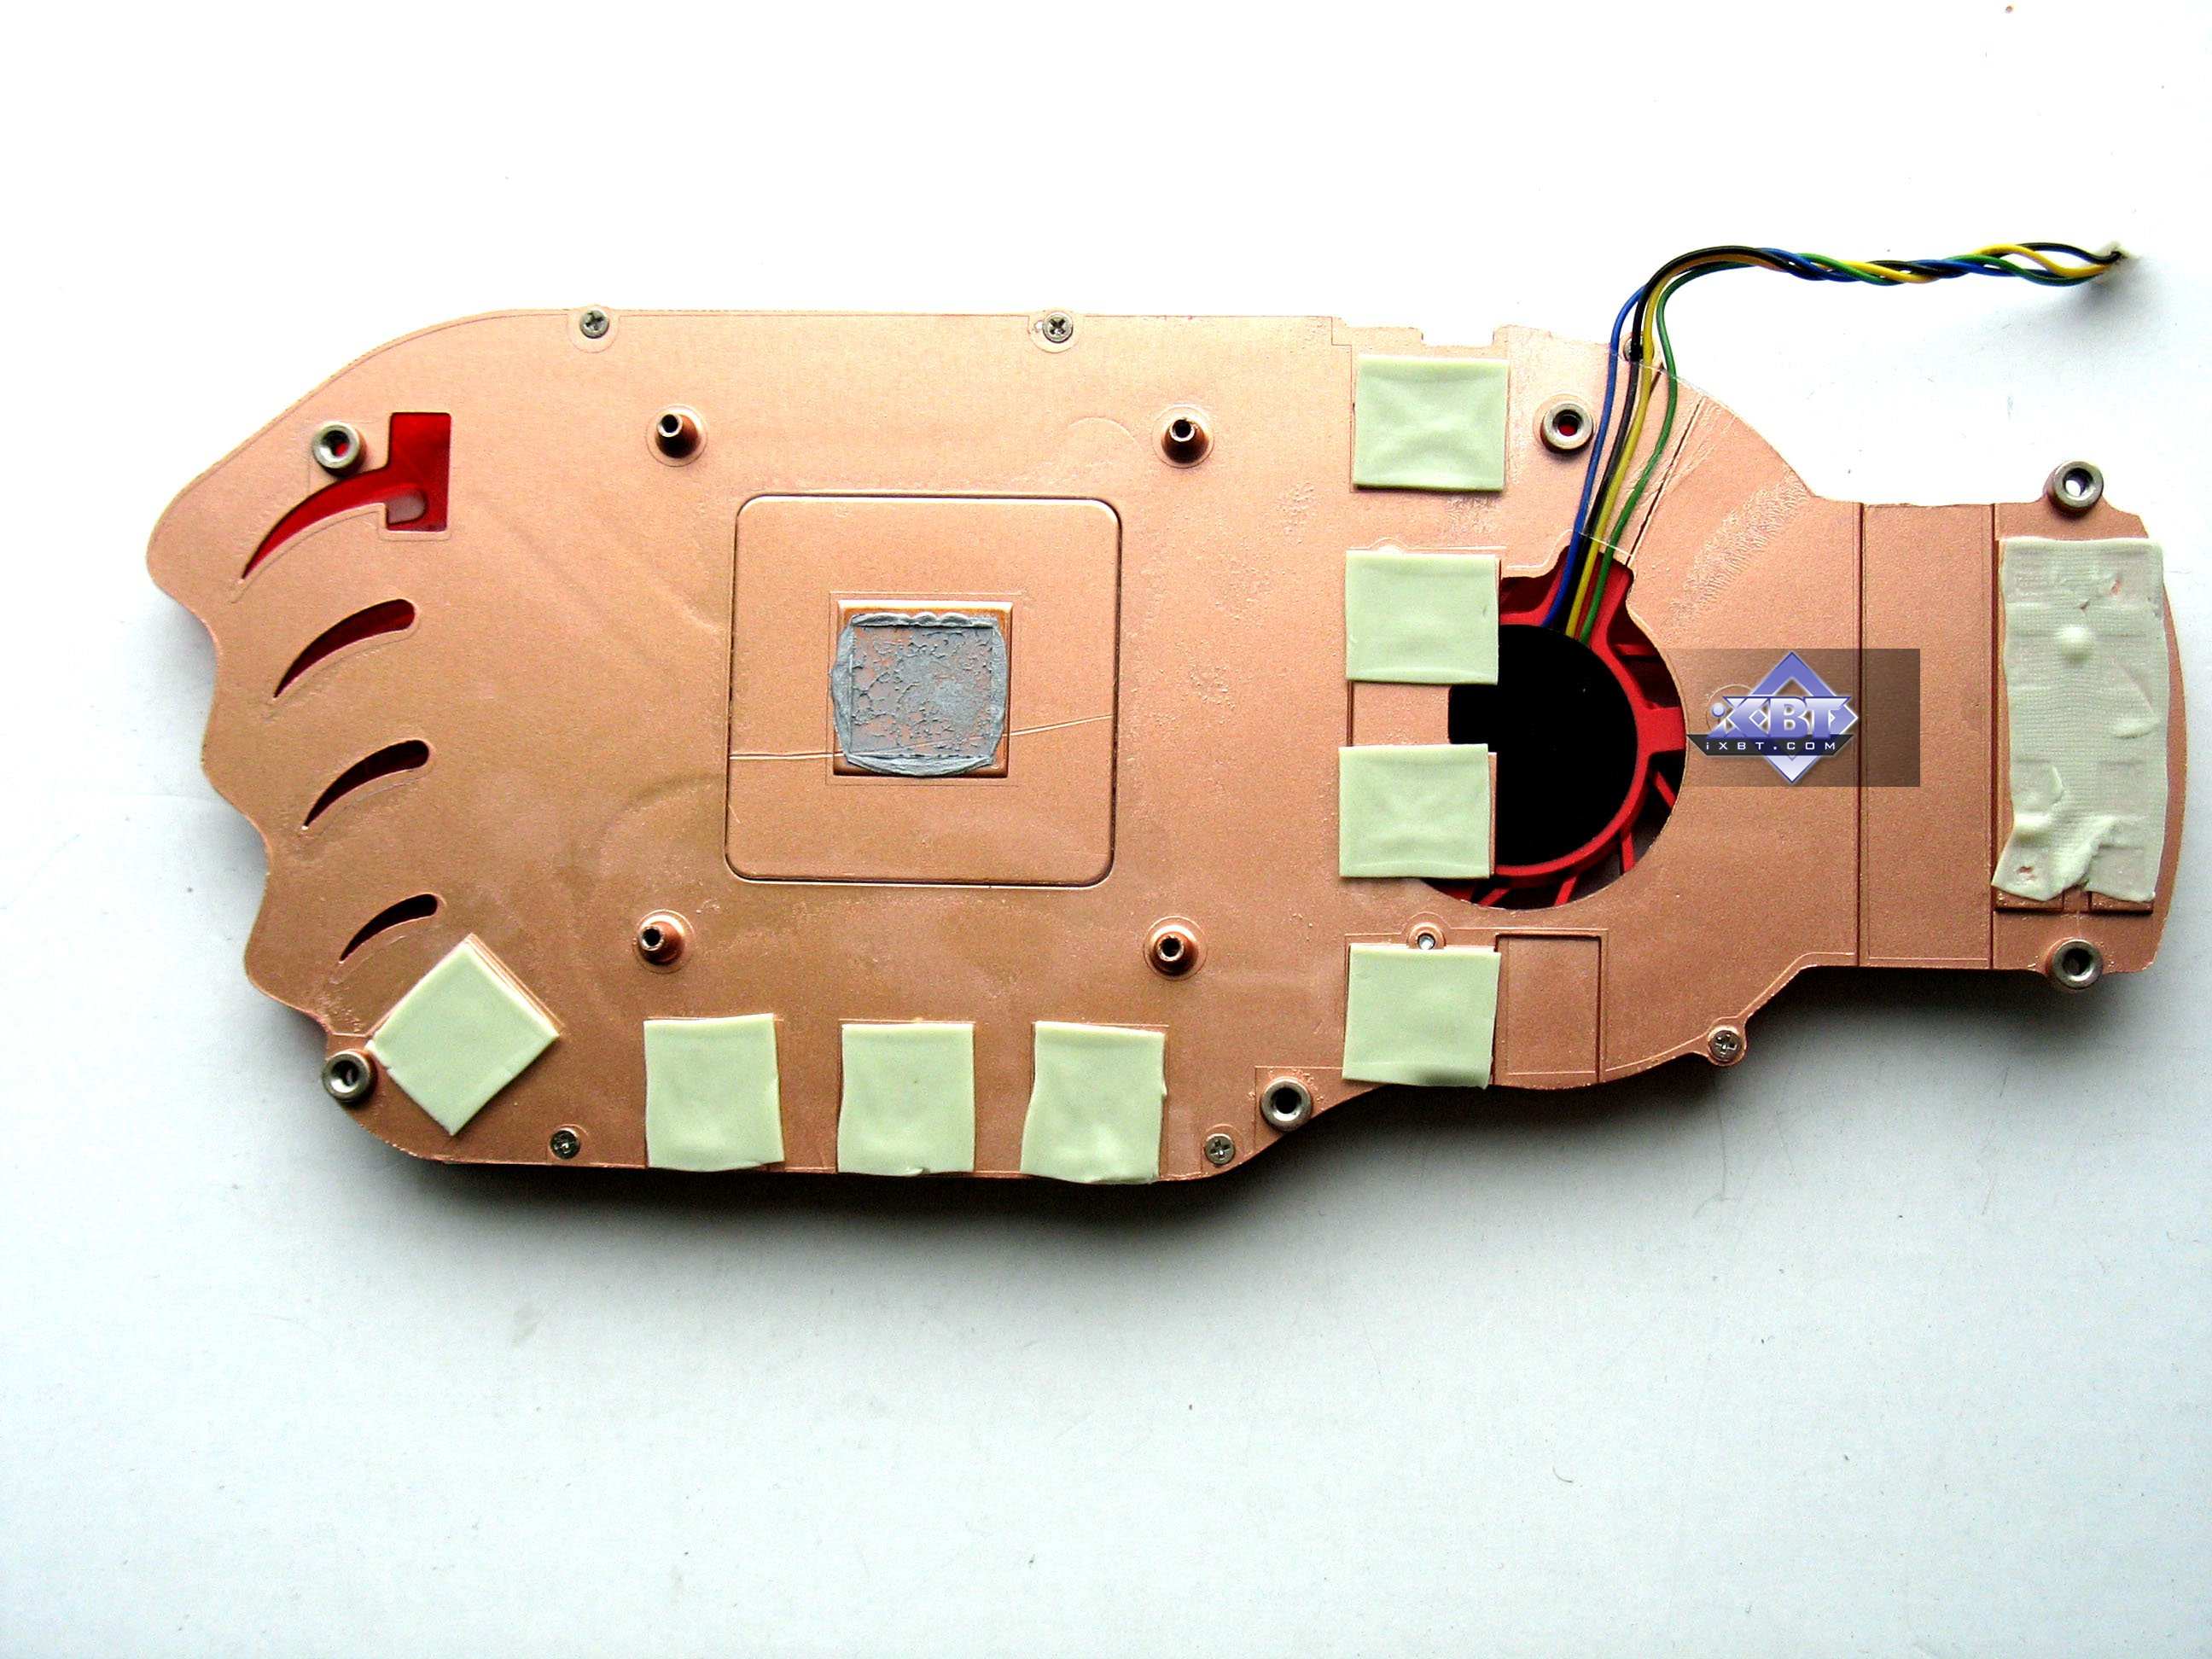
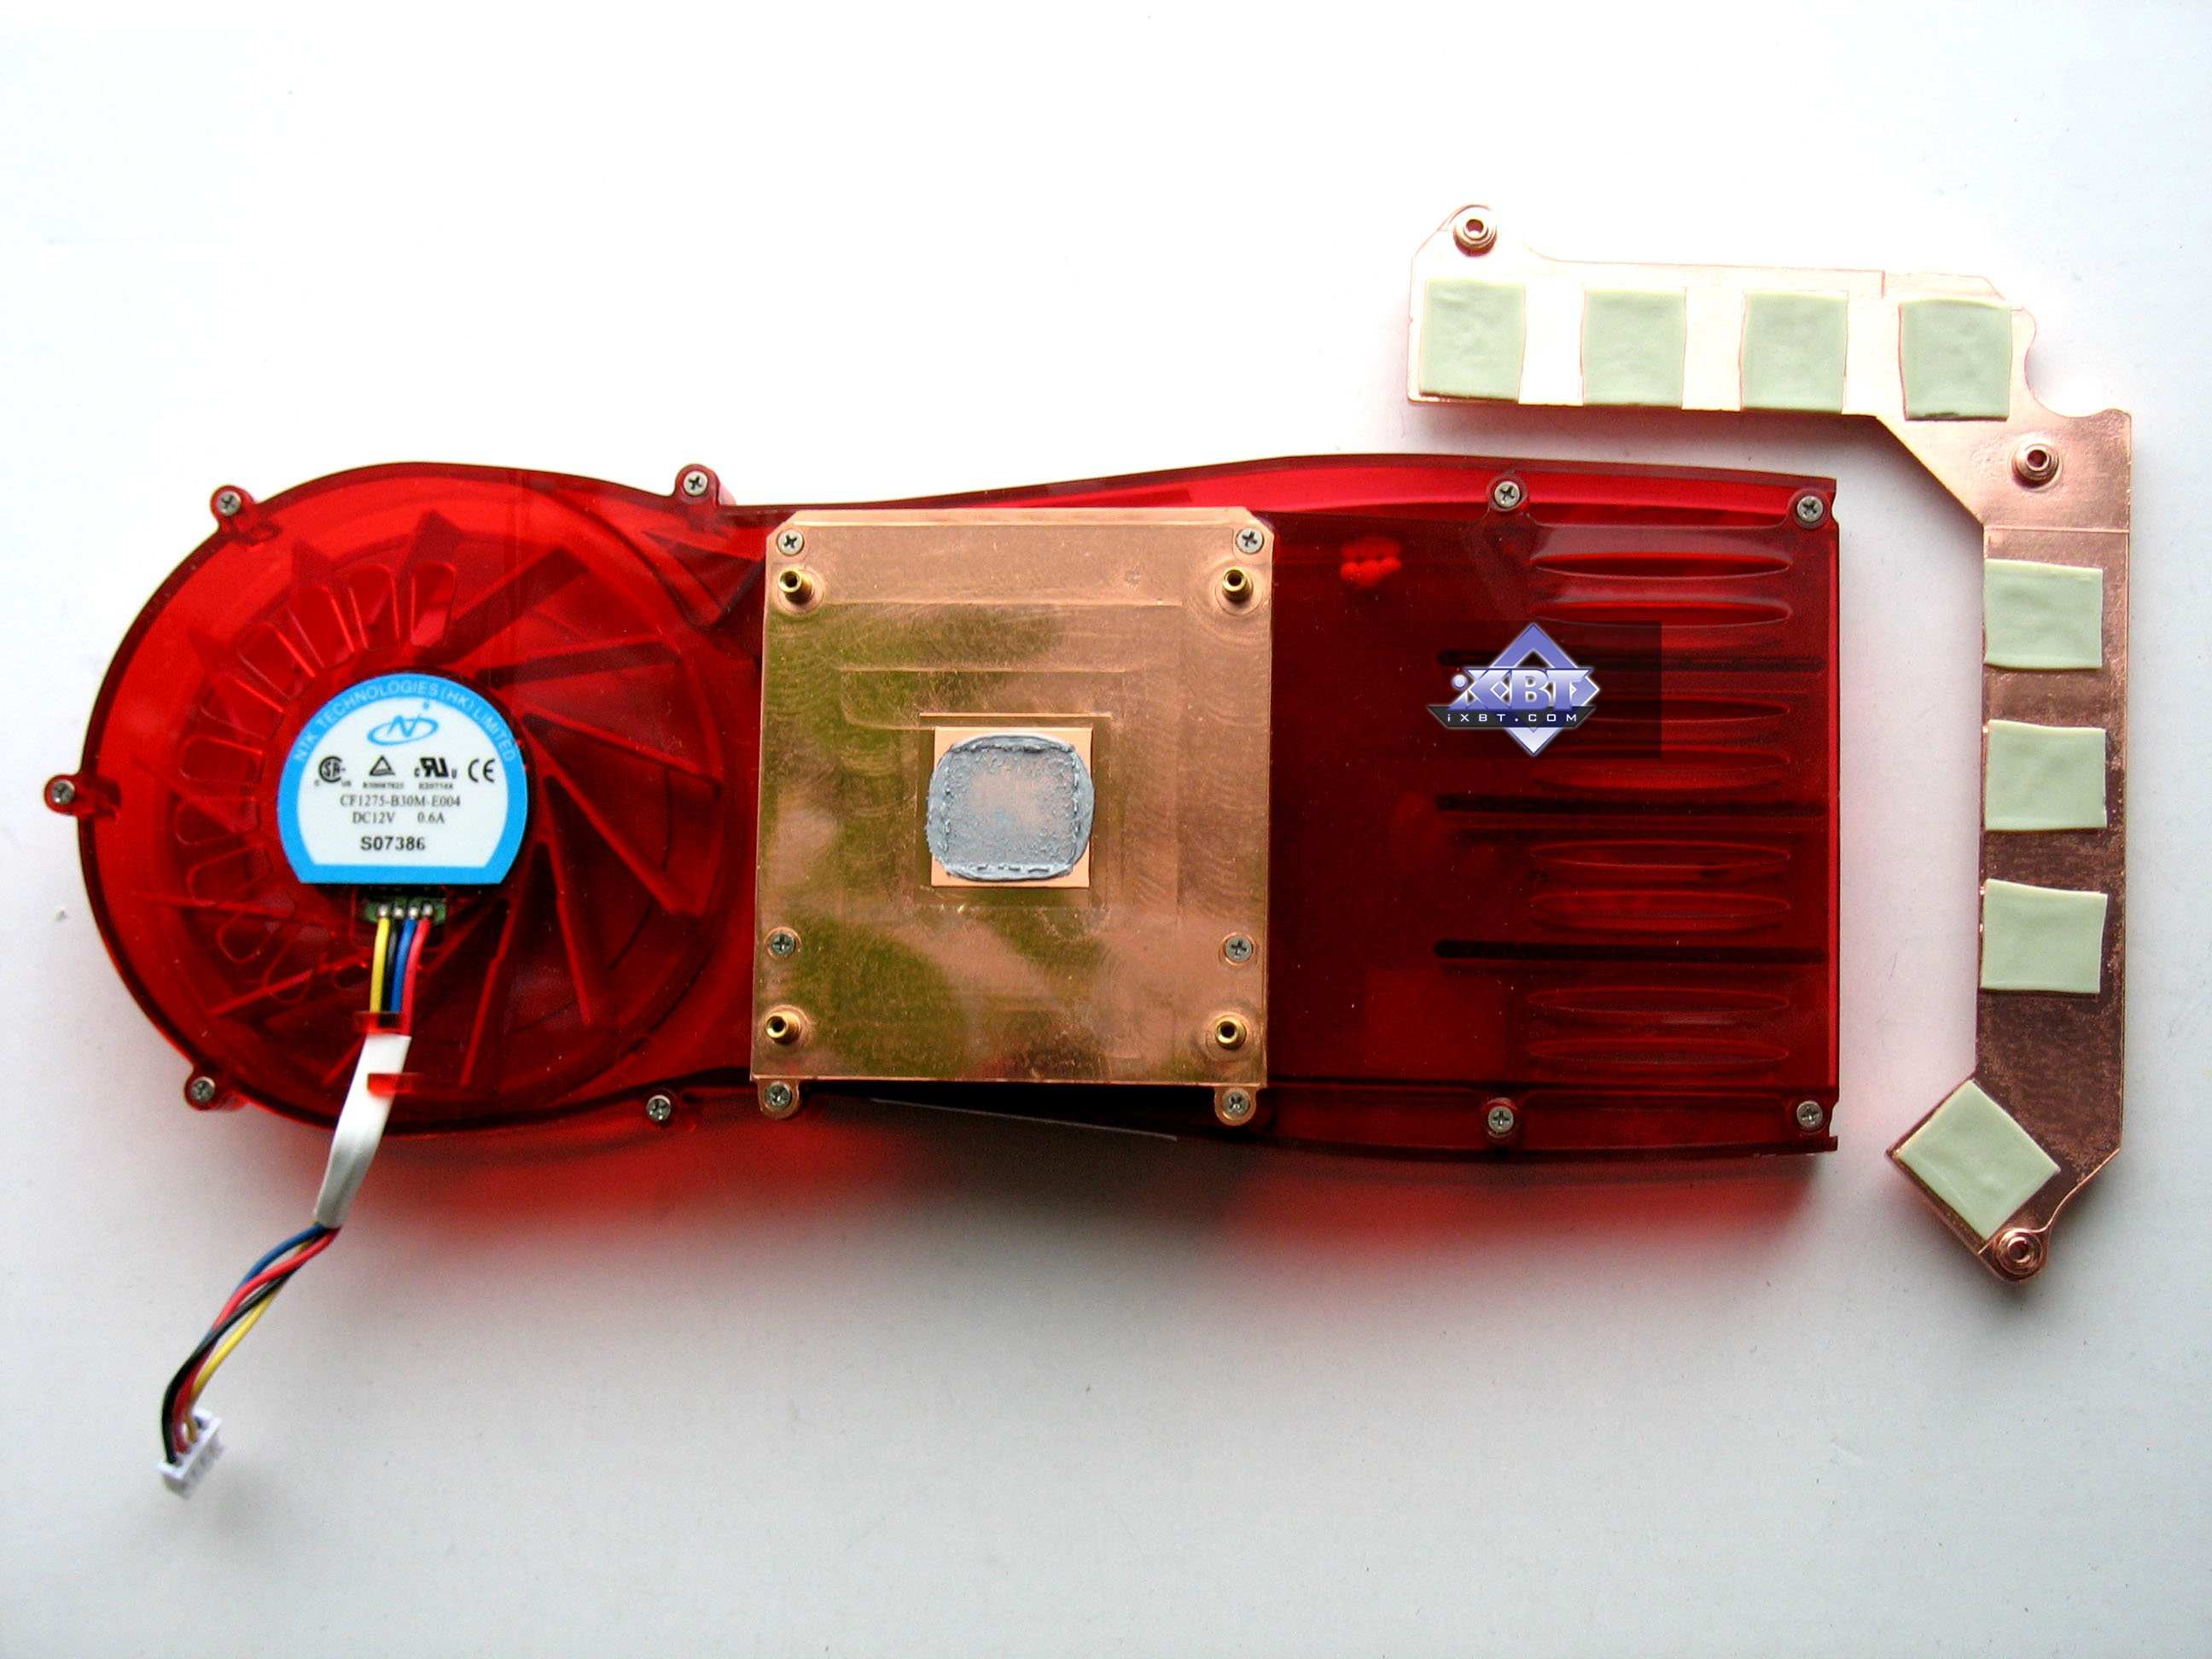
Now about the cooling systems. Let's examine a custom cooler from TUL as well as reference coolers installed in products from HIS/Sapphire.
As the new version of RivaTuner (written by A. Nikolaychuk AKA Unwinder) already supports RADEON HD 3xxx, let's have a look at monitoring results. ATI RADEON HD 3850, default cooler settings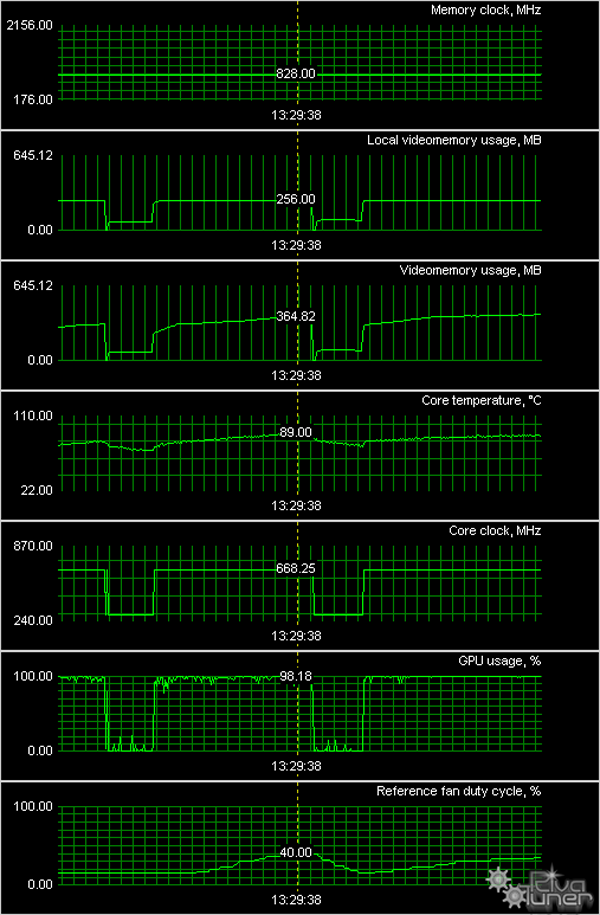 As we have already mentioned, the default fan speed is very low, but the core gets very hot. We've heard that the first 3850 cards were set to higher fan speed (28-30%), and the core temperature did not exceed 70°C. PLEASE NOTE! RivaTuner ALLOWS to adjust fan speed on cards of the reference design. So you are recommended to set fan speed to 30-40% manually. The cooler will remain quiet, but the core temperature will drop to 60°C.
PowerColor RADEON HD 3850, default cooler settings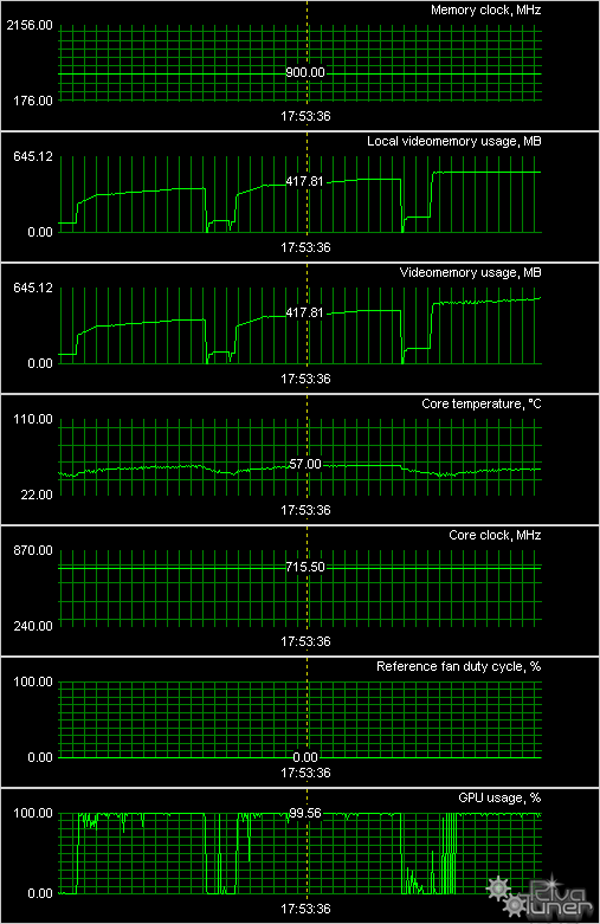 This card is equipped with a special cooler. It's a bit noisy, but its speed cannot be adjusted. The core is cooled very effectively.
ATI RADEON HD 3870, default cooler settings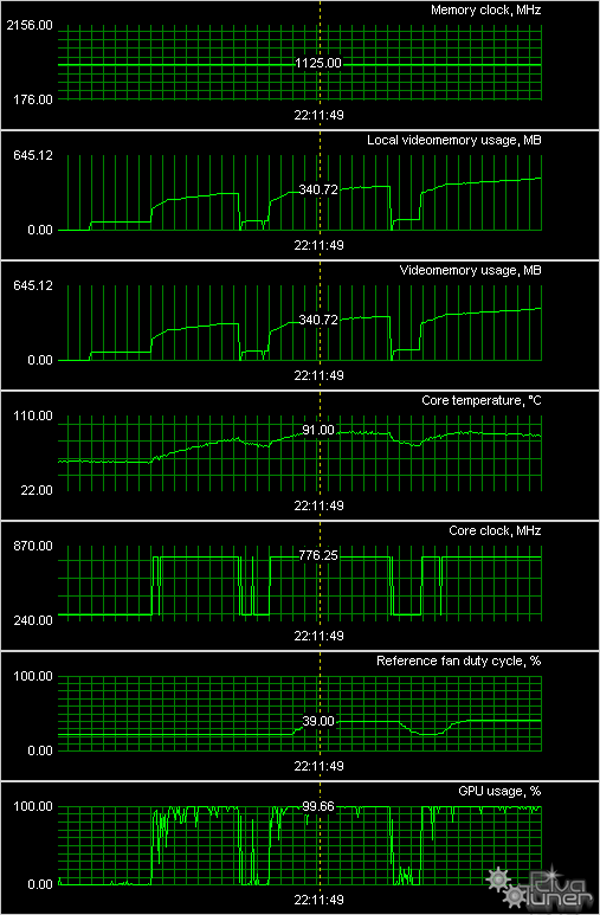 This situation is similar to what the reference 3850 demonstrates. The cooler is very slow, but the temperature is quite high. AMD engineers apparently tried too hard to make the cooler noiseless, and forgot about the temperature.
ATI RADEON HD 3870, 70% fan speed Look what happens if the fan speed is set to 70%, that's the upper threshold beyond which the cooler becomes noisy. The temperature is paltry for this kind of cards!
ATI RADEON HD 3870, overclocked to 825/2400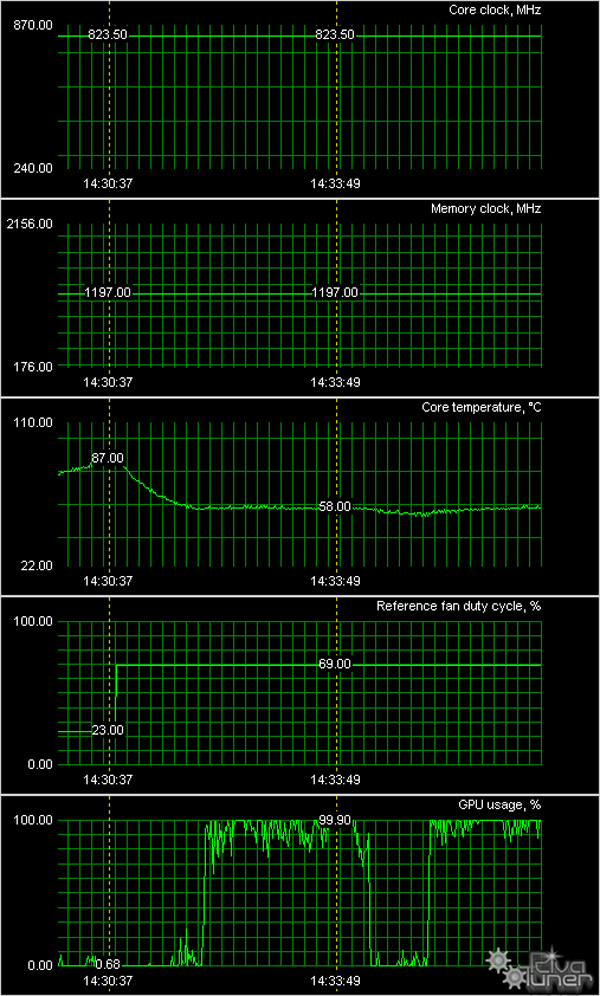 Overclocking results. Bottom line: you can safely set the fan speed to 40-50%, the cooler will still be quiet, but the core temperature will drop. Have a look at the GPUs. RADEON HD 3850 (RV670)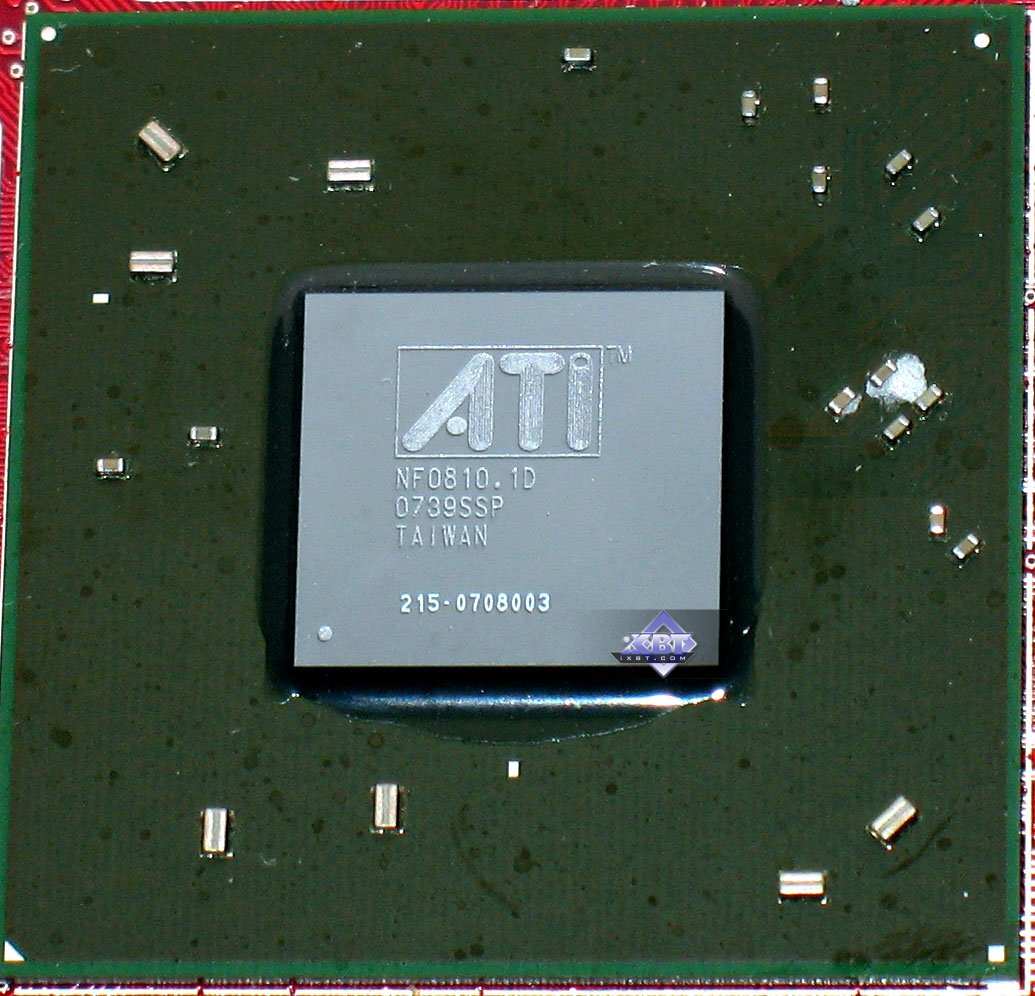 RADEON HD 3870 (RV670) The die is not very big, even though it contains a huge number of transistors (that's what a thin fabrication process can do). AMD has already complicated its designations, there are no comprehensible suffixes anymore, only codes. Bundle
Box
Installation and DriversTestbed configuration:
Synthetic testsIn our base articles we still use old versions of RightMark3D as well as the new version (2.0) for Direct3D 10 graphics cards in MS Windows Vista. Some previously known tests were rewritten for DX10, new types of synthetic tests are added: modified tests of pixel shaders rewritten for SM 4.0, tests of geometry shaders, vertex texture fetch tests. Previous versions of RightMark will also be used until low level fill rate and other tests appear in the new version. All our synthetic benchmarks can be downloaded here:
RightMark3D 2.0 requires MS Visual Studio 2005 runtime and the latest DirectX runtime update. Synthetic tests were run with the following graphics cards:
We've chosen these graphics cards to analyze performance of the new products from AMD for the following reasons: we compare the new cards with the RADEON HD 2600 XT as the former top Mid-End solution; the old GeForce 8800 GTS will just make the comparison more interesting; the GeForce 8800 GT is the main competitor to the RADEON HD 3870; and the RADEON HD 2900 XT interests us here, because the R600 was used as a basis for the new Mid-End GPU, only its frequencies and memory bandwidth are different. Direct3D 9: Pixel Filling tests This test determines peak texel rate in FFP mode for different numbers of textures applied to a pixel:  Most graphics cards from AMD demonstrate results that are close to their theoretical maximum, just a tad lower. As usual, results of synthetic tests do not reach theoretical values in modes with many textures. Texture fetch rates of the HD 3870 and the HD 3850 match those of the HD 2900 XT adjusted for the frequencies. The graphics card from NVIDIA, notable for high texturing speed owing to its improved TMUs, fails to demonstrate maximum results. In case of few textures per pixel, the HD 3870 and the 3850 compete with the GeForce 8800 GT, because the latter has insufficient memory bandwidth - it's lower than in the RV670 card. But in heavier conditions, AMD graphics cards slow down compared to the main competitor, proving full identity of texture units and their relation to the R6xx architecture. Let's have a look at the fill rate test: 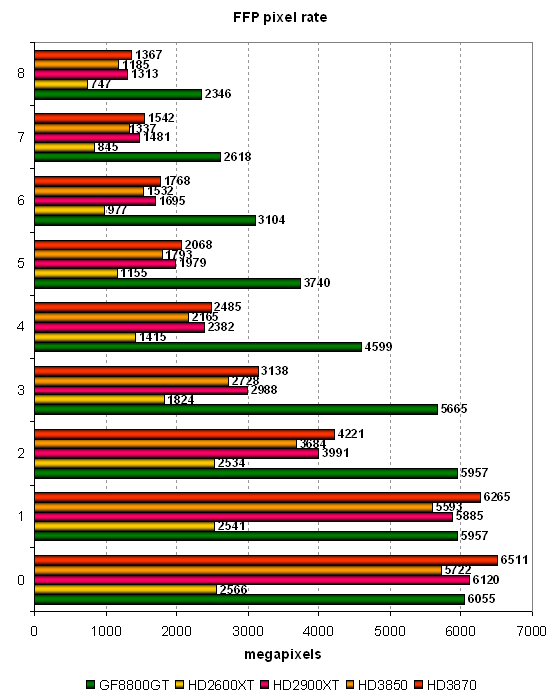 The second synthetic test measures the fill rate. It shows the same situation adjusted for the number of pixels written into the frame buffer. In case of 0 and 1 textures, the new Mid-End solution from NVIDIA is outperformed by one of the AMD solutions. However, it's much stronger in case of many textures per pixel. As we assumed in the previous article, RV670-based graphics cards are outperformed by G92-based cards in texel and fill rates, when performance is not limited by memory bandwidth. Theoretical difference is even more noticeable. Direct3D 9: Geometry Processing Speed Tests Let's analyze extreme geometry tests. The first test uses the simplest vertex shader that shows maximum triangle throughput: 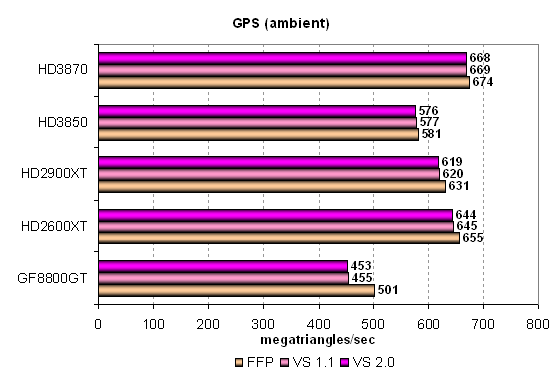 As all the GPUs are based on unified architectures, all unified processors in this test are busy with geometry processing. So all solutions demonstrate high results, which are evidently not limited by peak performance of unified processors, but by performance of other units, for example, triangle setup. Test execution efficiency of various GPUs in various modes is approximately the same, peak performance in FFP, VS 1.1 and VS 2.0 modes is little different. Even these results show that the AMD solutions process geometry faster than NVIDIA GPUs. Performance of the RV670 matches that of the R600 adjusted for different frequencies. The RV630 is so strong probably owing to its higher clock rate. Let's see what will change in a more complex test with a single diffuse light source: 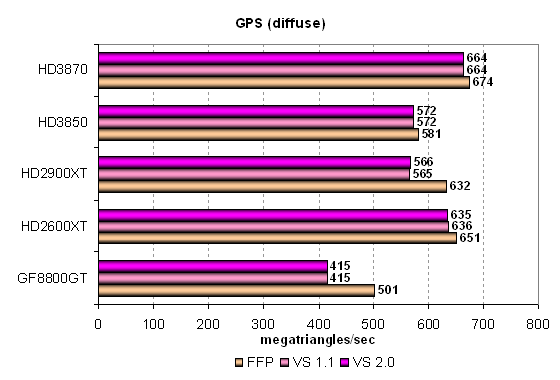 The situation did not change much, AMD solutions have an apparently higher potential. The GeForce 8800 GT lags further behind all AMD cards, including even the RADEON HD 2600 XT. The HD 3850 catches up with the HD 2900 XT. This time the FFP mode is a tad faster on two graphics cards: the GeForce 8800 and the HD 2900. Let's see what will happen in heavier conditions - complex lighting with a single light source and glares: 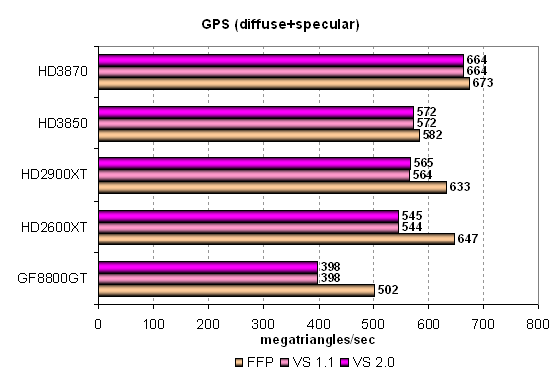 It's a similar situation. The apparent leader in geometry performance is a faster card based on the RV670. It's clear already that it succeeds not only owing to its clock rate. Something must be changed in the RV670, so it demonstrates better results in synthetic geometry tests than the R600. This assumption is backed up by the fact that optimized FFP emulation appears with a mixed light source on most tested cards, except for the HD 3850 and the 3870. This time the GeForce 8800 GT is outperformed as much as in the previous case. Let's analyze the most complex geometry task with three light sources, including static and dynamic branches:  Here we can see differences between all contenders, these tests illustrate geometry performance well. Both new Mid-End solutions including the RADEON HD 2900 XT shoot forward. Perhaps, their potential is not revealed fully even in our most complex geometry task. The HD 3850 and the HD 3870 act exactly like the HD 2900 XT. We are only surprised that the lower-clocked HD 3850 performs on a par with the HD 2900 XT. Perhaps, the reasons for this behavior may be in new architectural optimizations, larger caches, etc. In other cases, when shader units act as the main bottleneck, results of the cards line up in compliance with theoretical values. The RADEON HD 3870 is faster than its competitors, its results look especially good compared to the older Mid-End solution from AMD - the HD 2600 XT. A brief conclusion on geometry tests: as the new GPUs are based on the good unified architecture R6xx, they perform great in geometry tests. They can use all unified stream processors to solve geometry tasks, and they are optimized for geometry processing. These solutions can even outperform the RADEON HD 2900 XT from time to time. However, unified processors will be busy mostly with pixels in real applications. We proceed to such tests now. Direct3D 9: Pixel Shaders TestsThe first group of pixel shaders to be reviewed here is too simple for modern GPUs. It includes various versions of pixel programs of relatively low complexity: 1.1, 1.4, and 2.0.  We can see that the tests are too easy for modern architectures and fail to reveal their true capacity. In simple tests performance is limited by texture lookups and fill rate. You can see it in weak results of all AMD cards compared to the GeForce 8800 GT. They shouldn't have limited the number of TMUs to 16... However, results become more interesting in more complex PS 2.0 tests. For example, the GeForce 8800 GT is outperformed by all cards based on the RV670 and the R600 in the most complex test (Phong with three light sources). Results of the HD 3850 and the HD 3870 agree well with what the HD 2900 XT demonstrates (adjusted for frequencies). Both new graphics cards are naturally much faster than the RADEON HD 2600 XT. The older Mid-End solution is heavily outperformed in all tests, demonstrating more than twice as low results. It can be explained by a higher fill and texel rates as well as the increased number of unified shader units in the RV670. Let's have a look at results in more complex pixel programs of intermediate versions: 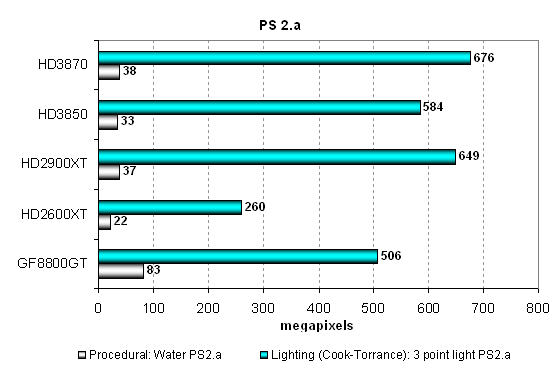 The procedural water test depends much on texturing speed. It uses dependent texture lookups of high nesting depth, so all AMD cards are indecently slower than the only representative of NVIDIA. The GeForce 8800 GT is far ahead, it's more than twice as fast as both cards based on the RV670. The HD 3850 and the HD 3870 perform on a par with the HD 2900 XT, and the HD 2600 XT is a traditional outsider. Previous Mid-End solutions were too weak. In the second arithmetic-intensive test, the new cards from AMD shoot forward, and the GeForce 8800 GT is slightly outperformed. This task fits the AMD architecture with more unified processors. The relation between results of the HD 3850, the HD 3870, and the HD 2900 is conditioned by the differences in GPU clock rates, it matches theoretical values. Direct3D 9: New Pixel Shaders TestsThese tests of DirectX 9 pixel shaders are even more complex, they are divided into two categories. We'll start with easier shaders - SM 2.0:
There are two modifications of these shaders: arithmetic intensive and texture sampling intensive. Let's analyze arithmetic-intensive modifications, they are more promising from the point of view of future applications: 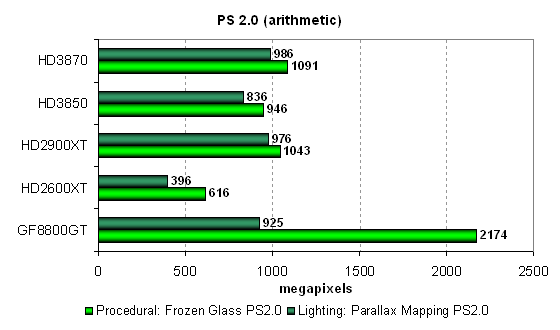 An apparent leader of the Frozen Glass test is the NVIDIA card. The GeForce 8800 GT is twice as fast as its competitors (the HD 2900 and the HD 3870), which indicates that performance is limited by the texel rate in the first place. AMD cards lead in the second Parallax Mapping test. They line up exactly as they theoretically should, but the GeForce 8800 GT is outperformed only a little, considering that NVIDIA had always been much weaker in this test. There are no unexpected results here, the RV670 performs just like the R600 in these tests. Let's analyze results obtained in the texture sampling intensive tests, where the GeForce 8800 GT should perform even better:  Indeed, the situation has changed. Performance is even more limited by the speed of texture units, so the GeForce 8800 GT is always faster. The RADEON HD 2900 XT, the HD 3850, and the HD 3870 demonstrate close results, being noticeably slower than the GeForce 8800 GT and just as faster as the HD 2600 XT. However, arithmetic-intensive shaders work faster on all graphics cards. Texturing-intensive shaders make no sense for modern GPU architectures, new products from AMD and NVIDIA prefer arithmetic operations to texturing. Perhaps, we'll abandon texturing-intensive tests in our synthetic part in future. Let's have a look at results of another two pixel shader tests - SM 3.0. They are the most complex of all our tests for Direct3D 9 pixel shaders. The tests load ALUs and texture units heavily. Both shader programs are complex, long, and include a lot of branches:
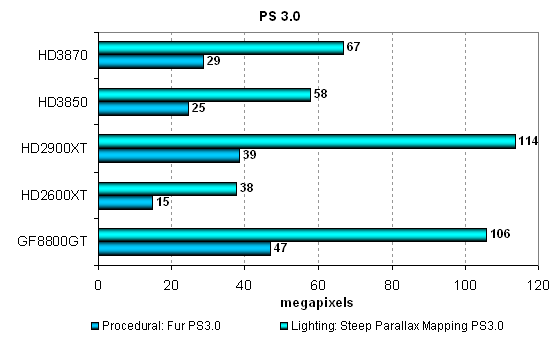 These tests generate heavy load even for the most powerful graphics, although the HD 2600 XT is not even twice as slow. The most interesting thing here is that our new RV670-based cards are outperformed by the GeForce 8800 GT and even the RADEON HD 2900 XT in both tests! It may indicate problems with drivers or the effect of memory bandwidth. The GeForce 8800 GT with lower memory bandwidth is faster than the RADEON HD 3870, although the R600 architecture seemed to execute complex PS 3.0 with many branches more efficiently than the G8x/G9x. Direct3D 10: PS 4.0 Tests (texturing, loops)New RightMark3D 2.0 includes two old Direct3D 9 PS 3.0 tests, rewritten for DirectX 10, and two brand new tests. The first two tests can now enable self-shadowing and shader supersampling, which increase their load on GPUs. These tests measure efficiency of executing looped pixel shaders with a lot of texture lookups (up to several hundreds of lookups per pixel in the heaviest mode!) and a relatively low ALU load. In other words, they measure a texture sampling rate and branching efficiency in a pixel shader. The first pixel shader test will be the Fur test. When used with the lowest settings, it uses 15-30 texture lookups from bump maps and two lookups from the main texture. The High Effect Detail mode increases the number of lookups to 40-80. When shader supersampling is enabled - the number of lookups grows to 60-120. And the High mode with SSAA is the heaviest mode - 160-320 lookups from a bump map. Let's see what happens in modes without supersampling - they are relatively simple, and the correlation of results in Low/High modes must be similar.
All results in the High mode are approximately 1.5 times as low as in the Low mode. Procedural fur tests with lots of texture lookups traditionally demonstrate a big advantage of NVIDIA solutions over AMD ones. None of RADEON cards can vie with both GeForce 8800 products. Theoretically, this lag shouldn't have existed, I don't understand where this difference comes from... The RADEON HD 2600 XT is much slower than the top solutions, because is has fewer execution units. Interestingly, the RV670-based graphics cards demonstrate a tad better results versus the top R600, adjusted for the difference in clock rates. The HD 3850 performs on a par with the HD 2900 XT, and the HD 3870 is faster by 10-15%, although the frequency difference is smaller. Let's have a look at the results in this test with enabled shader supersampling, which quadruples the load. Perhaps it will change the situation: Theoretically, supersampling quadruples the load. But its slows NVIDIA graphics cards down more than AMD R6xx cards. That's why the latter cards come closer to the cards based on G80 and G92. Only the GeForce 8800 can cope with such test complexity. All other cards demonstrate low results, and the RADEON HD 2600 XT is outperformed by the RV670/R600-based cards more than twofold. Nothing changes in the comparison of the HD 3800 and the HD 2900, the new cards are faster than the previous top solution, even though they operate at almost identical frequencies. The second test that measures efficiency of executing complex looped pixel shaders with many texture lookups is called Steep Parallax Mapping. With low settings it uses 10-50 texture lookups from a bump map and three lookups from main textures. The heavy mode with self-shadowing doubles the number of texture lookups, and supersampling quadruples this number. The most complex test mode with supersampling and self-shadowing uses 80-400 texture lookups, that is eight times as many as in the low mode. Let's analyze simple modes without supersampling first: This test is more interesting from the practical point of view, because parallax mapping methods have been used in games for a long time already. And heavy modifications, like our steep parallax mapping, have recently appeared in games, e.g. in Lost Planet and Crysis. Along with supersampling, this test can enable self-shadowing that doubles the GPU load (High mode.) Although AMD solutions were previously strong in our Direct3D 9 tests of parallax mapping, they cannot cope with the updated DX10 test without supersampling faster than the GeForce 8800 GT and GTS. Besides, self-shadowing causes a bigger performance drop in AMD products, over two times versus 1.5 in NVIDIA solutions. The HD 3850 is slightly slower in the Low mode than the HD 2900 XT, and it outperforms the latter in the High mode. The RADEON HD 3870 is already faster than these cards, even though it's still much slower than the GeForce 8800 GT. On the other hand, the previous Mid-End solution from AMD drags behind, being twice as slow as the other cards. Let's see what supersampling will change - it caused bigger performance drops on NVIDIA cards in the previous test. Another heavy task for GPUs. What both options are enabled, the load grows eightfold resulting in serious performance drops. Performance differences between our graphics cards remain. However, when supersampling is enabled, the R6xx-based cards improve their results versus NVIDIA, just like in the previous case. Unfortunately, the RV670 only comes close to the G92, being slower. What concerns the comparison between the HD 3800 and the HD 2900, the RV670-based cards demonstrate better results than the top R600-based card as the load grows. Direct3D 10: PS 4.0 Tests (computing)The next couple of pixel shader tests contains very few texture lookups to minimize the effect of TMUs on performance. They use a lot of arithmetic operations, so they measure arithmetic performance of GPUs, how fast they execute arithmetic instructions in pixel shaders. The first computing test is called Mineral. It's a complex procedural texturing test, which uses only two texture lookups and 65 sin and cos instructions.
The R600 fares well in complex arithmetic tasks, outperforming competing solutions from NVIDIA. The RADEON HD 2900 XT is apparently stronger than any other card in this test, G80/G92-based solutions are slower. Performance in this test seems to be affected much by memory bandwidth, because the HD 2900 XT is 1.5 times as fast as the HD 3870. This result cannot be explained with other reasons. The RV670 hardly executes arithmetic instructions less efficiently. The new RV670-based cards perform almost on a par with the GeForce 8800 GT, the GeForce 8800 GTS is a tad slower. Performance of the RADEON HD 2600 XT is more than twice as low as that of the RV670-based cards, this ratio is not demonstrated for the first time. The second shader test is called Fire, it's even harder for ALUs. It contains only a single texture lookup, while the number of sin/cos instructions is doubled to 130. Let's see what changes as the load grows: Nothing has changed in this test for AMD with the appearance of the RADEON HD 3800 family, there is evidently a bug in AMD drivers, which hasn't been fixed yet. If it's not a bug, the GeForce 8800 GT is 50 times as fast as all competing cards from AMD. Our test is not 3DMark or Crysis, nobody will optimize drivers for it... On one hand, it's good. On the other hand, such bugs should be fixed. Direct3D 10: Geometry Shader TestsRightMark3D 2.0 includes two geometry shader tests. The first one is called Galaxy, it's similar to point sprites from previous Direct3D versions. It animates a system of particles using a GPU, a geometry shader creates four vertices from each particle. Similar algorithms should be used in future DirectX 10 games. A change of balance in geometry tests does not affect rendering results, the image is always identical, only scene processing methods differ. GS load value determines what shader will be busy - vertex or geometry. The amount of work is always the same. Let's analyze the first modification of Galaxy with vertex computing for three levels of geometric complexity: The correlation of results with different complexity levels of the scene is almost the same, only absolute values are different. Performance demonstrated corresponds to the number of points, FPS is halved each step. We can see the apparent effect of memory bandwidth on results. The RADEON HD 2900 XT is 1.5 times as fast as the HD 3850 and the HD 3870. In its turn, the HD 2600 XT is almost twice as slow. Only the top card from AMD can compete with the GeForce 8800 GT and GTS in this test. Both cards with the RV670 are outperformed here by NVIDIA cards. However, this is not a hard task for modern graphics cards, it's mostly limited by memory bandwidth than by GPU. Perhaps the situation will change, when some work is moved to a geometry shader. No, there are actually no changes at all. All graphics cards demonstrate the same results (adjusted for the measurement error), when GS load is changed, that is when some work is transferred to a geometry shader. The GeForce 8800 GT is still a tad faster than the HD 2900 XT. And the latter card is faster than the new Mid-End HD 3850 and HD 3870 owing to its higher memory bandwidth. Let's see what happens in the next test... Hyperlight is the second geometry test that uses several techniques: instancing, stream output, buffer load. It employs dynamic generation of geometry by rendering into two buffers, as well as a new Direct3D 10 feature - stream output. The first shader generates ray directions, their speed and growth vectors. These data are stored in a buffer, which is used by the second shader for rendering. Each ray point is used to generate 14 vertices in a circle, up to a million output points. The new type of shader programs is used to generate rays. If "GS load" is set to "Heavy" - it's also used for rendering. That is in Balanced mode, geometry shaders are used only to generate and grow rays. Output is up to instancing. The geometry shader also outputs data in the Heavy mode. Let's analyze the easy mode first: Relative results in various modes correspond to the load. Performance scales well in all cases. It's close to theoretical parameters, according to which, each next level of Polygon count must be twice as slow. Results of NVIDIA cards are again over two times as high as results of the best solutions from AMD with any geometry complexity. The new cards from AMD perform much better in this test. The RADEON HD 2900 XT is just 1.5 times as fast as the HD 2600 XT. But both new graphics cards demonstrate higher results versus the previous top solution. The HD 3850 is just a little faster than the HD 2900 XT, but the HD 3870 is stronger than the HD 2900 XT by 20-25%! It cannot be explained with the difference in frequencies. It should be the effect of optimizations in drivers or in hardware (it's less probable, but still possible.) Results may change in the next test with more active usage of geometry shaders. It will be also interesting to compare results obtained in Balanced and Heavy modes. This time the ratio of performance results in various modes has changed much. R6xx GPUs are evidently faster in such tasks than NVIDIA GPUs. The RADEON HD 2900 XT is 1.5-2 times as fast as the GeForce 8800, and the HD 2600 XT performs on a par with the GeForce 8800 GTS! We confirm our older conclusion that AMD solutions profit from complexity of a geometry shader compared to NVIDIA graphics cards. AMD cards are again affected by optimizations for different loads on R600 and RV670 or different memory bandwidth values. The HD 2900 XT is faster than the HD 3800 by 30-40%. On the other hand, the R600 may be optimized better for heavy geometry tasks, while the RV670 is better at vertex shader tasks. This will explain results of this test and the previous one.What concerns a comparison of results in various modes, both GeForce 8800 GT cards in Balanced mode perform better than the RADEON HD 2900 XT, HD 3850 and HD 3870 in Heavy mode. You should keep in mind that the image does not differ in these modes. AMD cards prefer the second mode (a geometry shader is used instead of instancing), while NVIDIA cards - the first mode. But if we compare cards in their favorable modes, the GeForce 8800 GT still outperforms both new Mid-End cards from AMD. Here goes our main conclusion on geometry shaders: various tests of geometry shaders demonstrate different results. The new cards based on the RV670 demonstrate good results here, even though they are still outperformed by their competitors. On the whole, they fare on a par with the RADEON HD 2900 XT. They even shoot forward, as geometry complexity grows. Direct3D 10: Vertex texture fetch rateVertex Texture Fetch tests measure the speed of many vertex texture fetches. These tests are similar, and the correlation of their results in Earth and Waves tests must be also similar. Both tests use displacement mapping based on texture lookups. The only major difference is that the Waves test uses conditional branches, while the Earth test does not. Let's analyze the first test (Earth) in Effect detail Low mode: This time the three modes demonstrate different performance of graphics cards. The simpler the mode, the higher the effect of memory bandwidth on performance. It corroborates to the conclusion in the article devoted to the GeForce 8800 GT, where we discovered a significant performance difference between the GeForce 8800 GT and the 8800 GTX. You can see it well in the comparison of the HD 2900 XT and the HD 3850. The old solution easily wins in the Low mode, both cards perform on a par in the Med mode, and the HD 3850 shoots forward in the High mode. The same applies to the HD 3870. But it outperforms the HD 2900 XT even in the Med mode. The HD 3870 competes with the GeForce 8800 GT with varied success. The NVIDIA card wins in two modes, and the new card from AMD comes a little forward in the most complex mode. The ratio between performance of the new Mid-End cards from AMD and the old RADEON HD 2600 XT card has changed, the latter is outperformed threefold in the most complex mode. Let's have a look at results of this test with more texture lookups: The situation hasn't changed much. The difference between the HD 3800 and the HD 2900 has become smaller, the effect of memory bandwidth remains, although the more expensive card from the new family is actually faster than the old card. The previous Mid-End card (RADEON HD 2600 XT) is still much slower, and the GeForce 8800 GT now wins in all tests. Let's have a look at results of the second vertex texture fetch test. The Waves test executes fewer texture lookups, but it uses conditional branches. The number of bilinear texture lookups in this case reaches 14 (Effect detail Low) or 24 (Effect detail High) per each vertex. Geometry complexity changes just like in the previous test. The Waves test shows similar results to those in the previous test, we can see the effect of memory bandwidth even in NVIDIA graphics cards. Both new cards of the HD 3800 family look good, the cheaper card performs on a par with the HD 2900 XT. The more expensive card is faster. Both cards are two-three times as fast as the HD 2600 XT, but they still cannot outperform the GeForce 8800 GT that wins in complex modes. It's defeated in the Low mode because of the lower memory bandwidth. Let's analyze the second mode: As test complexity grows, both HD 3800 cards outperform the HD 2900 XT. There must have been some optimizations made. All the other conclusions hold good - performance in the Low mode is limited by memory bandwidth, TMU and ROP units play more important roles in High modes. The GeForce 8800 GT copes with vertex texture fetch tests better than the new cards from AMD. When geometry complexity is low, performance is limited by lower memory bandwidth. As the amount of fetched data grows, this card becomes the fastest product. Conclusions on the synthetic tests
Our analysis of synthetic tests of the RADEON HD 3850 and the HD 3870 shows that the new Mid-End cards from AMD offer high performance, similar to older top solutions. Like the NVIDIA GeForce 8800 GT, they compete with much more expensive cards! What concerns energy efficiency, such monsters as the HD 2900 XT cannot compare with them, because the new GPUs are manufactured by the 55 nm fabrication process, which gives important advantages in power consumption and heat release. We should also mention the potential advantage of the RV670 and its cards - DirectX 10.1 support. Even though this version does not exist yet (except for beta versions for developers, of course), this feature is an important competitive advantage, because many users evaluate graphics cards by their support for this API. We cannot evaluate the 10.1 advantages so far, but we'll pay attention to this issue in future articles. The next part of the article will contain tests of the new Mid-End cards from AMD in games. These results should prove that our synthetic conclusions are true.
Write a comment below. No registration needed!
|
Platform · Video · Multimedia · Mobile · Other || About us & Privacy policy · Twitter · Facebook Copyright © Byrds Research & Publishing, Ltd., 1997–2011. All rights reserved. | ||||||||||||||||||||||||||||||||||||||||||||||||||||||||||||||||||||||||||||||||||||||||||||||||||||||||||||||||||||||||||||||||||||||||||||||||||||