 |
||
|
||
| ||
|
||
|
||
| ||
Developers of 3D applications understand the importance of convenient tools to analyze frames and rendering performance. Modern 3D applications are extremely complex, and their complexity only grows in time. To use features of various GPUs in the optimal way, programmers need utilities to help them find bugs and bottlenecks in their applications. A GPU and a CPU perform many different graphics pipeline operations for each frame, and overall performance depends on the slowest segment. That's why convenient debuggers are so important -- it's very difficult to analyze hundreds of calls each millisecond without proper tools. Utilities for 3D development existed before, of course. For example, Microsoft PIX for Windows from DirectX SDK. Or NVIDIA NVPerfKit or ATI/AMD GPU PerfStudio. Microsoft is interested in PIX not only because of DirectX, but also because of Xbox. And AMD with NVIDIA manufacture GPUs. But there are other manufacturers of graphics solutions, leading ones at that. So, today we are going to review Intel Graphics Performance Analyzer 2.0, which has been announced at GDC 2009. Graphics Performance Analyzer 2.0Intel Graphics Performance Analyzer (GPA) 2.0 is a bundle of utilities for 3D developers, which contains powerful tools to analyze performance of Direct3D applications, to detect bottlenecks, and to optimize them. These utilities have a traditional interface for such tools, it resembles Microsoft PIX for Windows or ATI/AMD utilities than tools from NVIDIA, which we already reviewed on our web site. You can download GPA 2.0 on Intel web site after you register (free of charge) in Visual Adrenalin: http://www.intel.com/software/gpa GPA 2.0 components:
GPA system requirements are stipulated primarily by support (at the initial stage) only for integrated graphics from Intel. As it's still far from the long-expected rollout of discrete products from this company, these utilities currently support only the following chipsets: desktop Intel G45 Express and mobile Intel GM45 Express. That's the main requirement to a test system. Intel GPA 2.0 system requirements:
Let's examine each utility. There is just no point in examining Remote Server -- it looks like a usual console program, even though it's an important part of the package. But its functionality is revealed in client GUI applications. System AnalyzerThis utility allows to analyze performance and find bottlenecks in code. It will also come in handy for other tasks, for example, to determine whether performance is limited by a CPU/GPU or certain GPU units. Analyzing performance and tweaking 3D applications is always a complex and lengthy process. System Analyzer makes these tasks easier. The graphics interface of this application offers many metrics in a convenient way. You can also use special override modes that disable parts of the 3D render pipeline, so that you can pinpoint potential bottlenecks in an application and main characteristics of the system that affect overall performance (the speed of CPU, texture units, etc). GPA System Analyzer gathers data from software and hardware metrics using a special instrument video driver. This utility reads the metrics and writes data into a local database, so that they can be displayed for on-the-fly interactive analysis. You can pause an application any time and perform various experiments (read below) without modifying the code. As for now, only Direct3D 9 applications are supported. Other APIs and D3D versions are not supported yet. However, Direct3D 10 and 11 will be added in future. GPA users can choose several metrics, including D3D, CPU and GPU ones. Here is the list of metrics available in Graphics Performance Analyzer 2.0 (some of them can be disabled in public versions of this program). CPU:
DX (DirectX):
GPU:
System Analyzer activates the following metrics by default: Frames per Second, CPU Utilization, CPU Multi-line Utilization, System Memory Write Bandwidth, System Memory Read Bandwidth, System Memory Overall Bandwidth, System Memory Multi-line Bandwidth. It's a good choice for most applications, but a user can create and save custom metric sets. You just select a metric in the list, open the context menu, and add the metric to a digram. System Analyzer allows to organize metrics into custom groups and name them to your convenience. System Analyzer can gather metrics, analyze data, find bottlenecks in 3D applications, and capture frame data for thorough analysis in Frame Analyzer. This utility can be started in two modes: network and local (just like the network mode, but it uses the same system for tests and analysis). The network mode is naturally the most convenient, that's the recommended mode. There are several reasons for it -- convenience (full-screen applications cannot be analyzed on a single system) and measurement precision. The latter is important, because System Analyzer also uses CPU resources, which may reduce measurement precision, if System Analyzer and a test application run on the same system. For the network GPA mode, run GPA Remote Server on a test system and System Analyzer on the auxiliary system. The auxiliary system sends a request to the test system to start an application. Then it gathers data from metrics and sends them via network to the auxiliary PC that displays gathered data. 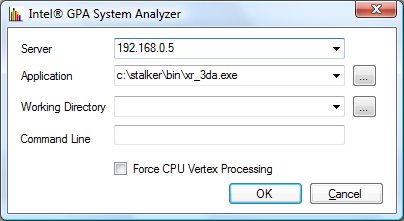 You should specify some parameters in System Analyzer for the network mode: IP address, path to the executable (on the test system), working directory (if a program uses several executable files), and a command line, if necessary. There is also the Force CPU Vertex Processing option. In this case the driver does all vertex processing using a CPU instead of a GPU. In order to indicate that GPA is running in a given application, a small red rectangle appears in the upper left corner of the screen. If you cannot see it, your program is not a D3D9 application or GPA failed to 'intercept' its calls. 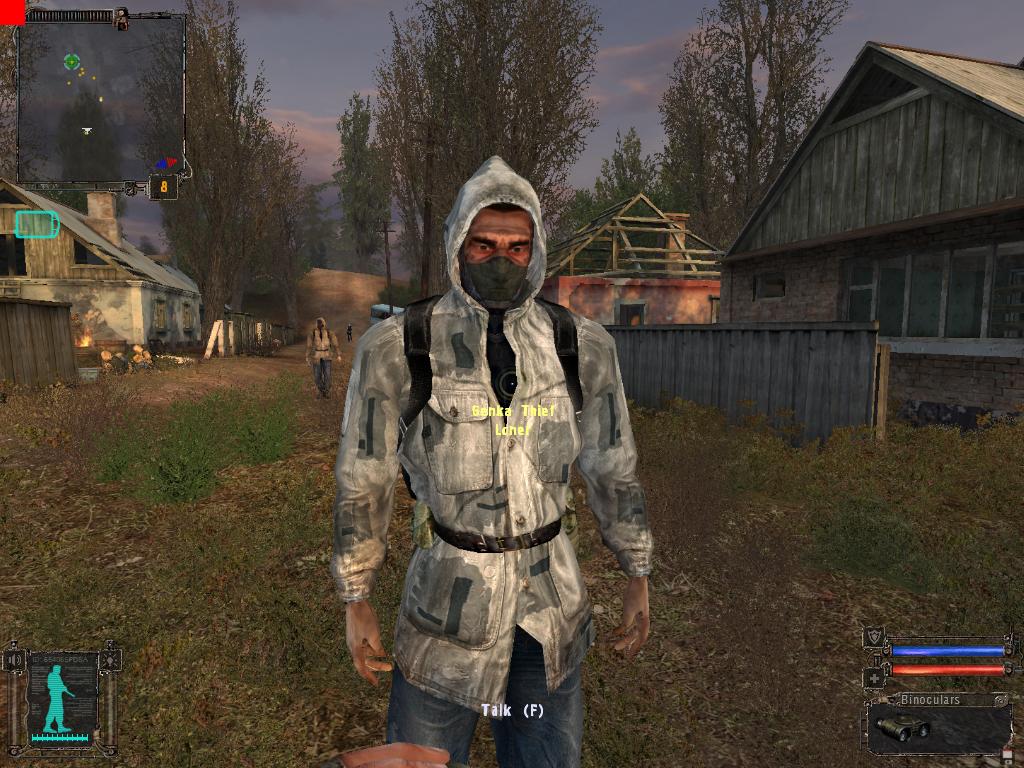 The graphics interface of this program is very convenient, you can configure diagrams to illustrate resource usage by a given 3D application. You can get data from metrics for a specified period of time and scale graphs up and down. 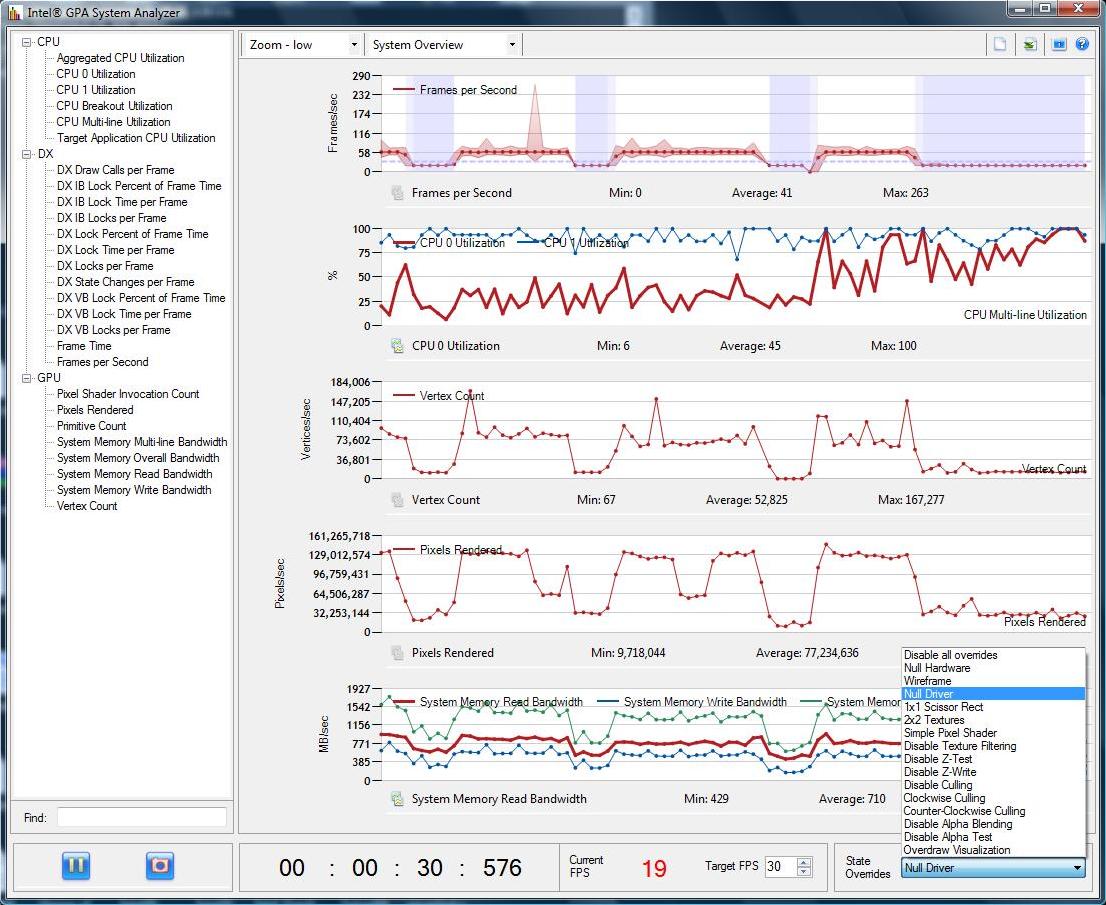 It's possible to export gathered data from diagrams for a more detailed analysis. There is a button in the upper right corner to export all data, you can also export data from one of the diagrams by calling a context menu. Data are exported in popular CSV format, which can be opened in Microsoft Excel, OpenOffice Calc, or other applications. Write a comment below. No registration needed!
|
Platform · Video · Multimedia · Mobile · Other || About us & Privacy policy · Twitter · Facebook Copyright © Byrds Research & Publishing, Ltd., 1997–2011. All rights reserved. |


