 |
||
|
||
| ||
Software groups and testsFirst of all, it makes sense to list software used in all tests:
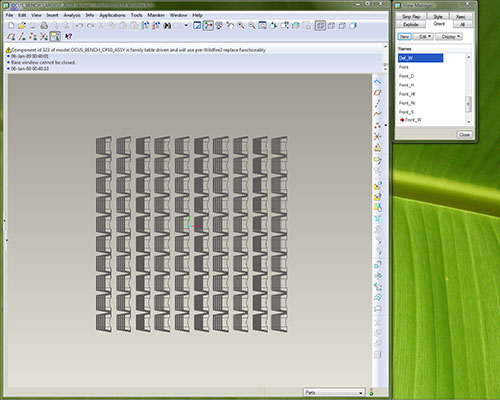
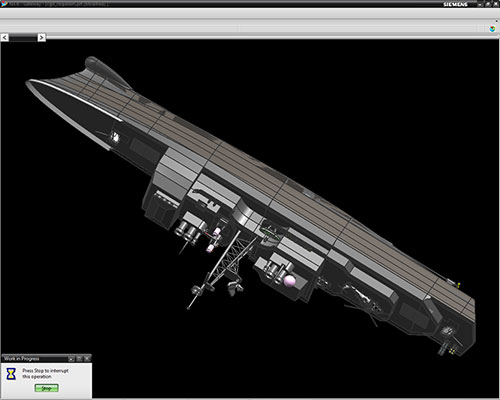
Plus the latest drivers for the chipsets, processors (if necessary), and other PC components. Group 1: 3D visualizationIt's a new group of tests, but it includes familiar software. We traditionally use three tests from three popular 3D suites: Autodesk 3ds max, Autodesk (aka Alias|Wavefront) Maya, and NewTek Lightwave. Some of our readers note that the third package cannot compare with the first two in popularity. However, we are of the opinion that Lightwave has its small but stable share of the market (and it does not look like it will decrease in future), and it has its unique share of features, so removal of this package from our test method would have narrowed down its range of vision so to speak. Besides, it would have disappointed Lightwave users. Both options are no good. Besides, our Lightwave test has become much more interesting in this version of the test method. Our readers surely remember that results obtained in each of these programs fall into two types: the speed of interactivity and the speed of rendering (Maya tests also produce separate results for the speed of CPU-intensive operations aside from rendering). The first type of load (interactivity) is critical to CPU and GPU speed (either Direct3D or OpenGL is used for video output), but it's quite indifferent to the number of cores (processors) in the system. On the other hand, rendering ready scenes is absolutely indifferent to the graphics system, but it's sensitive to CPU speed and the number of cores. Thus, we see it conceptually correct to divide interactive and render results of 3D modeling packages into two groups. Interactive score is calculated in the 3D Visualization group. And results of measuring render speed are published in the separate group: "3D Scene Rendering". However, the same visualization group should include not only results of interactive tests in 3D modeling packages, but also the other old acquaintances of ours: CAD/CAM suites SolidWorks, PTC Pro/ENGINEER, and UGS NX. There is a separate graphics component in their tests, and it actually means the same thing as the interactive score in 3D modeling tests: the speed of a program working with certain hardware to output 3D images to a display in real time using some graphics API (in our case all three CADs use OpenGL). Thus, this part of our test method includes seven packages, three of which belong to 3D modeling software, three CADs, and one program is the 10th generation of the famous SPEC viewperf test, which is also designed to evaluate the speed of real-time 3D visualization with OpenGL. Let's describe each test in more detail. 3ds max  Unfortunately, SPECapc still lacks tests for the current version of 3ds max. So we are forced to resort to more and more tricks to continue to use an old benchmark (written for the 'grandfather' of the current suite) with the new version (3ds max 9 -- 3ds max 2008 -- 3ds max 2009). Alas, we don't know an alternative benchmark that can compare with SPECapc for 3ds max 9. However, the situation is worsening each year: the SPEC benchmark worked well with 3ds max 2008 (there were some minor issues, but all its features worked), but several fragments of this test script fail to work with 3ds max 2009. The program would either crash or the messed main window would testify to problems. As a result, we had to remove several scenes that were used in the original test from SPEC and overhaul the summary table and formulas used to calculate average scores (trying to preserve the original logic, when possible). Thus, results of this tests obtained now will have nothing to do with results of the original SPEC test, and they cannot be compared with each other. As willy-nilly we modified the test to make it work, we could also overhaul the SPEC benchmark a little to make its results even more interesting. So we decided to modernize the rendering part. The modified version of the benchmark uses the popular professional V-Ray to render all scenes instead of the original built-in renderer 3ds max Scanline (which is not interesting to professionals). Besides, we use more complex scenes now: instead of the standard scenes that come with the test (quite easy for modern processors) -- Throne Shadowmap, CBALLS2, and Space FlyBy -- we 'fed' to the renderer Scenes 01, 02, and 07 from Evermotion Archinteriors Vol 1. Our efforts hardly raised this benchmark to the height of the hypothetical SPECapc for 3ds max 2009. However, 'better a small fish than an empty dish.' Maya  Even more time passed since the release of SPECapc for Maya 6.5, so it's not a state-of-the-art benchmark either. However, as we already wrote in the article devoted to the previous version of the test method, a minor change in one scene file allows to use it even with the latest Maya versions. In this case, SPEC test contains only an interactive component, and it does not evaluate rendering speed. We make up for this shortcoming in a traditional way: we measure render times of our own Maya scene (with the MentalRay renderer). We can say that nothing has changed since the previous version of the test method, only the program version. Lightwave  SPEC has finally done it! They have released a test for Lightwave, a sterling test for the latest version (including the 64-bit one). It has an interactive part, a rendering part, and even measures speed in a multitasking environment. This is certainly much better than a single test (render time) used in our previous test methods -- in terms of both scope and developer authority. Unfortunately, we have no other comments: it's a new test, we haven't gathered enough statistics yet. However, it meets our formal selection criteria: it supports modern software, it does not crash, and it provides test results. SolidWorks  We've been using this test for several years already. Unfortunately, for all these years SPEC hasn't released a single update for its benchmark. So each time a new version of SolidWorks comes out, we hold our breath as we start SPECaps for SolidWorks 2007... And sigh with relief: we're lucky again, it works. The benchmark itself resembles the other SPECapc tests, including those of 3D modeling packages: it measures performance in three aspects: processor-intensive operations, graphics, IO operations (it actually measures the speed of the disk system). Results represent the number of seconds it takes to execute corresponding parts of the benchmark (the smaller the result, the better). Only one test takes part in this segment -- Graphics. Pro/ENGINEER  We use OCUS Benchmark for Pro/ENGINEER, as this test develops much more dynamically than SPECapc for Pro/ENGINEER. It has a 64-bit version that can use lots of memory (this is one of the main advantages of 64-bit systems), and it supports the latest version of Pro/ENGINEER Wildfire. That is we have no reasons to use the old test from SPEC. Even though the OCUS Benchmark is an independent project, it also provides three results of the same type: Graphics related tasks, CPU related tasks, and Disk related tasks. As in case with the previous test, it's the sum of seconds spent on execution tasks in a given group. Only Graphics related tasks are used for the visualization score. UGS NX  It's another CAD/CAM package, and another old test from SPEC -- SPECapc for UGS NX 4 (we use the sixth version of the package in this test method). Fortunately, this test works well with the updated package. In fact, it looks very much like the previous two tests: three total scores (performance of graphics, processor, and IO operations). In this section we are interested in the first components -- graphics. SPEC viewperf 10  It's a famous test with a long and glorious history. It was developed for the analysis of graphics performance. This benchmark traditionally includes only those applications that can use OpenGL. In fact, viewperf is the most conventional tool for integral evaluation of graphics cards' performance in API OpenGL. It's an optional package in our method of testing: if we are interested in CPU performance, this benchmark makes no sense, as viewperf results do not depend on a CPU. And if we want a complex comparison of two computers with different graphics cards, viewperf results included to the 3D Visualization part may be very useful. Version 10 of this test now supports multithreading. However, this support is quite primitive so far: the test can be executed in one, two, and four threads (there are no other options, for example, three or eight threads). Besides, multithreading is used in the most primitive way: several instants of the test are started (that is we can see two or four identical windows with the same content). Technical details
The total score in a group is calculated as a geomean of all test results (of the lowest value means the best result, the geomean result works as 1/x). Write a comment below. No registration needed!
|
Platform · Video · Multimedia · Mobile · Other || About us & Privacy policy · Twitter · Facebook Copyright © Byrds Research & Publishing, Ltd., 1997–2011. All rights reserved. |