|
||
|
||
| ||
|
||
|
||
| ||
Contents
Part 2. Graphics cards' features, synthetic tests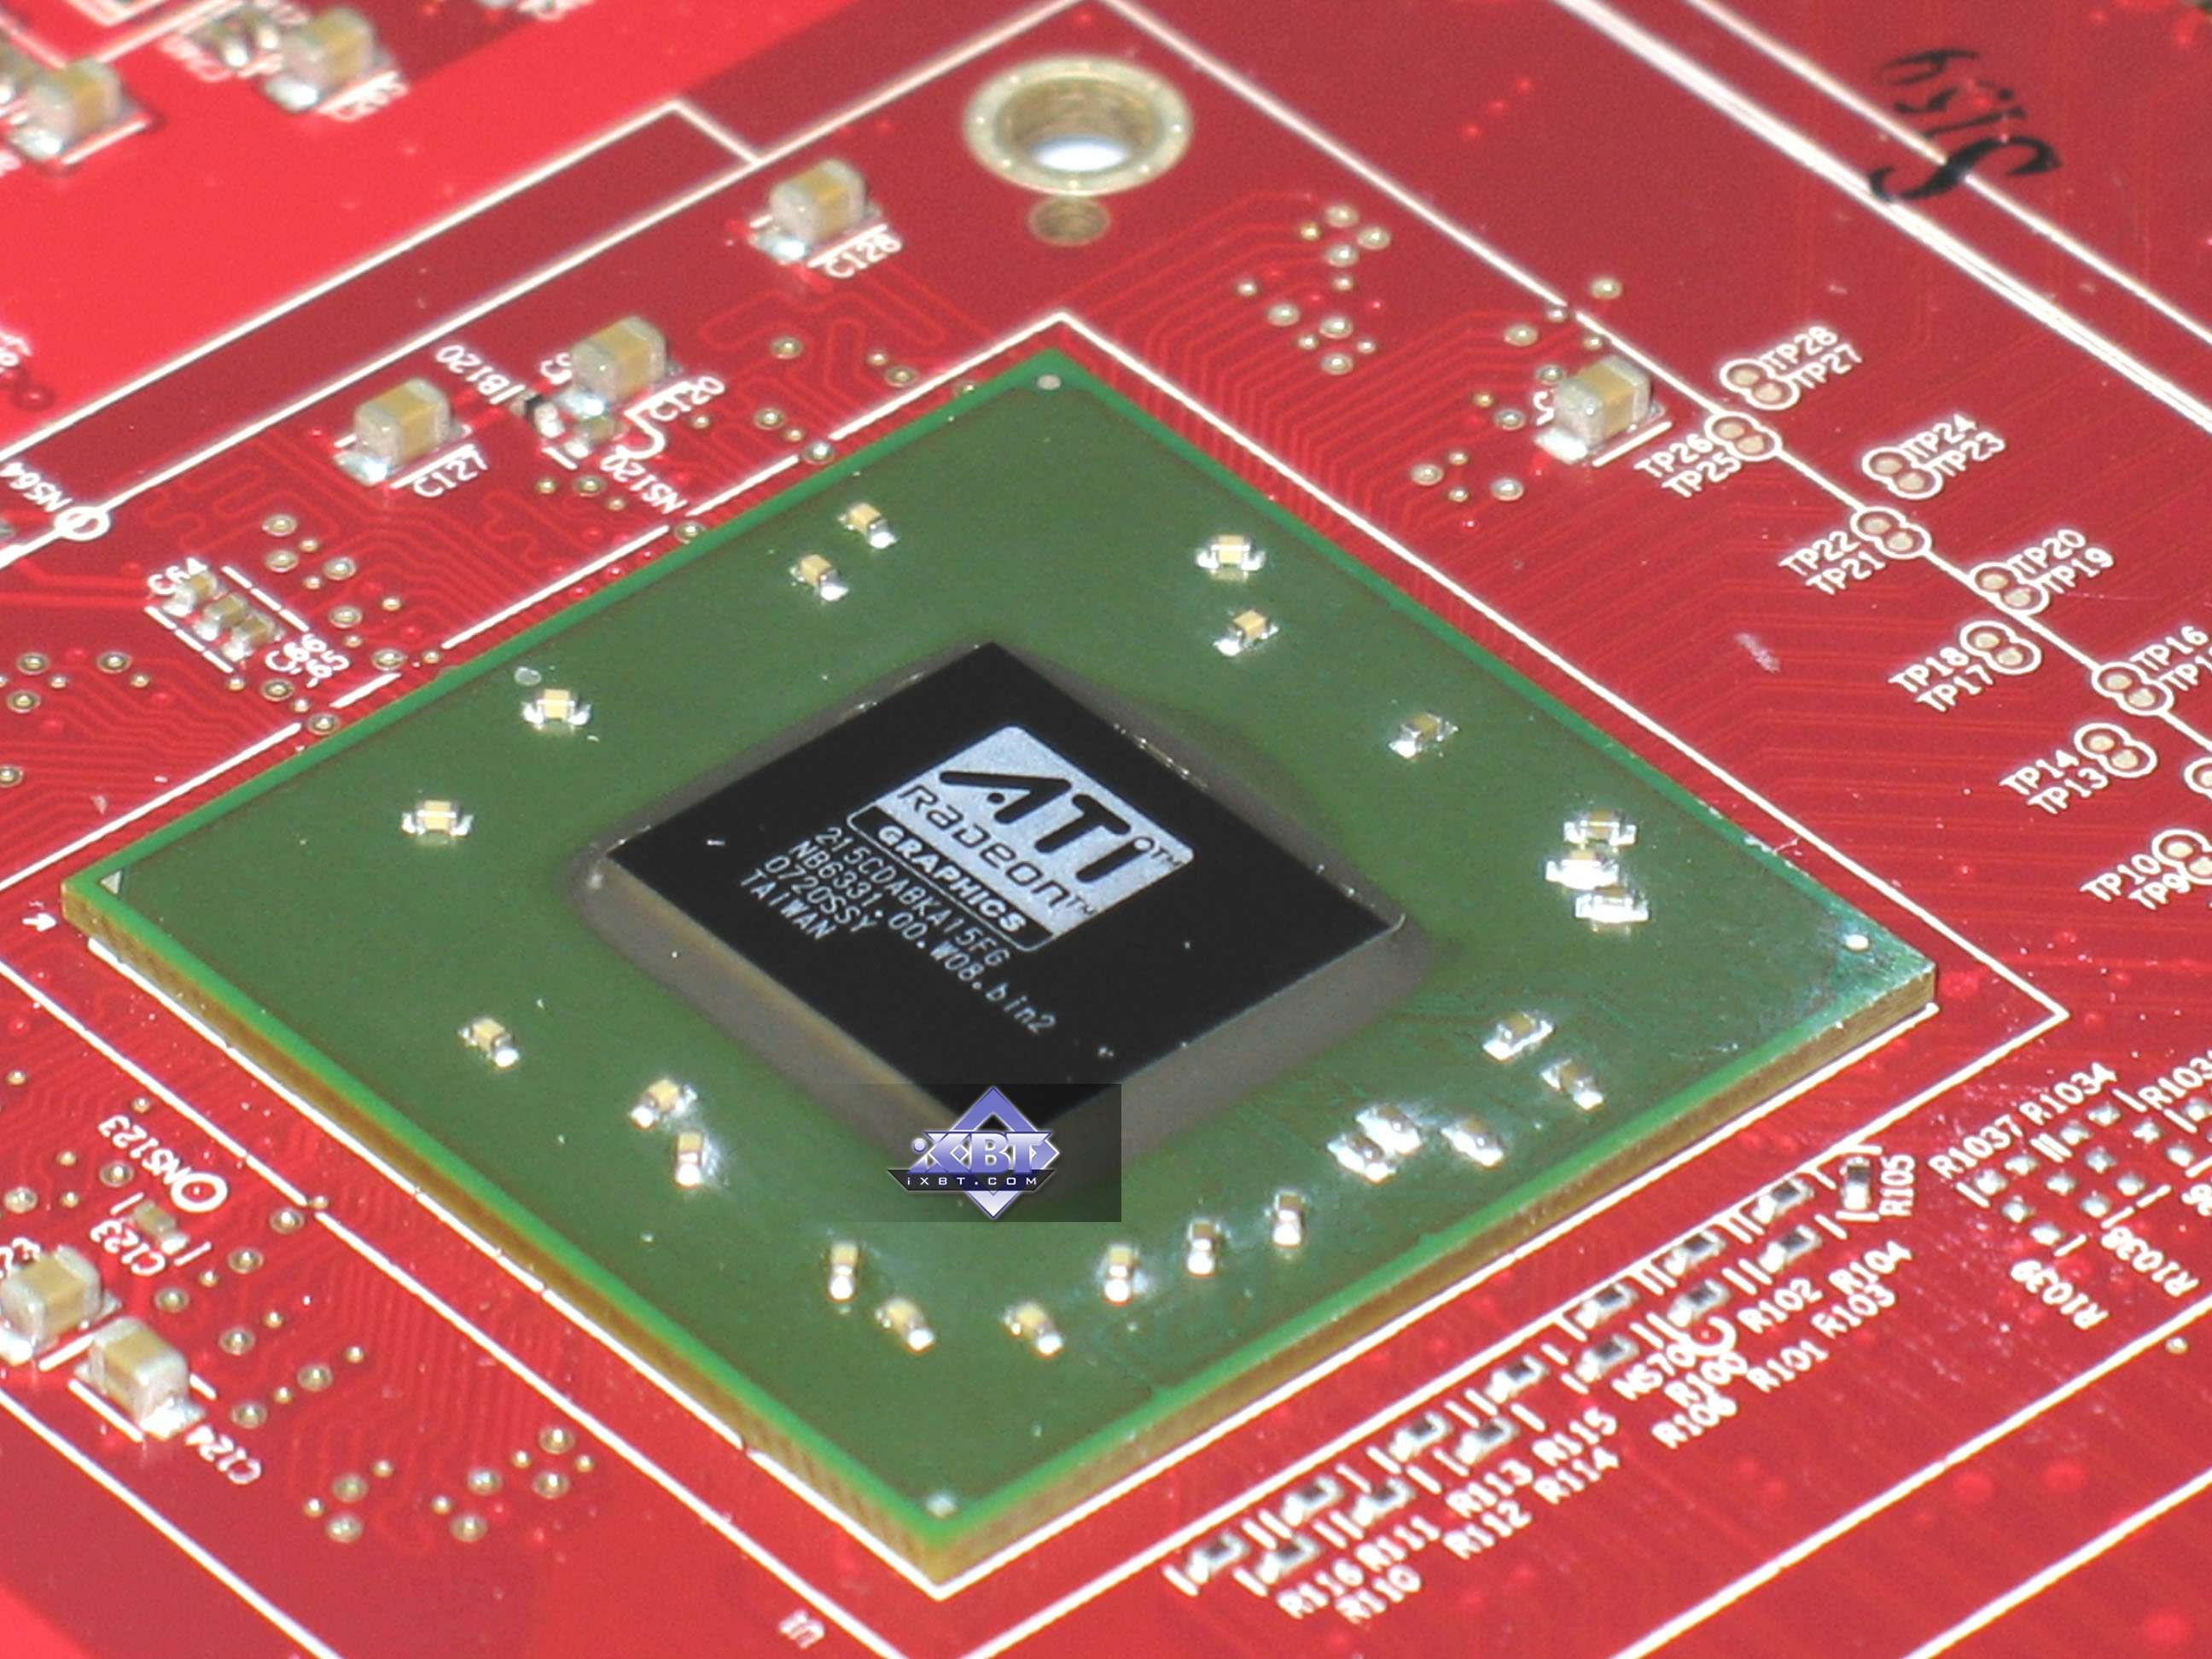 In the first part of this article we covered all of the architectural details of the RV610 and the RV630 GPUs. In short, the new RV610 GPU along with the RV630 GPU have a number of cards based on them. These are the various cards flavors the GPUs come in:
Today we are testing five graphics cards. Two of the cards are reference cards, and the three other cards are from Sapphire, TUL, and HIS. This article will not focus solely on the products themselves, but will take a stronger look at the architectures behind these cards. It is important to note that Alexei Nikolaychuk, the author of RivaTuner, has already added support for these new products to his utility: RADEON 2400 XT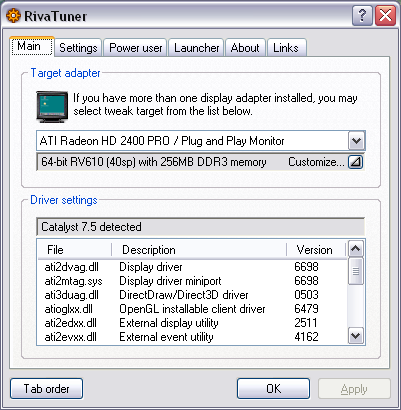 RADEON 2600 PRO RADEON 2600 XT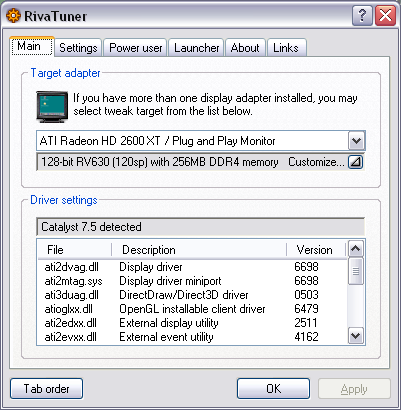 Graphics Cards
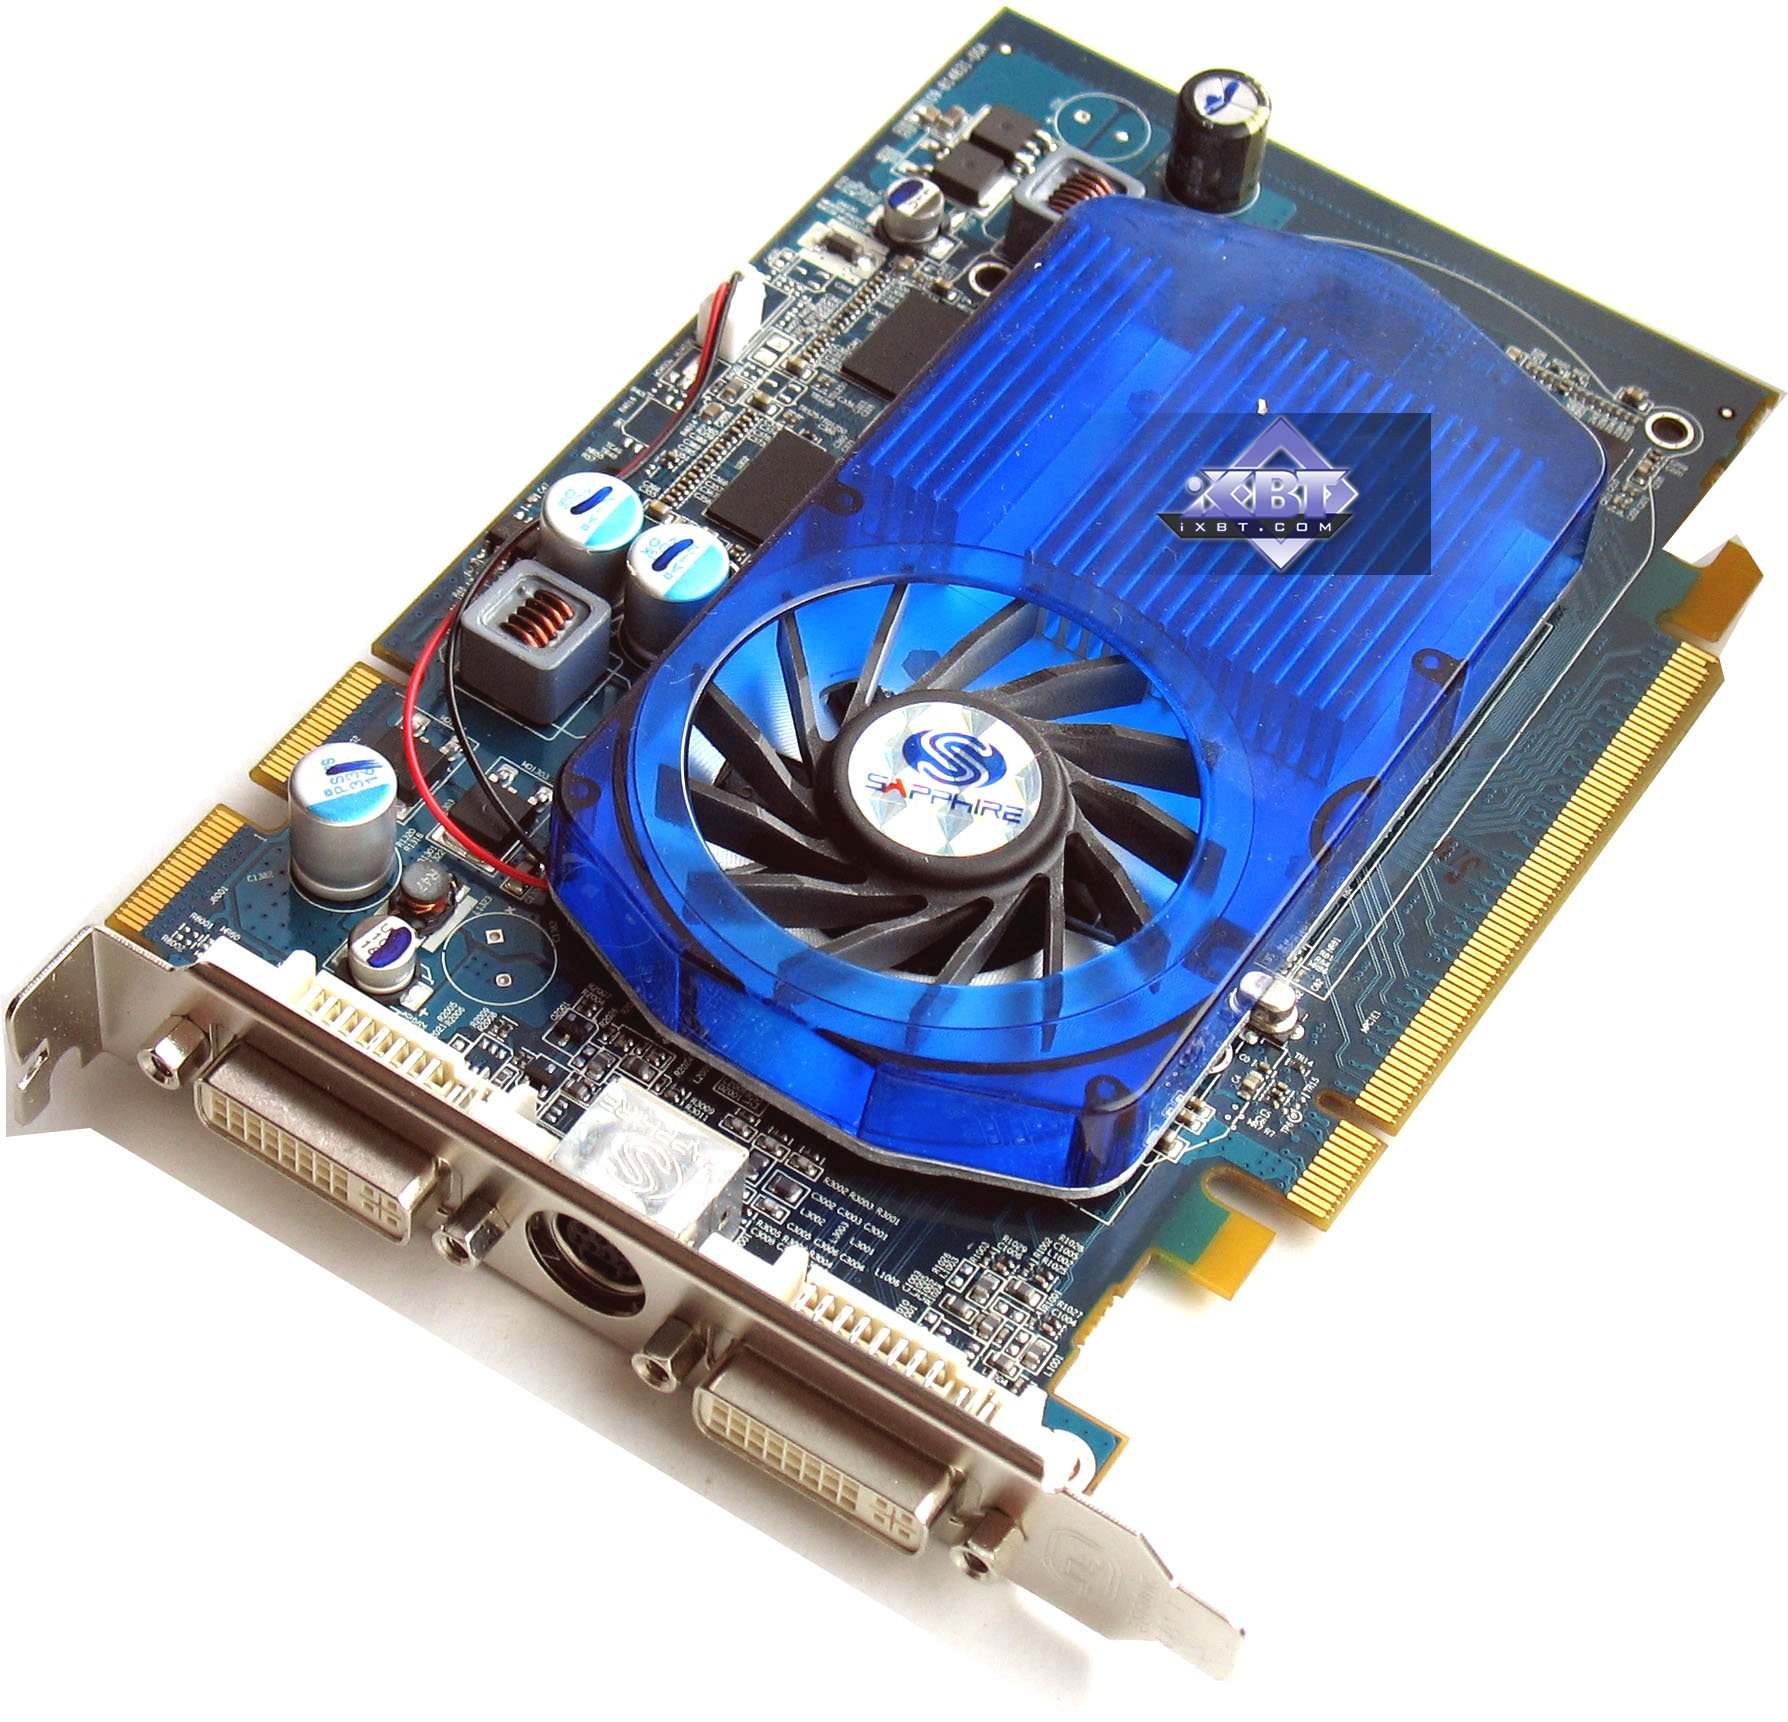
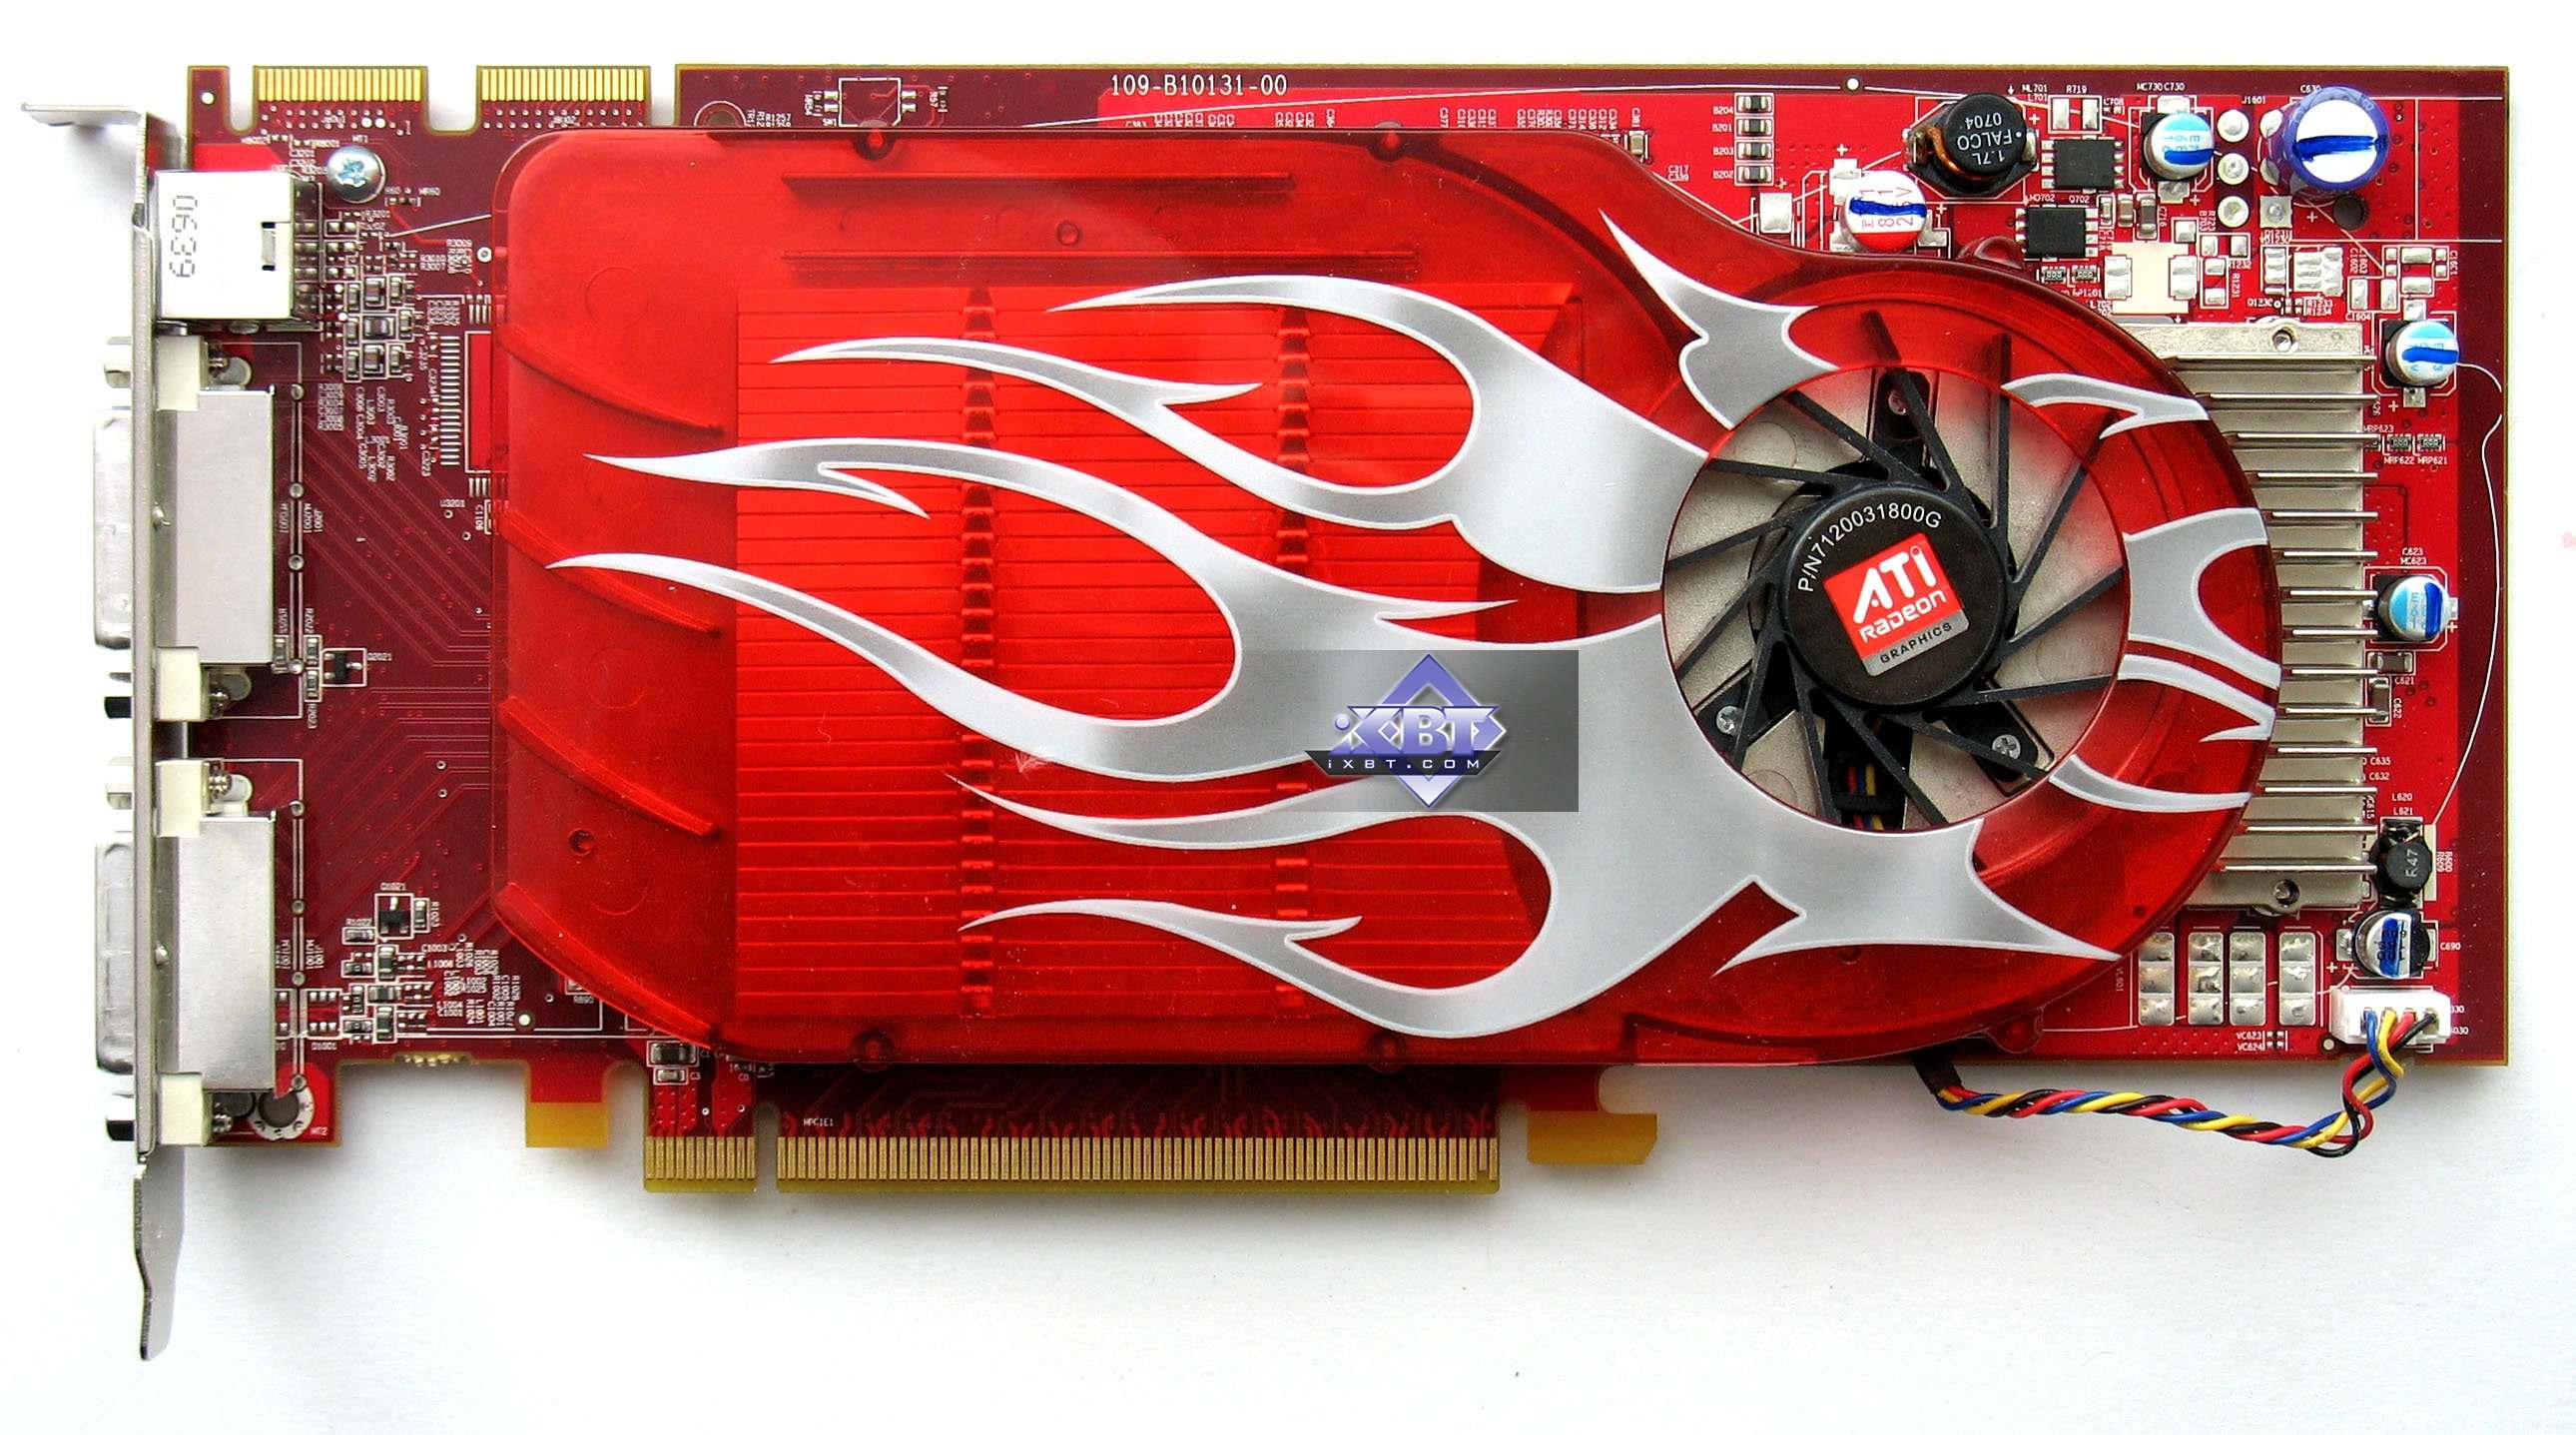
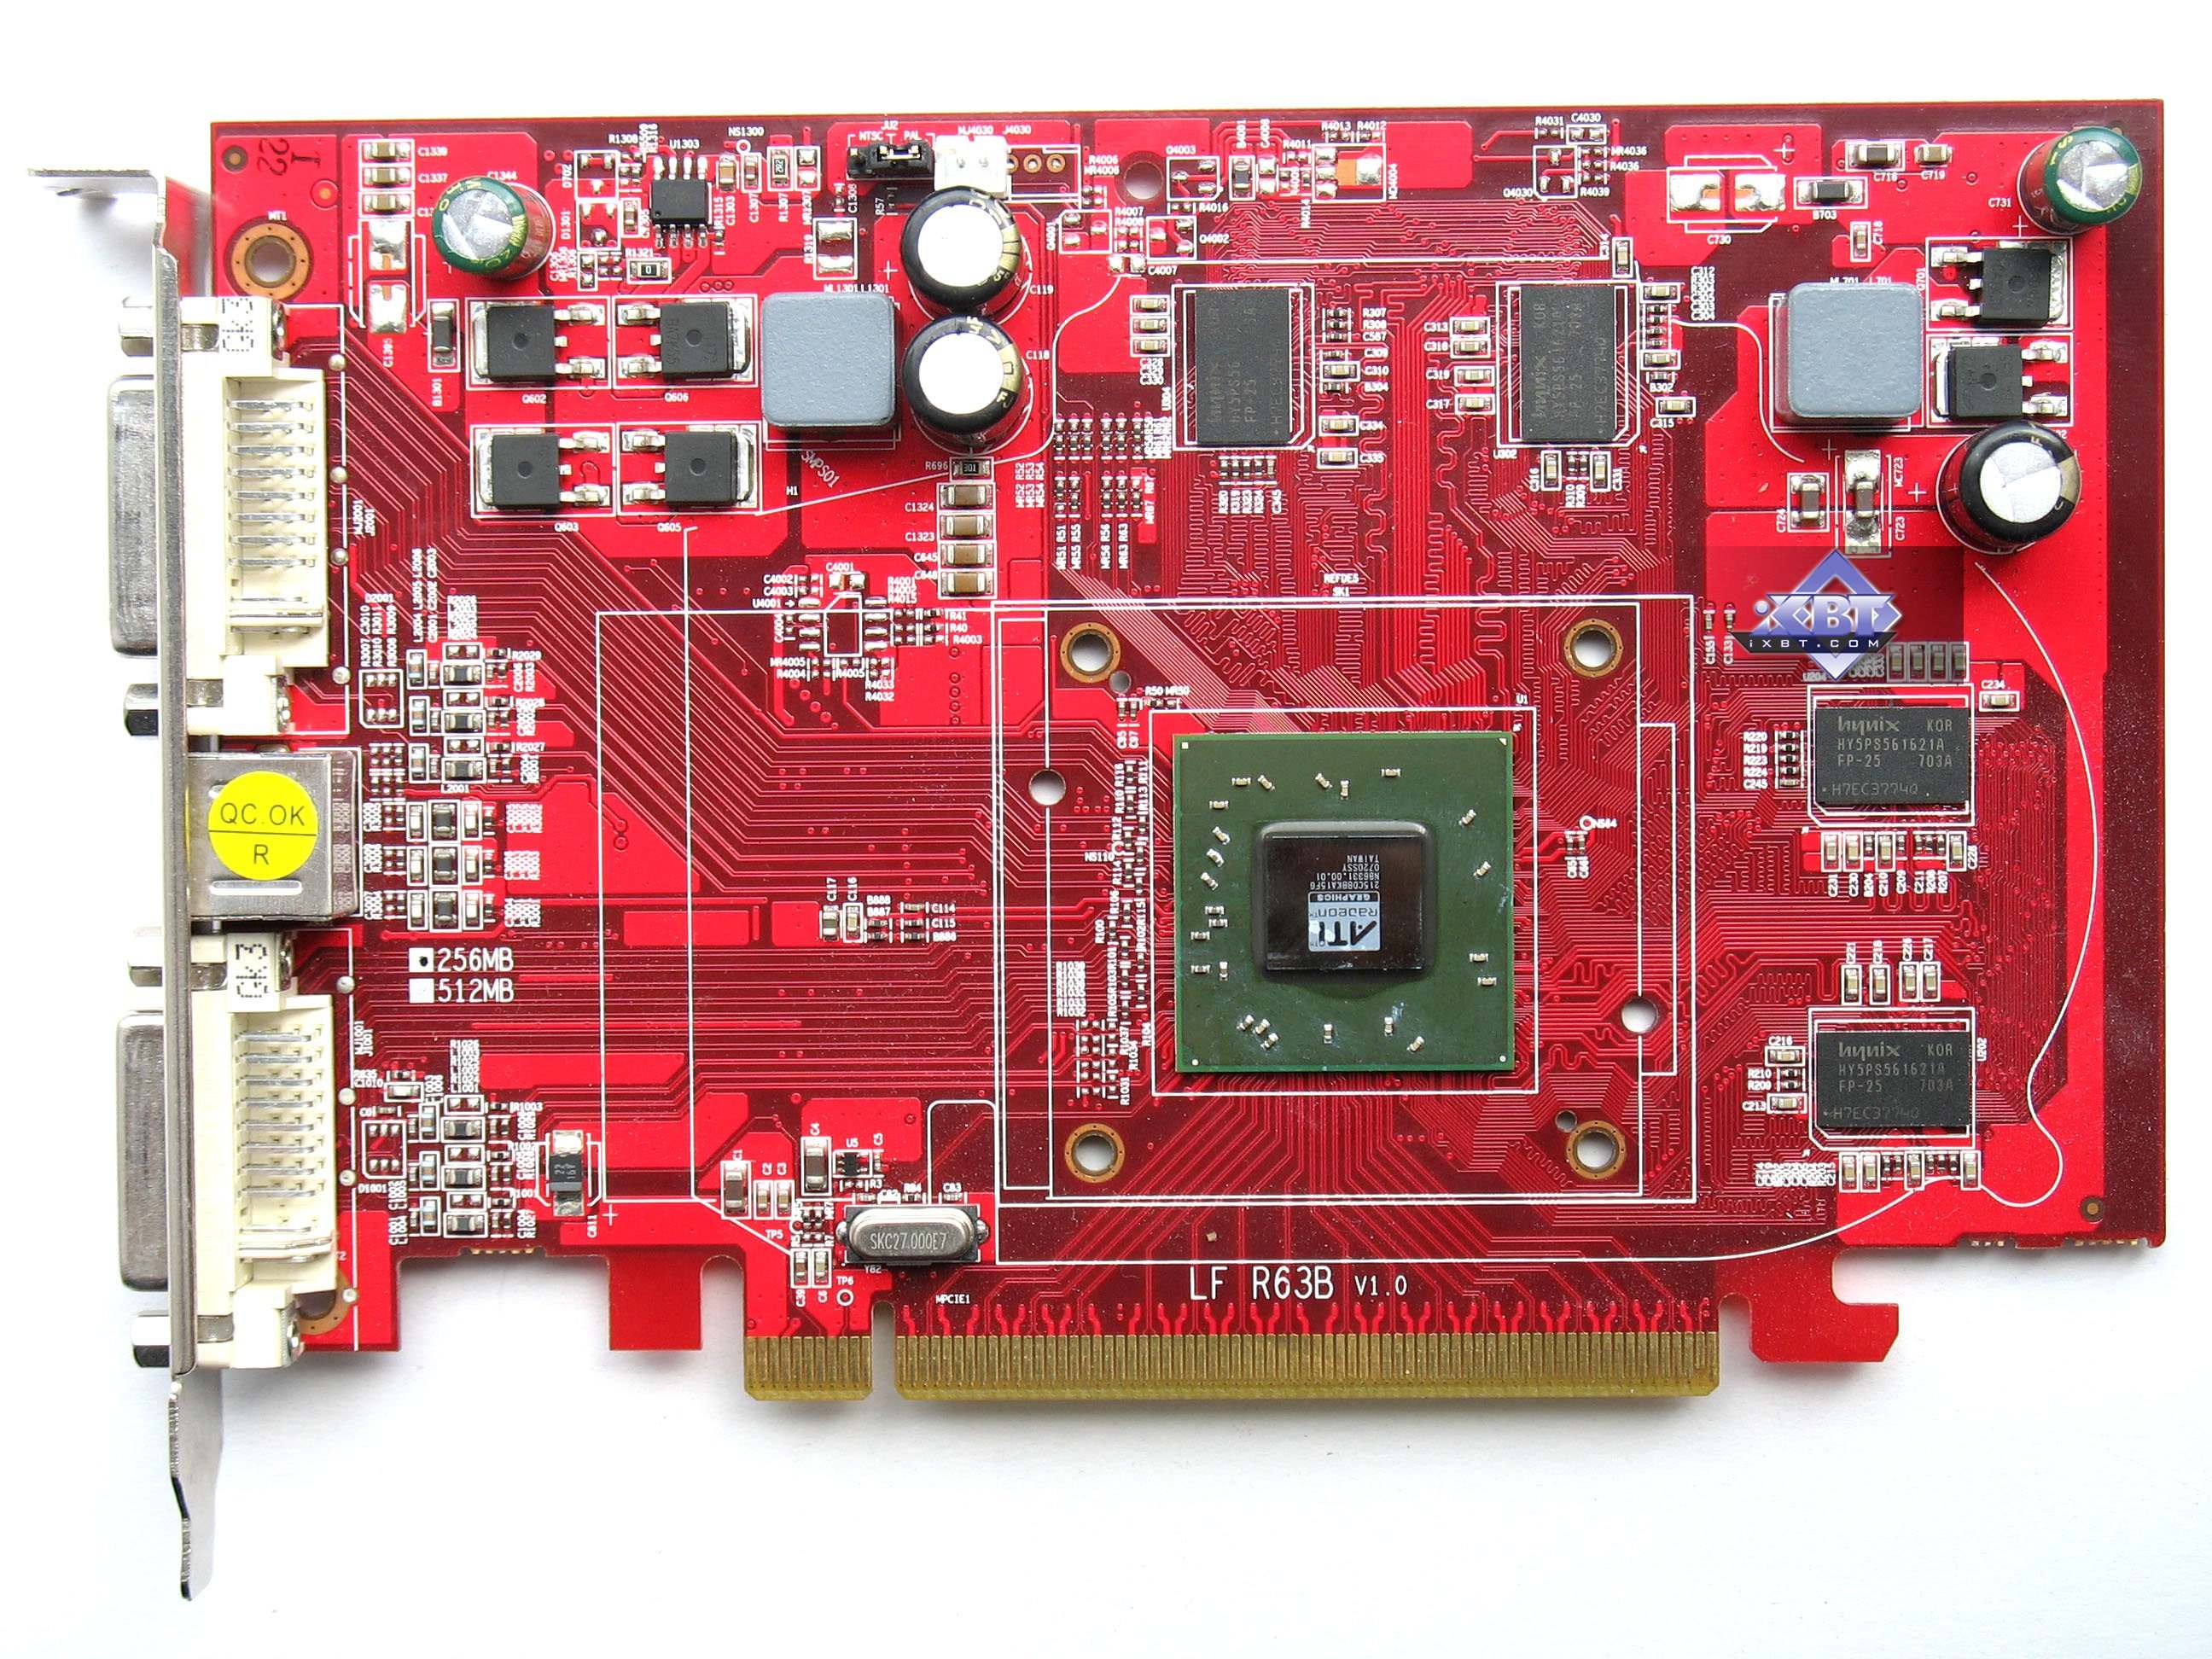
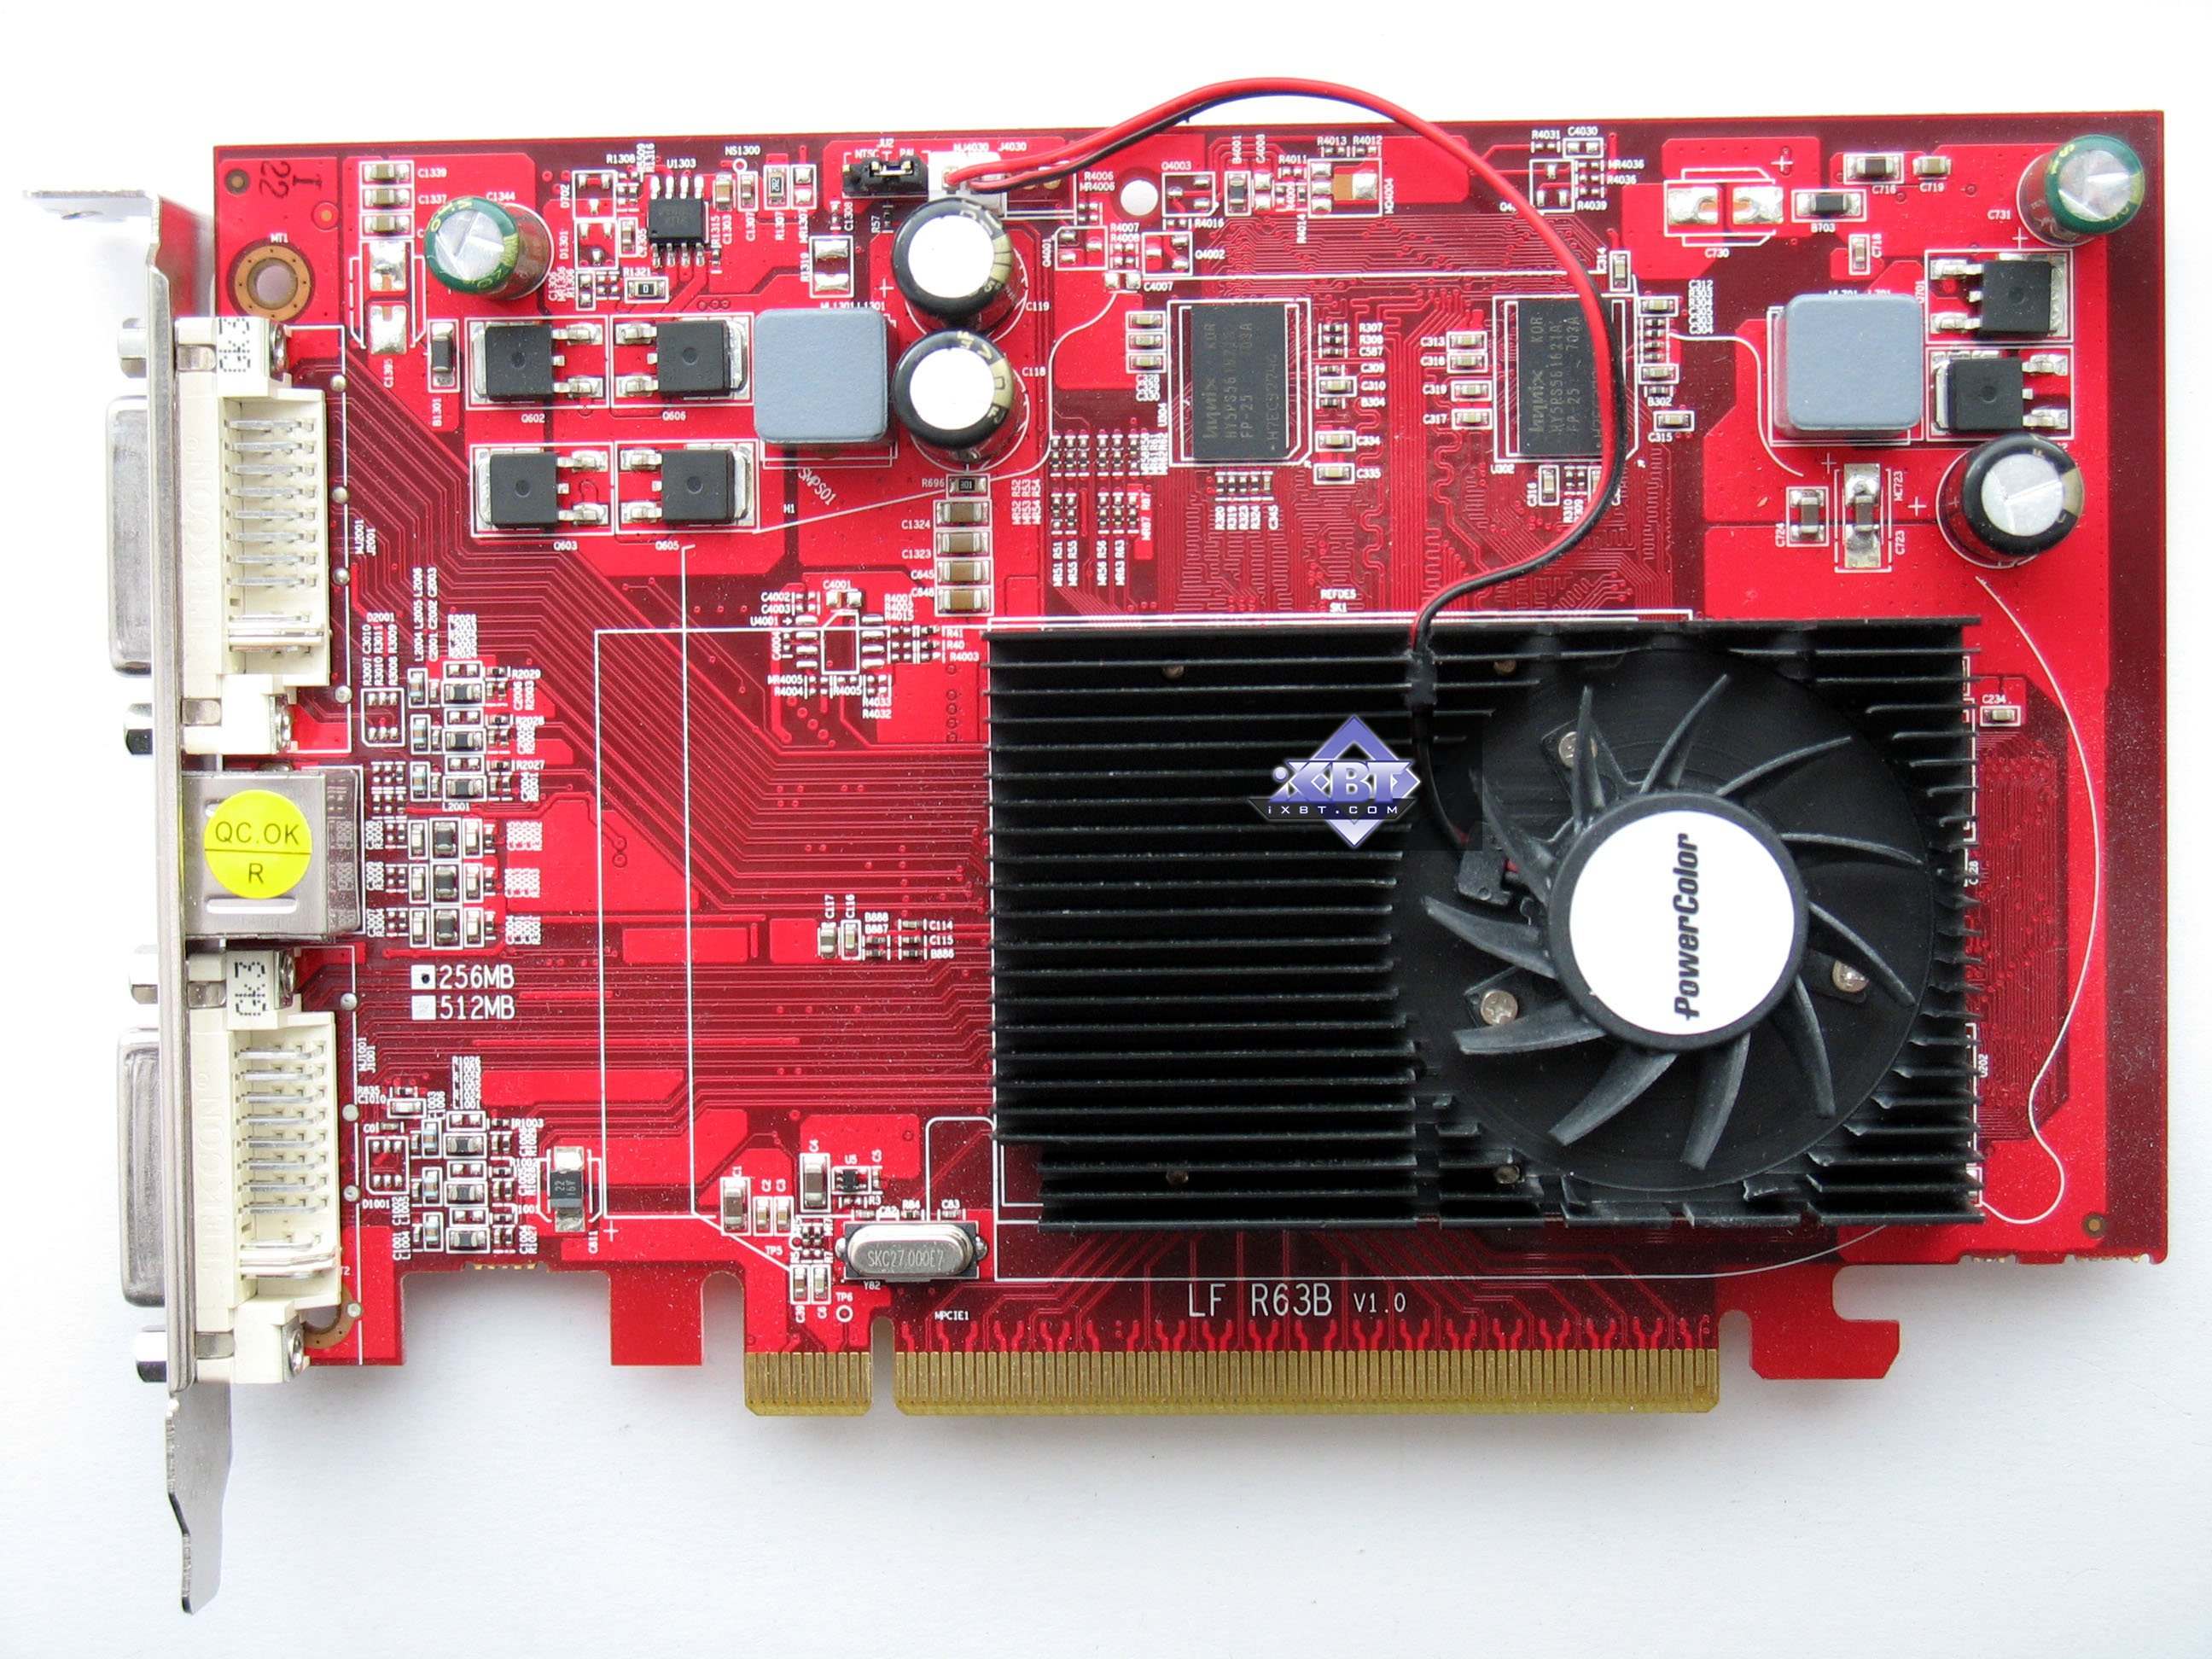
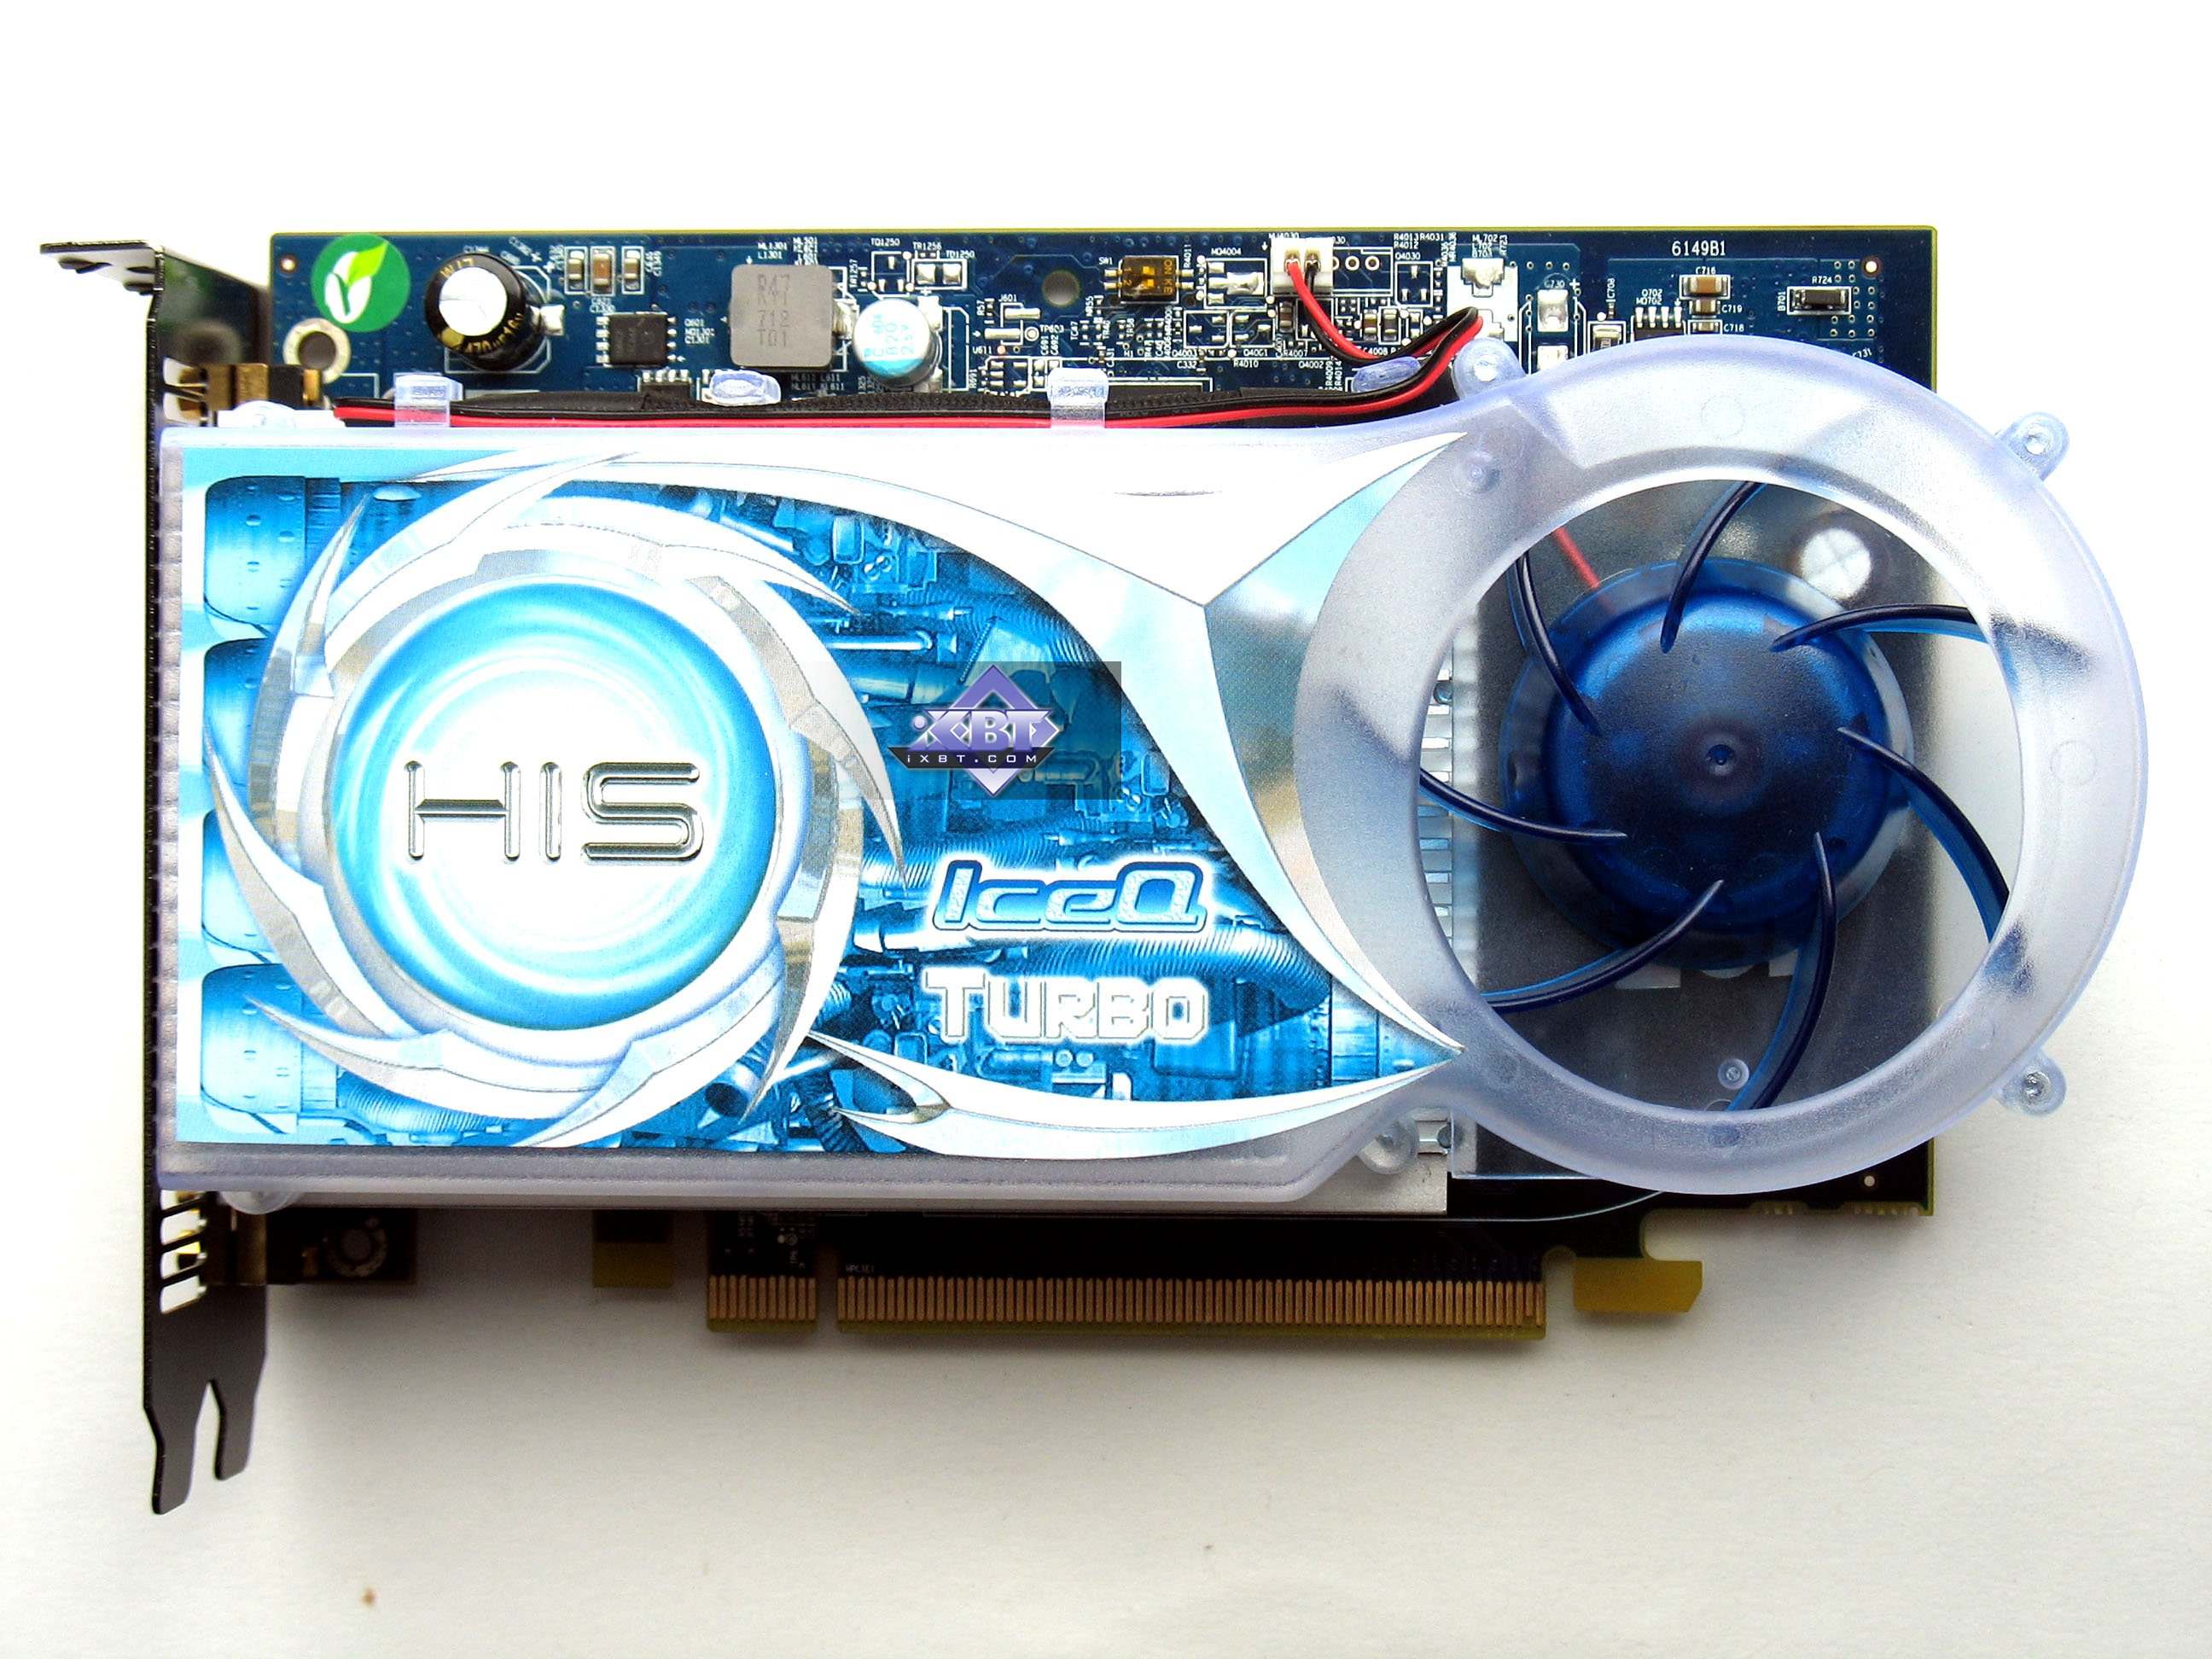
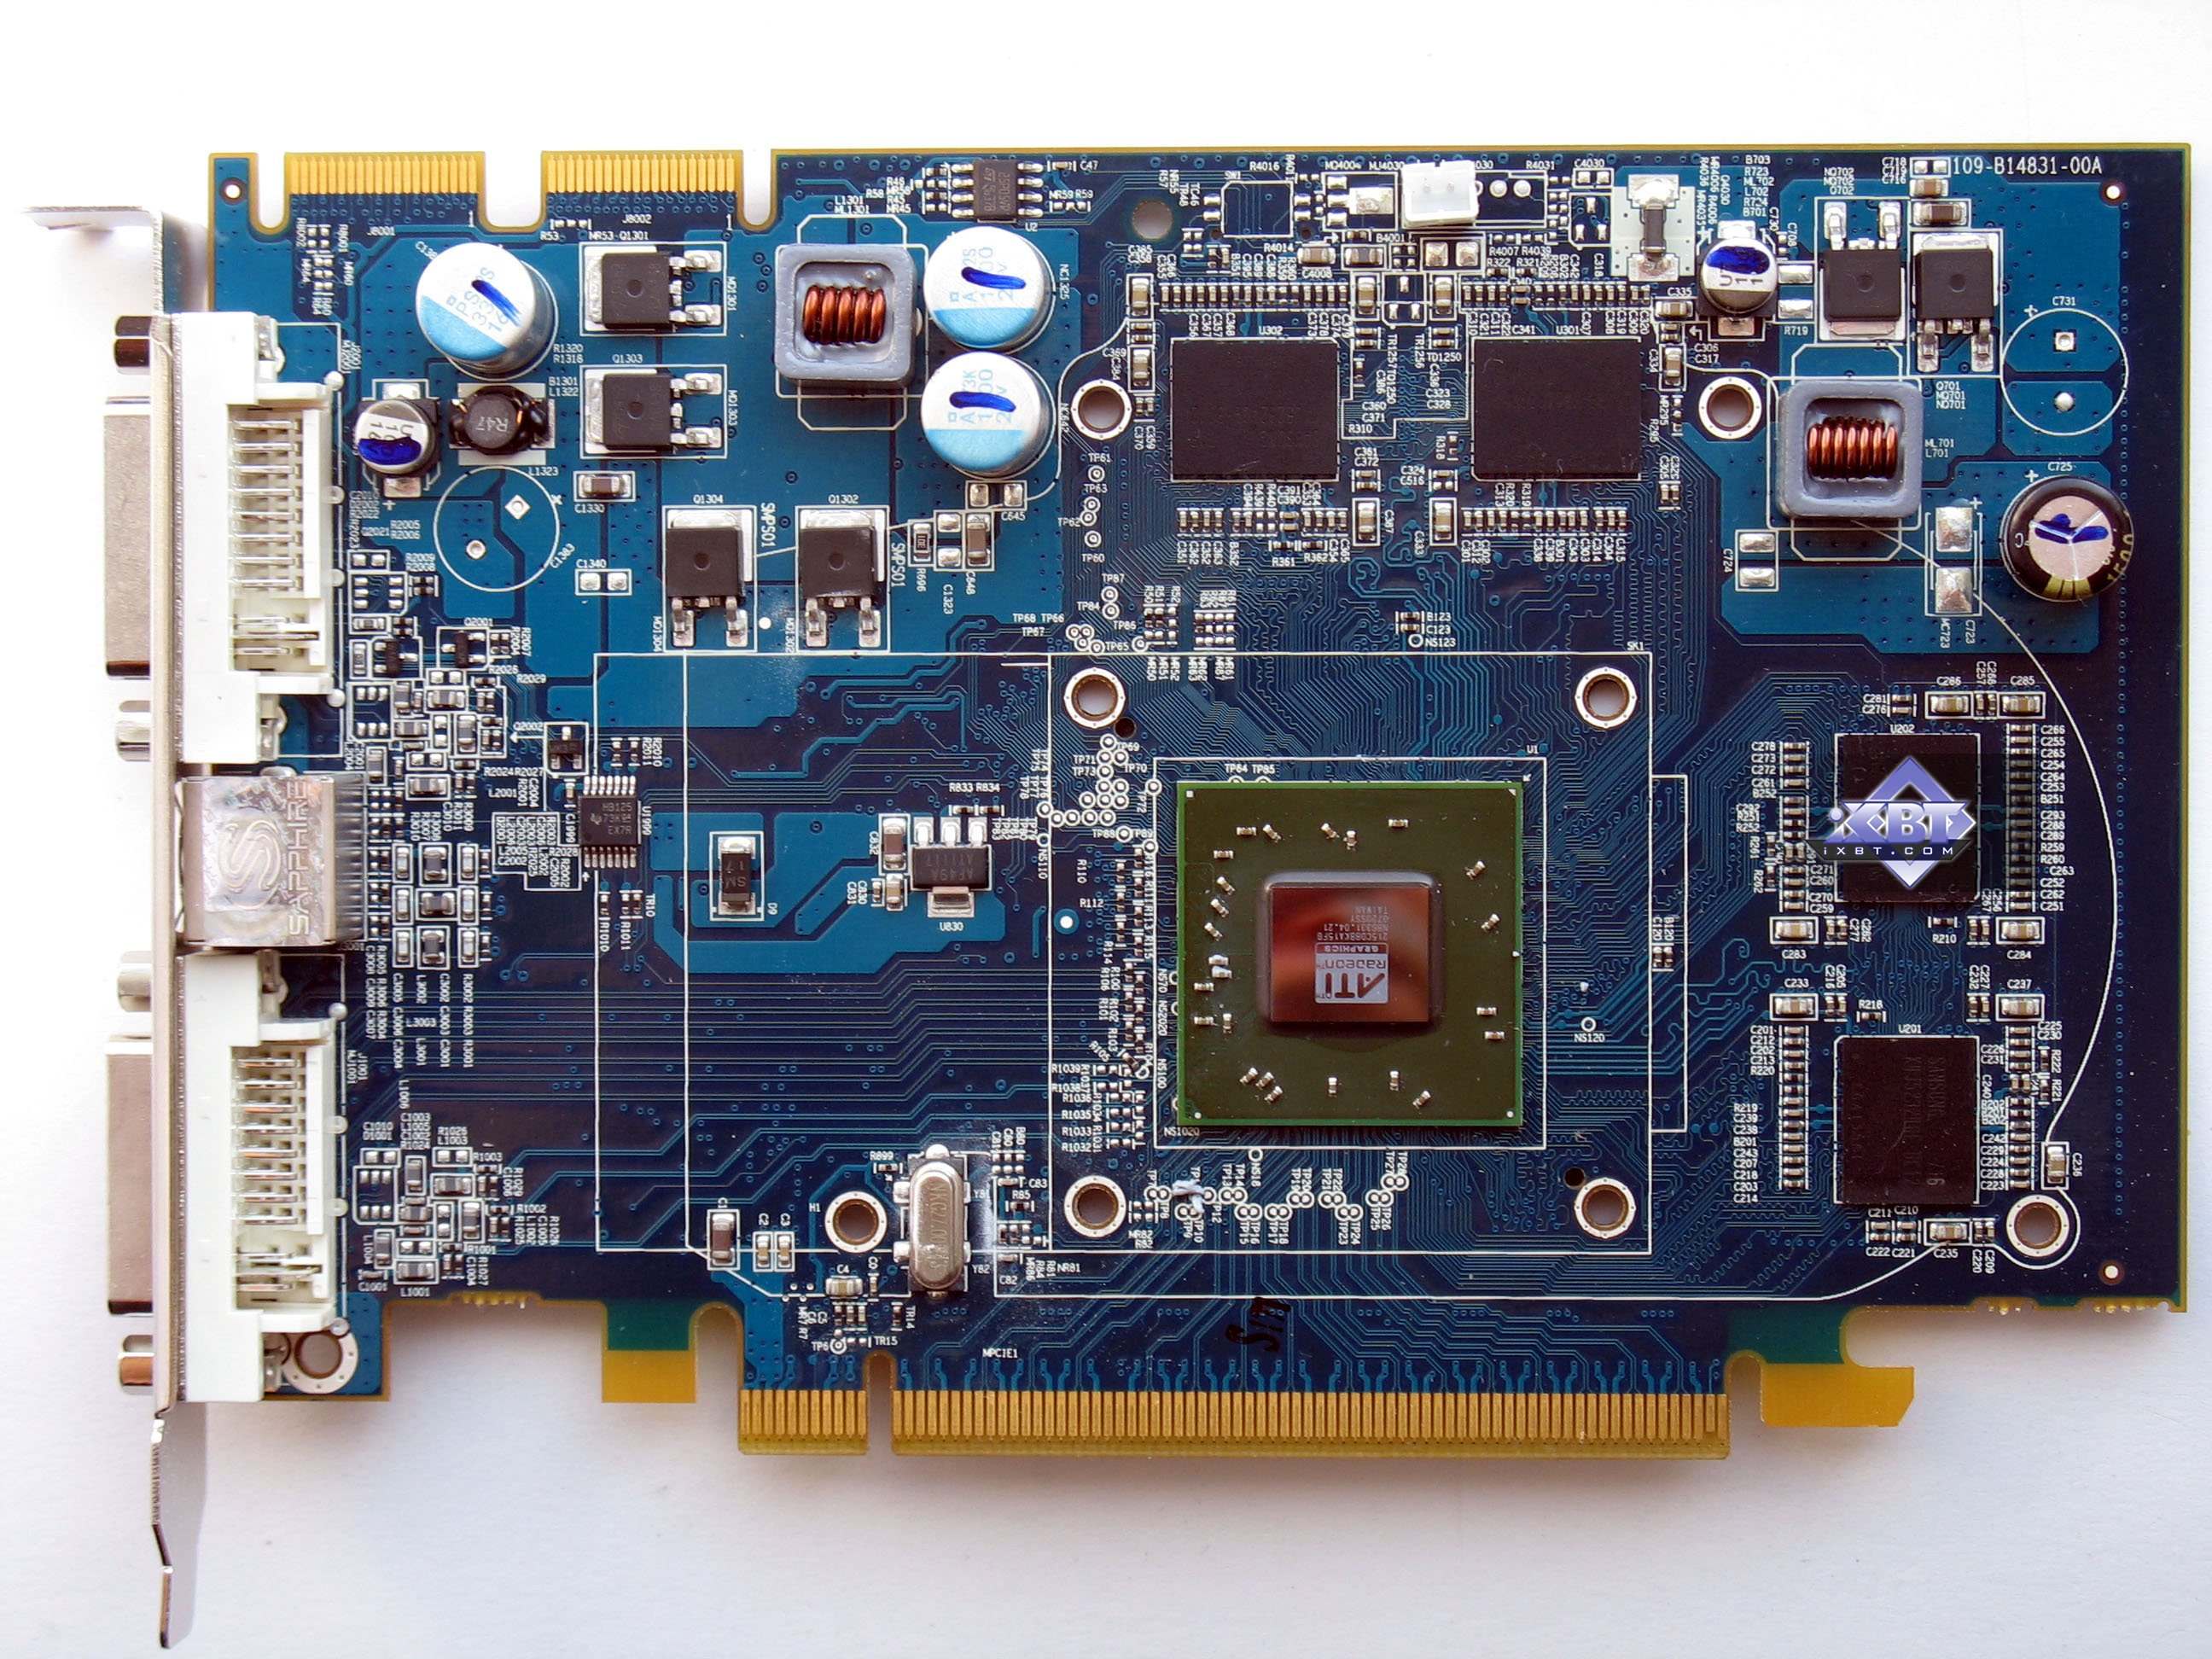
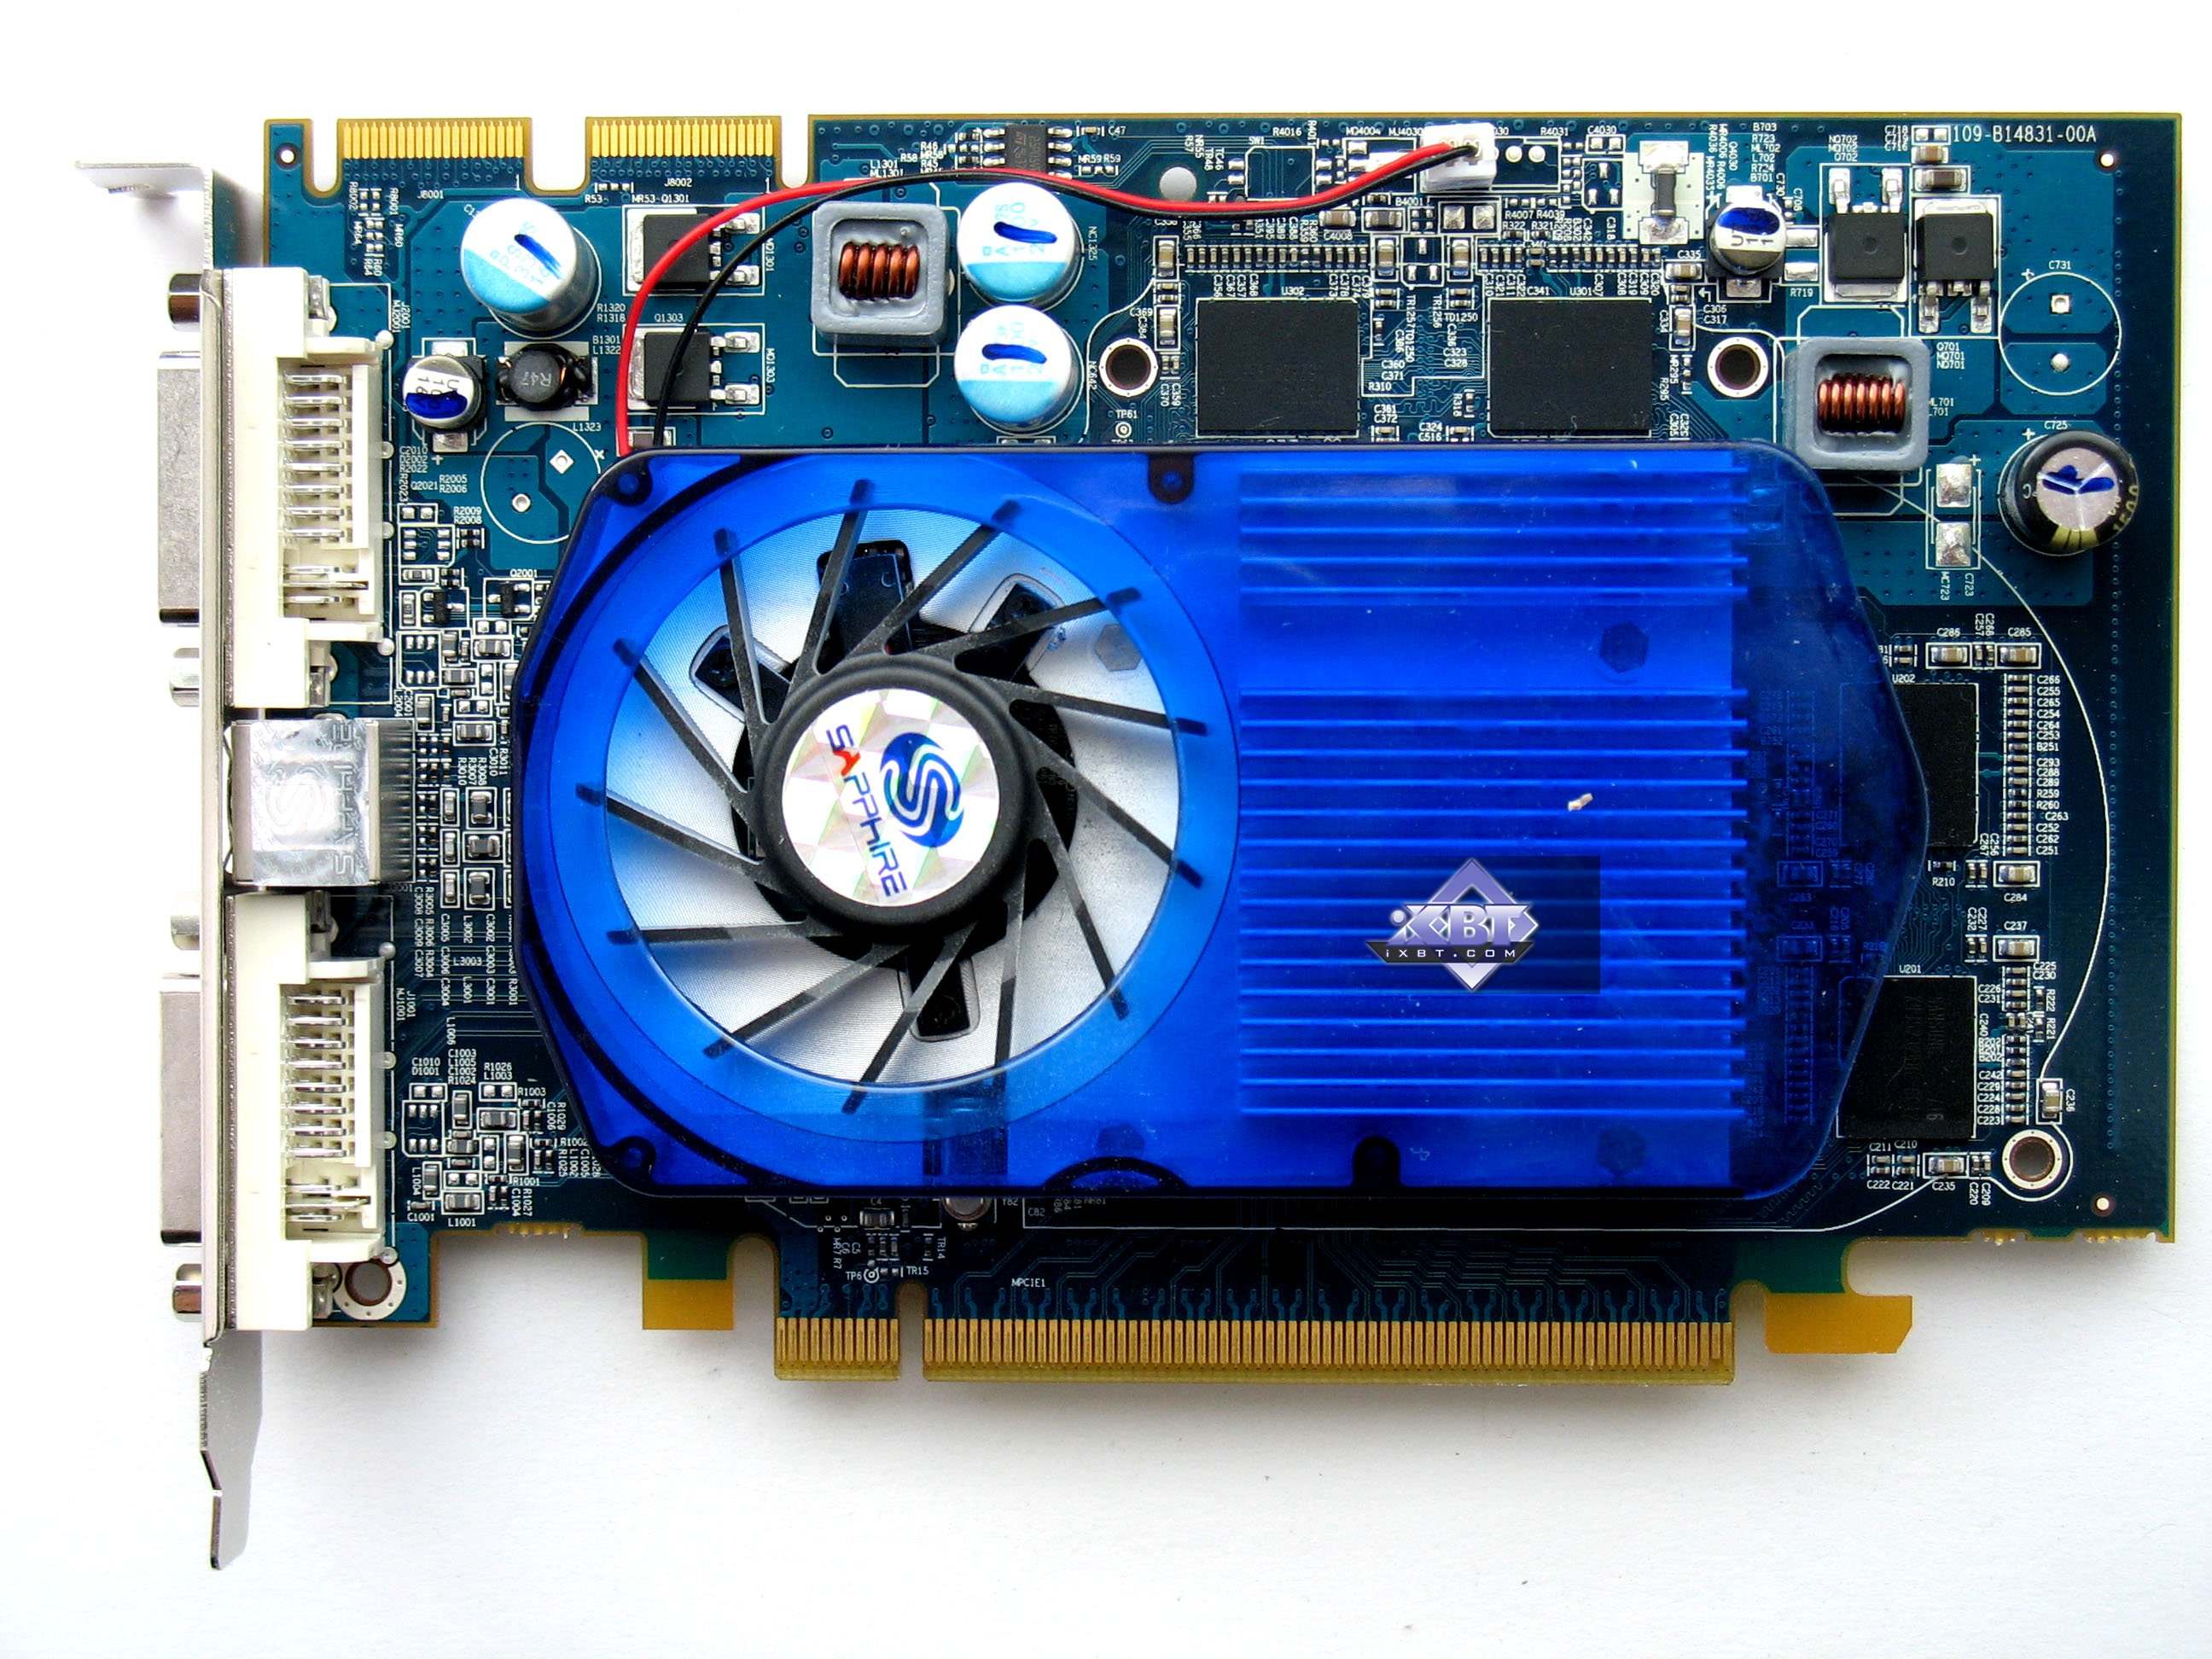
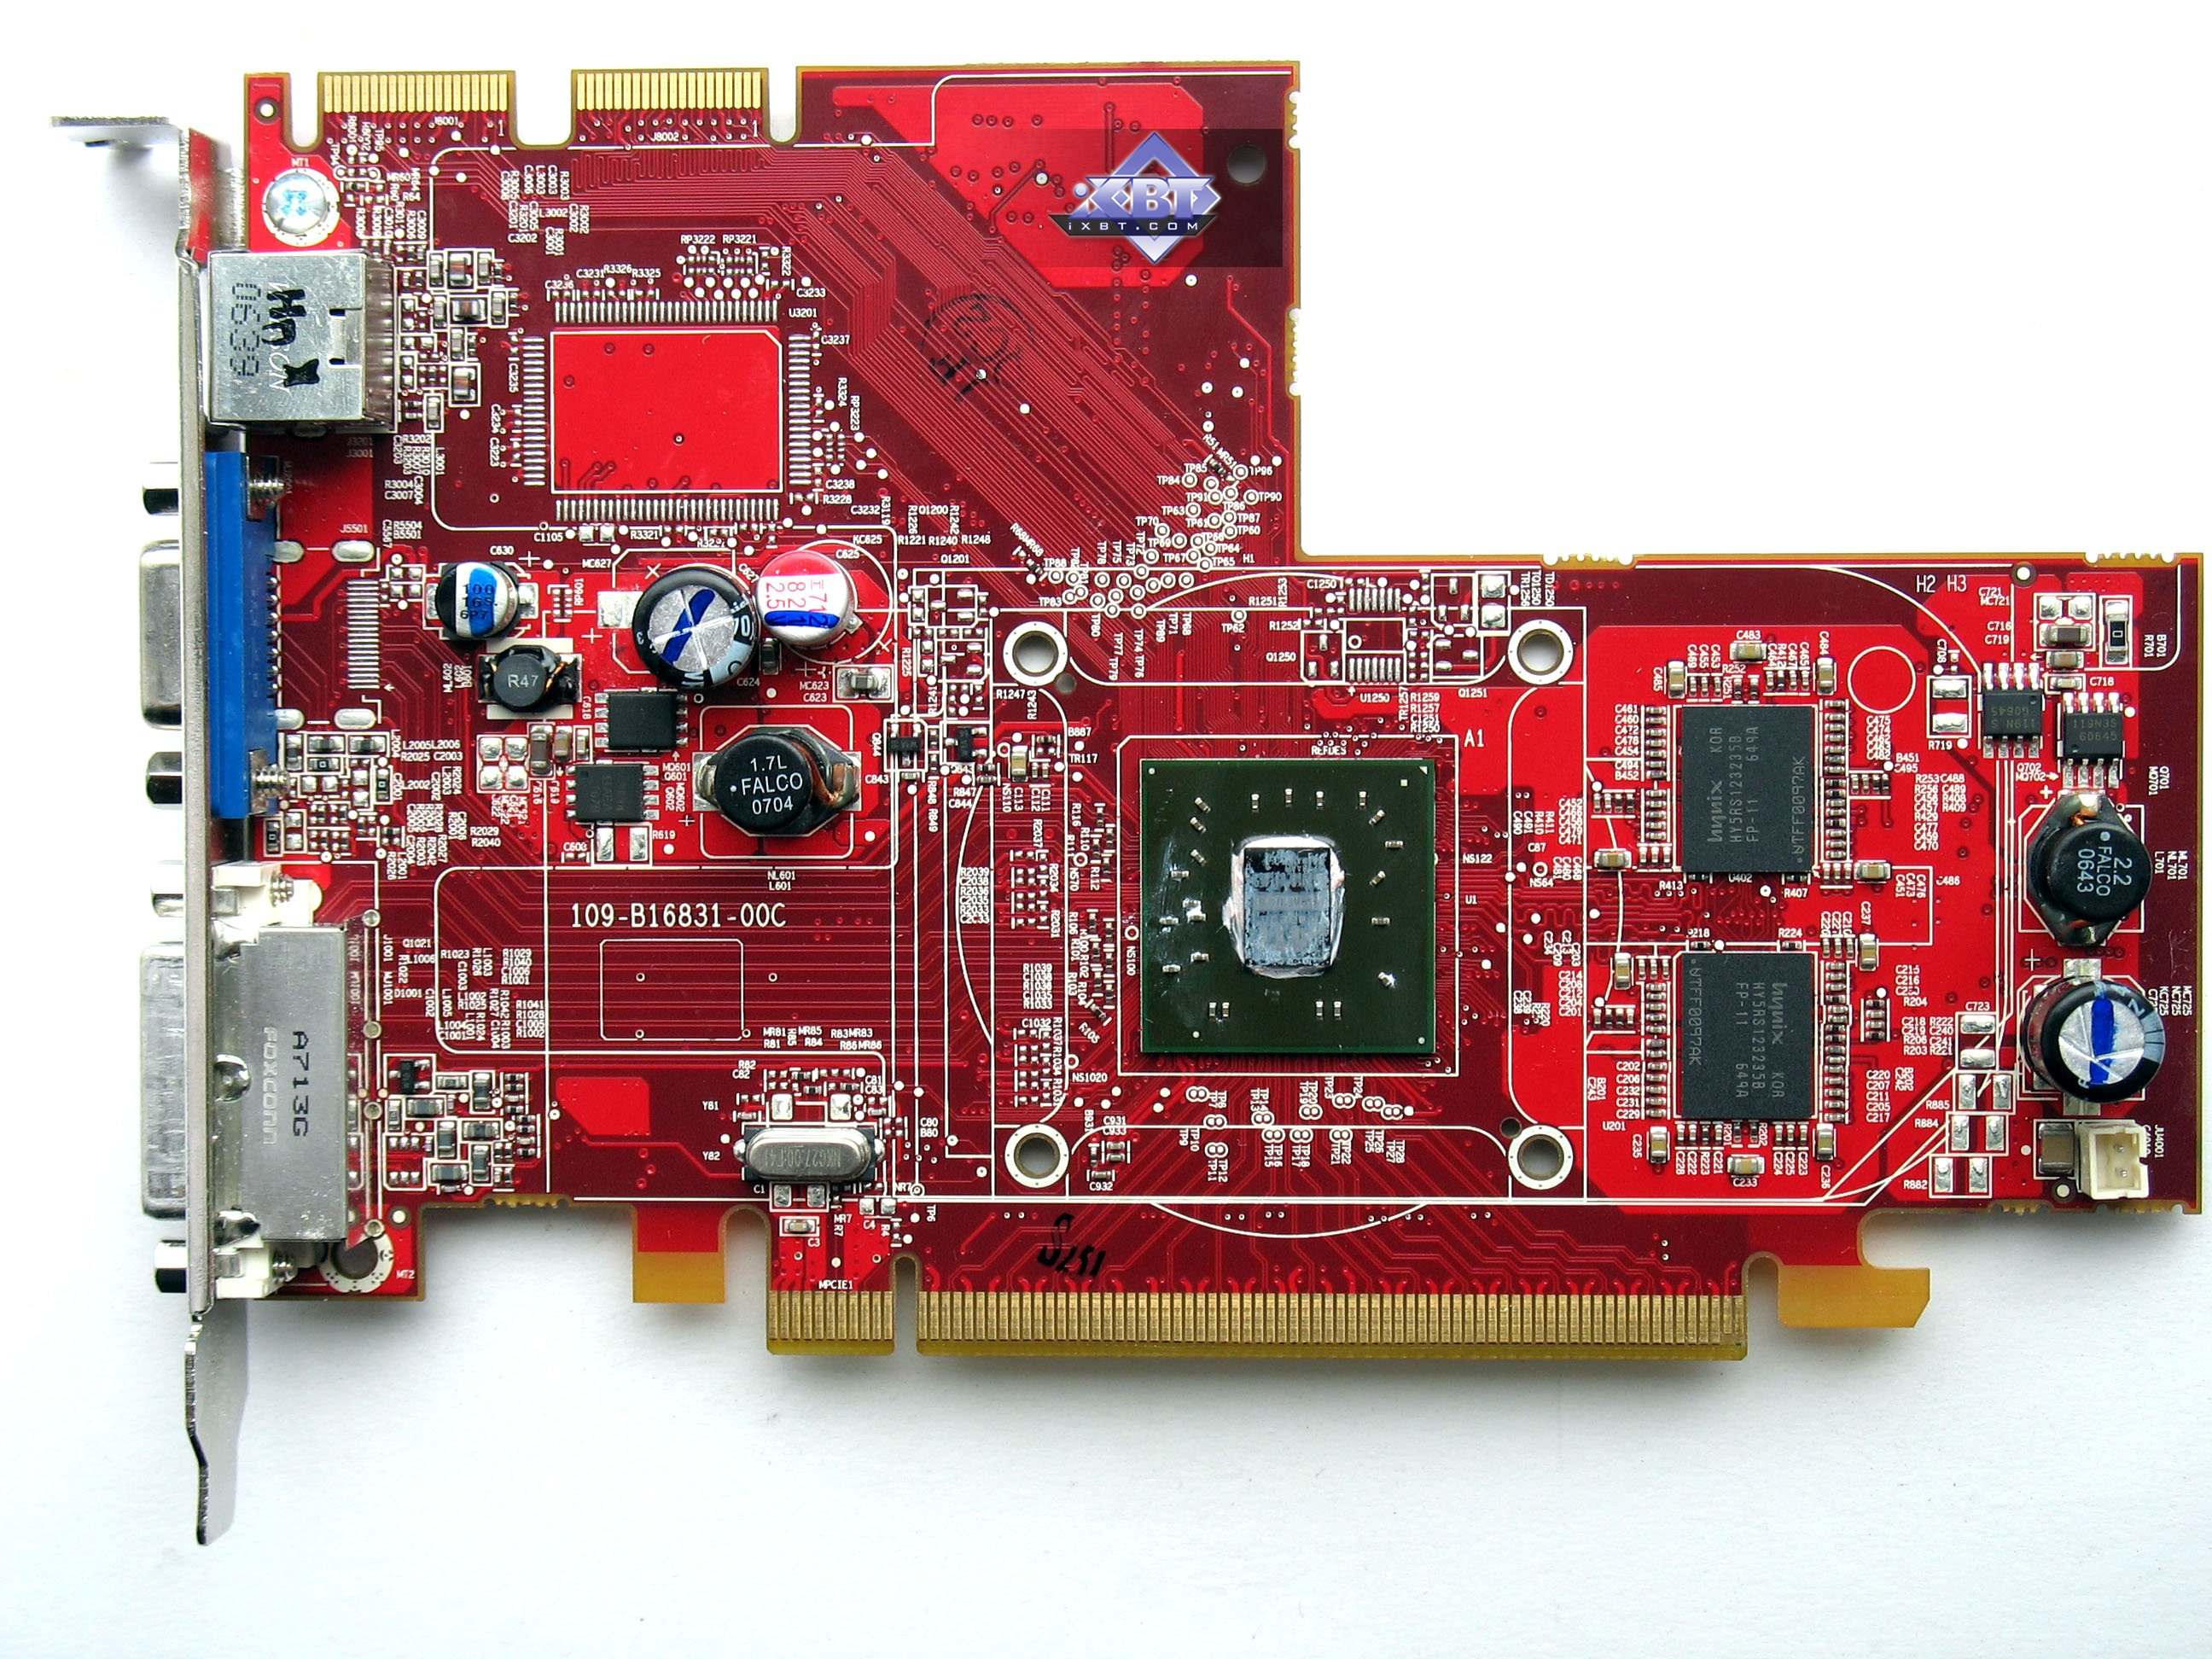
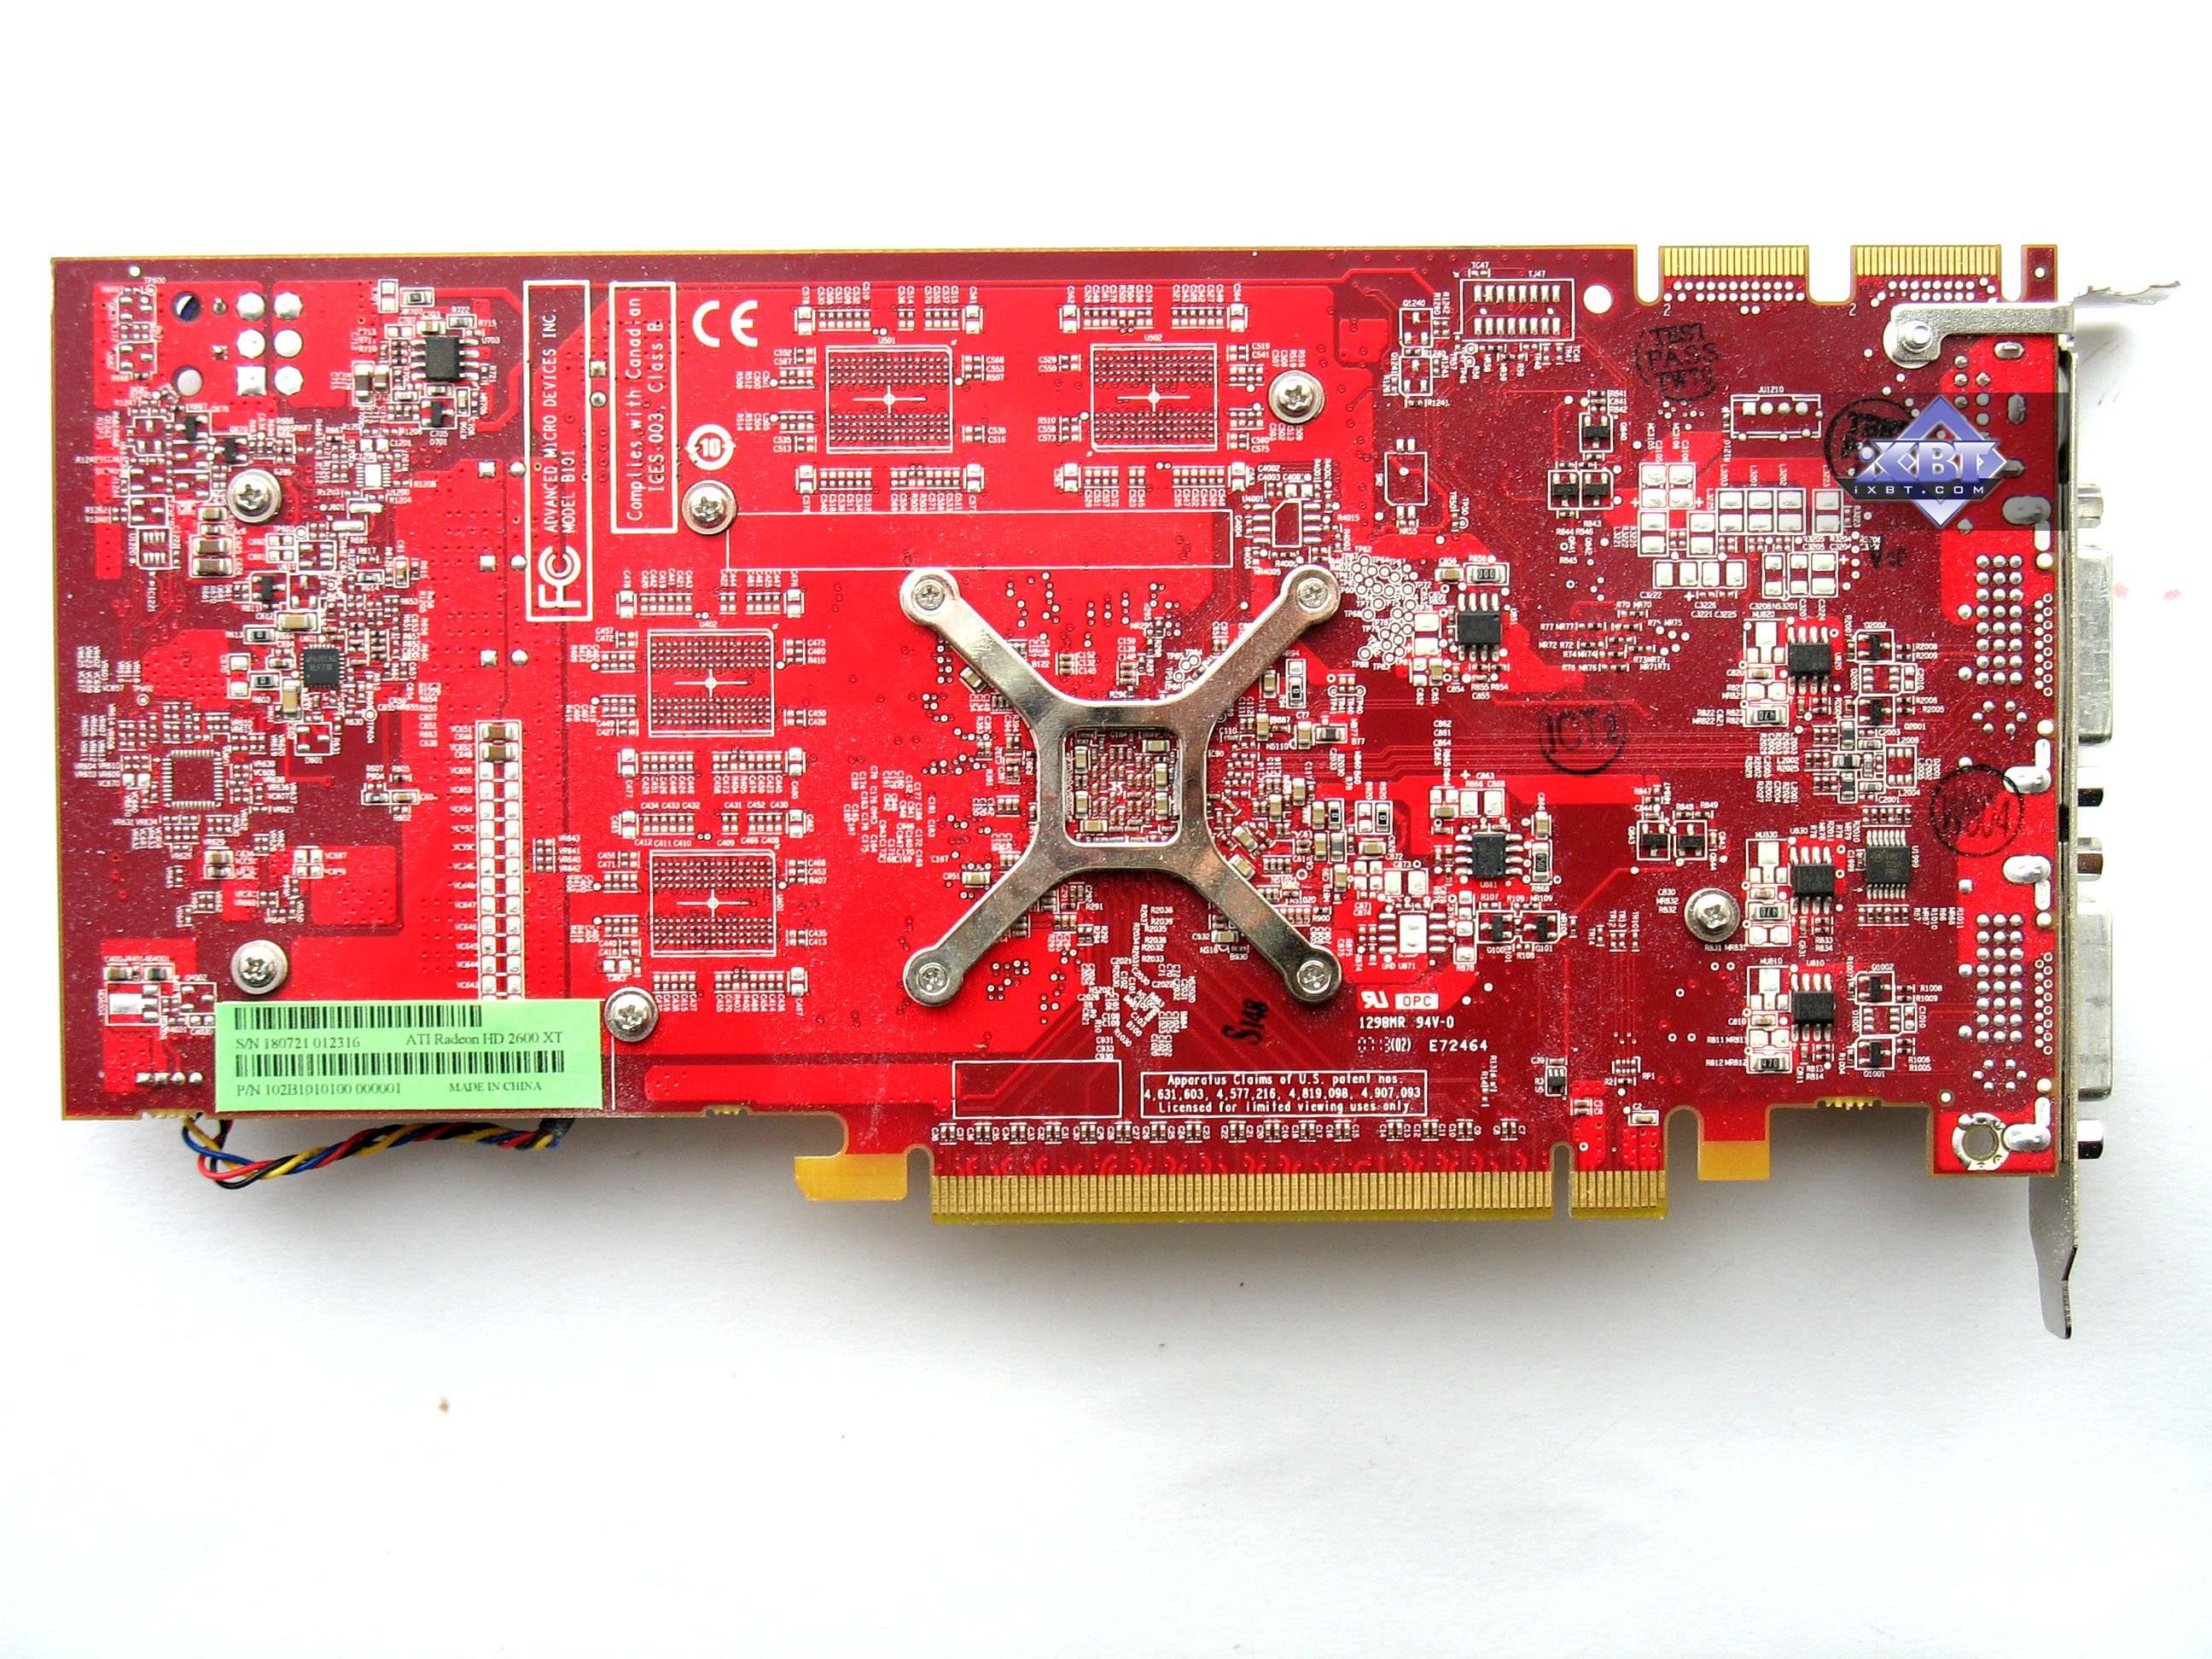
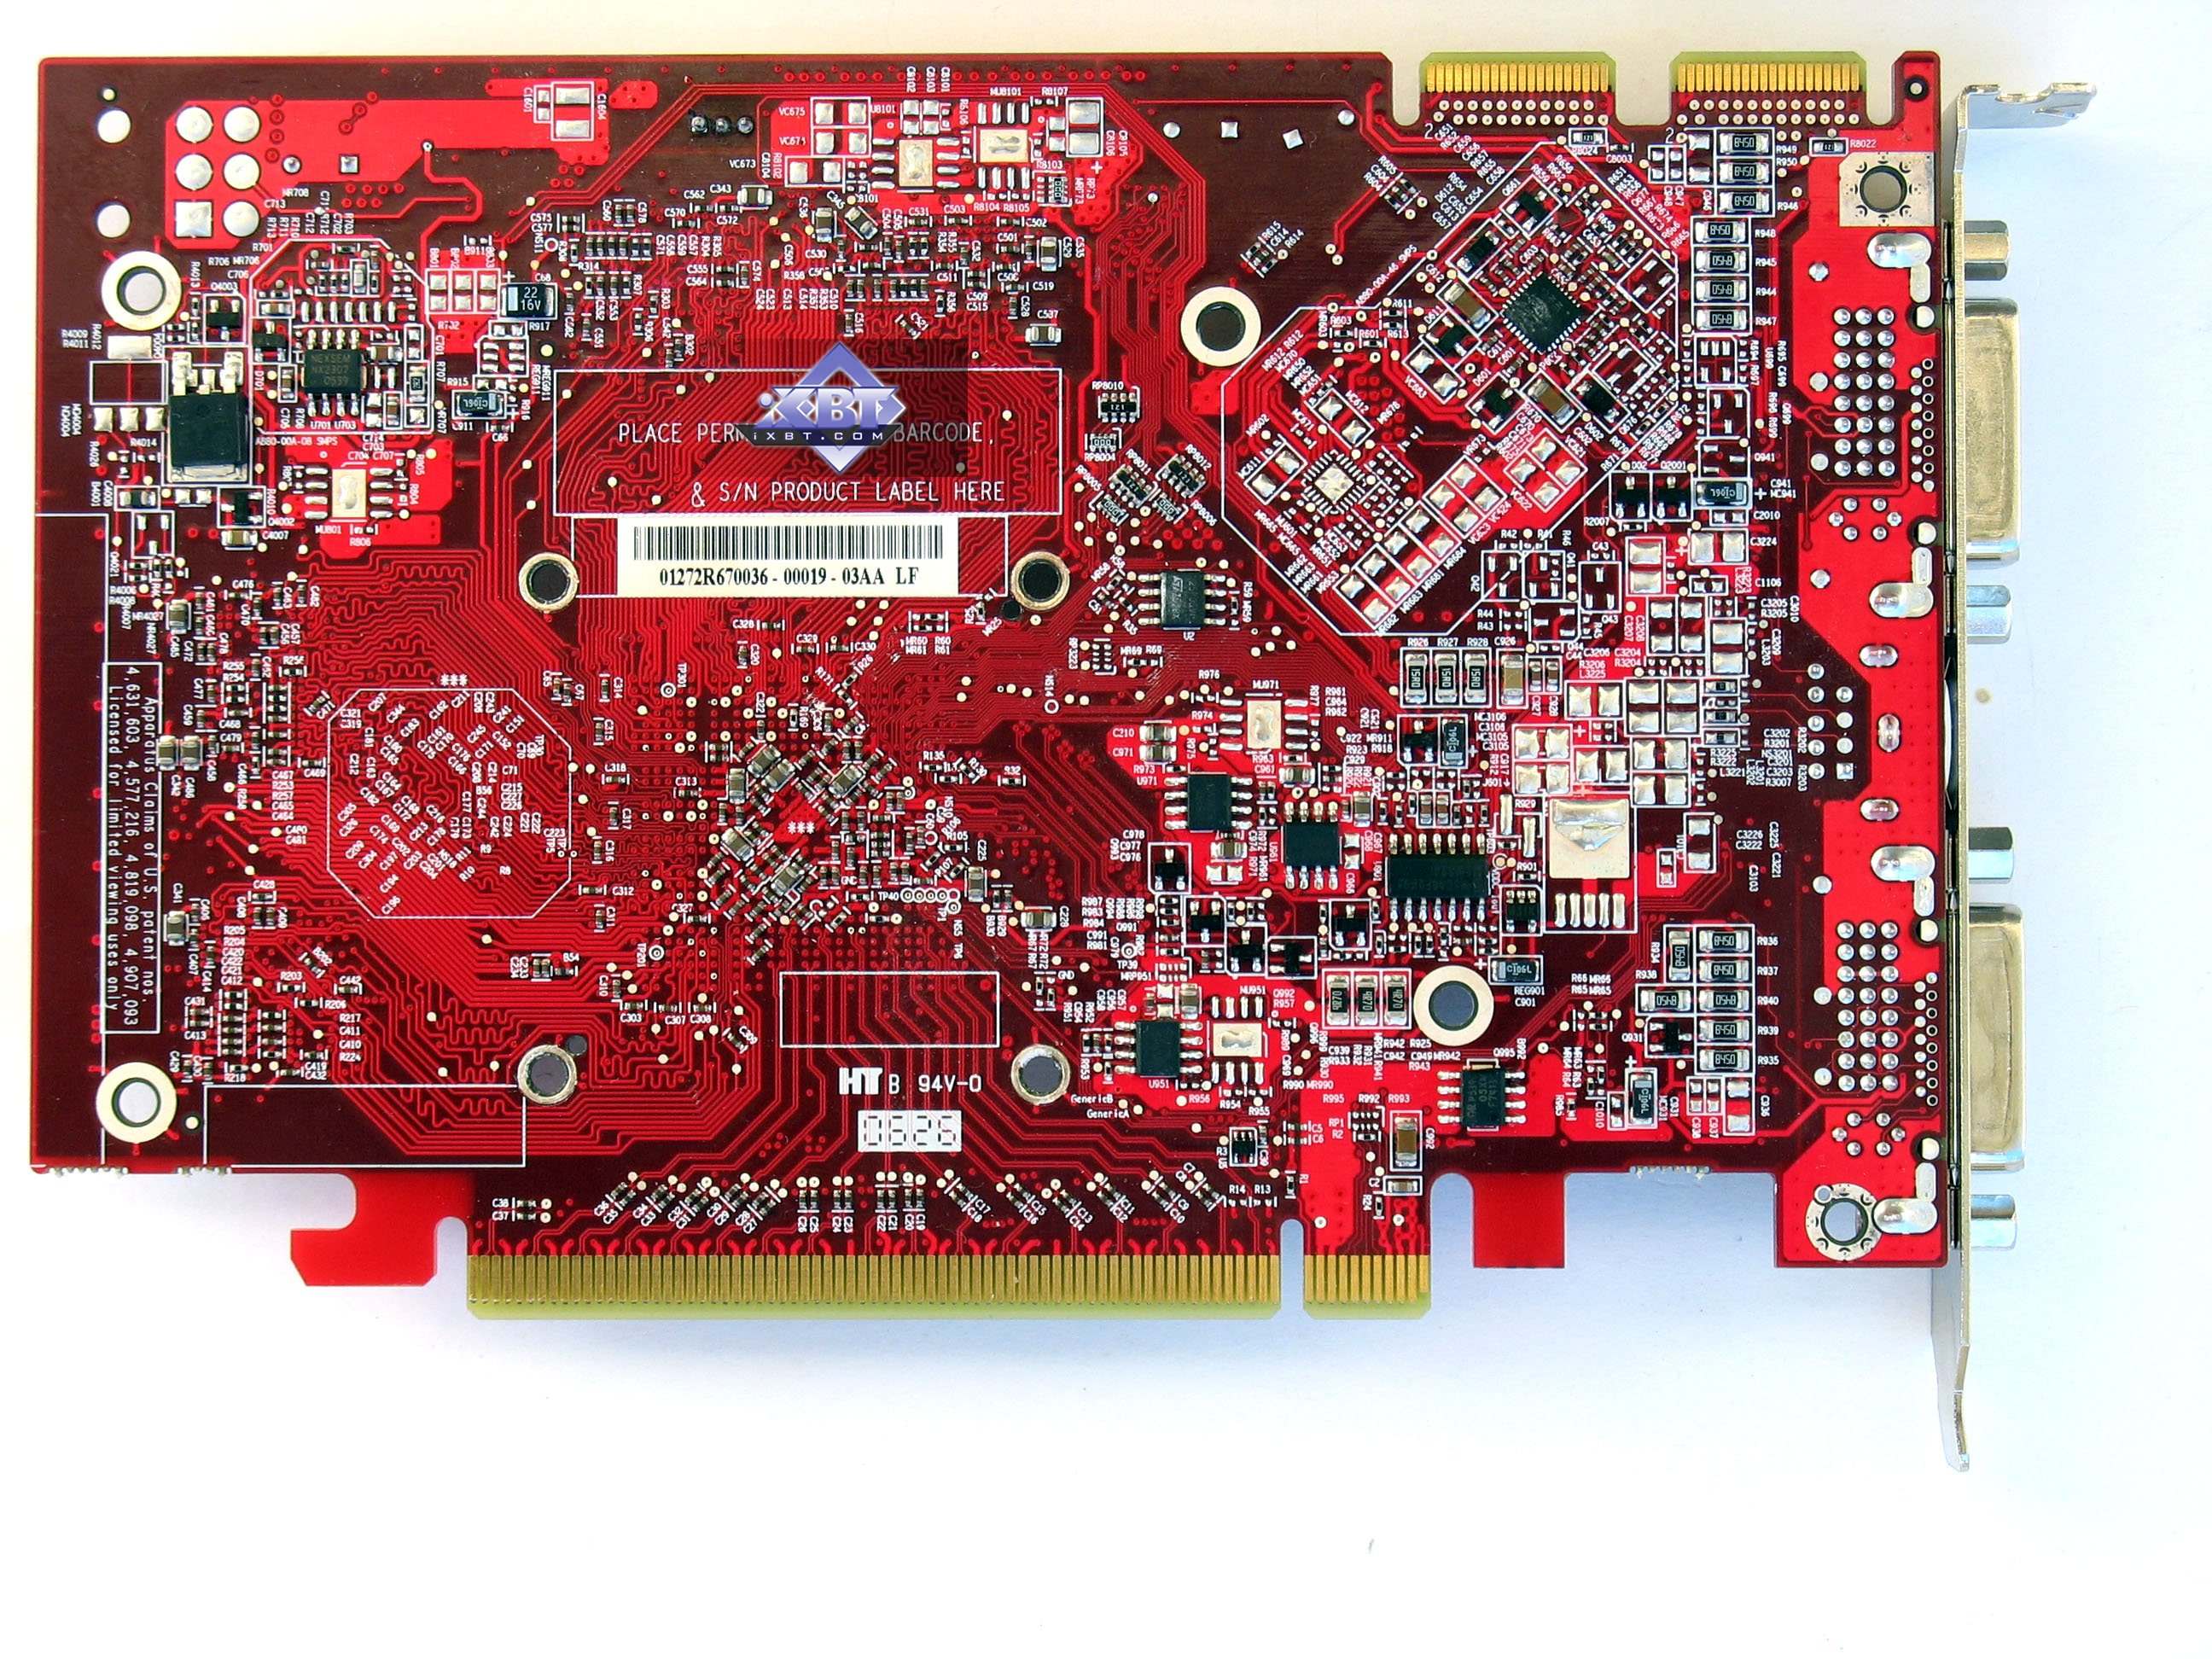
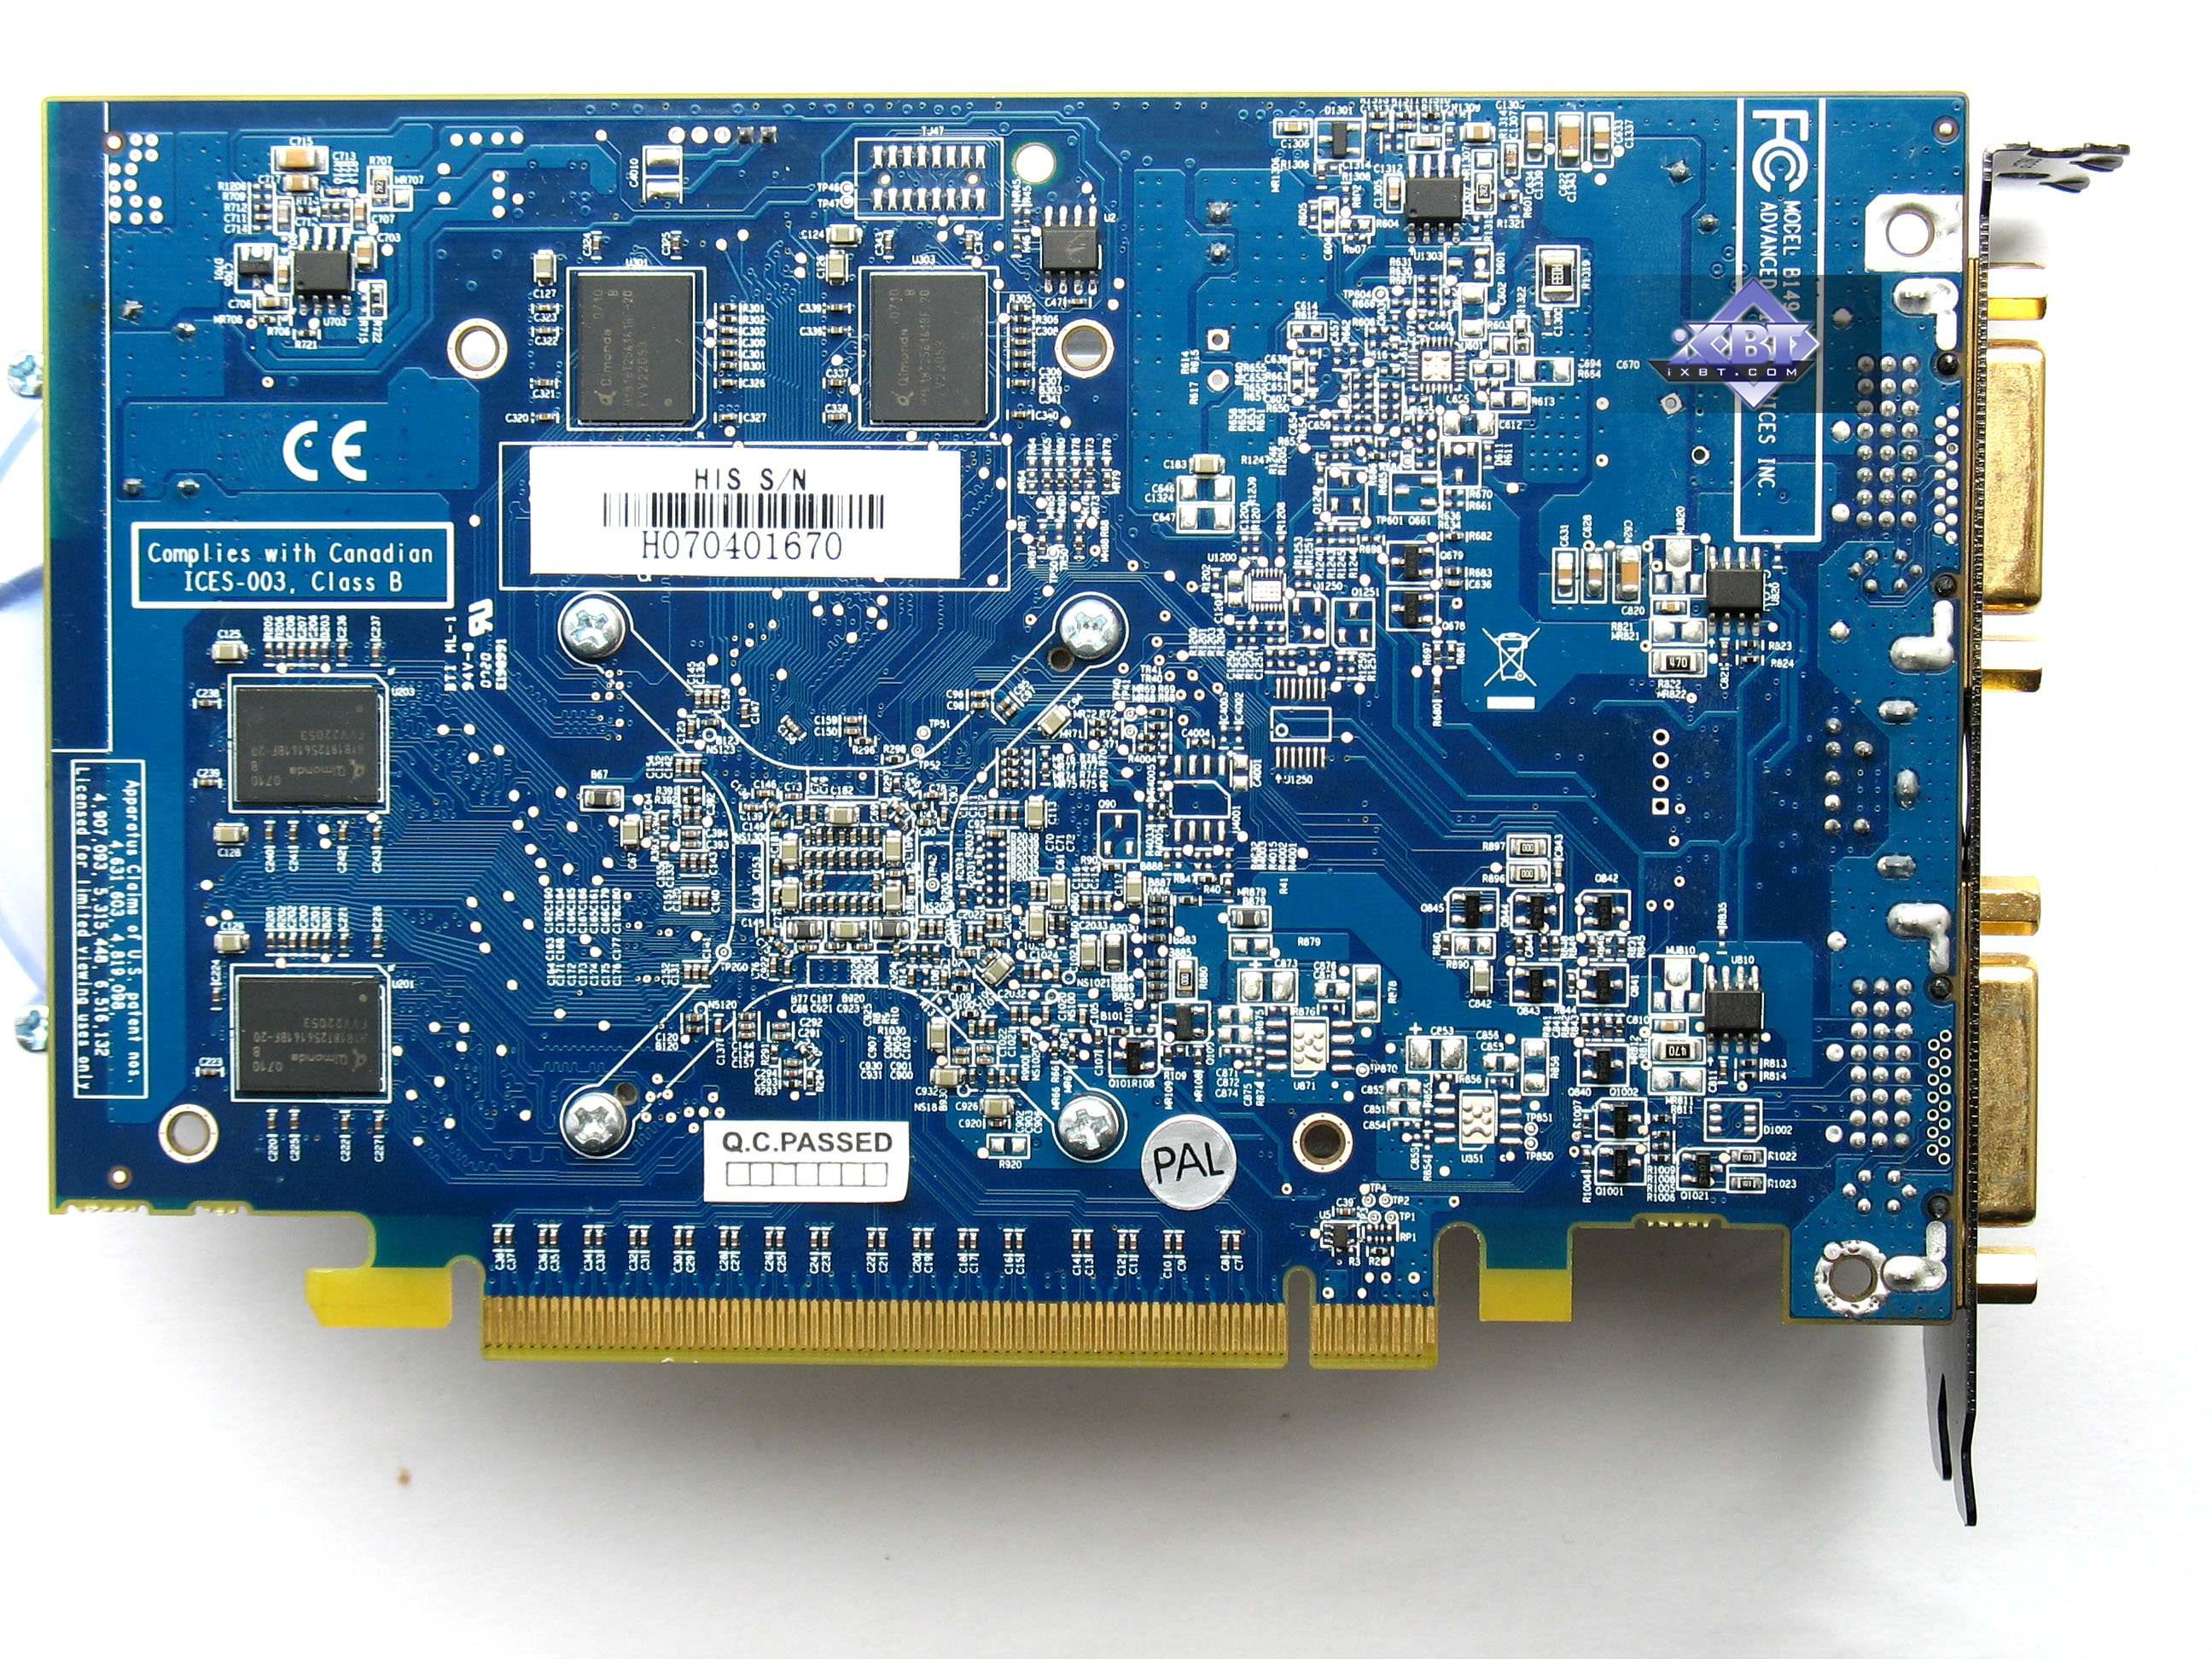
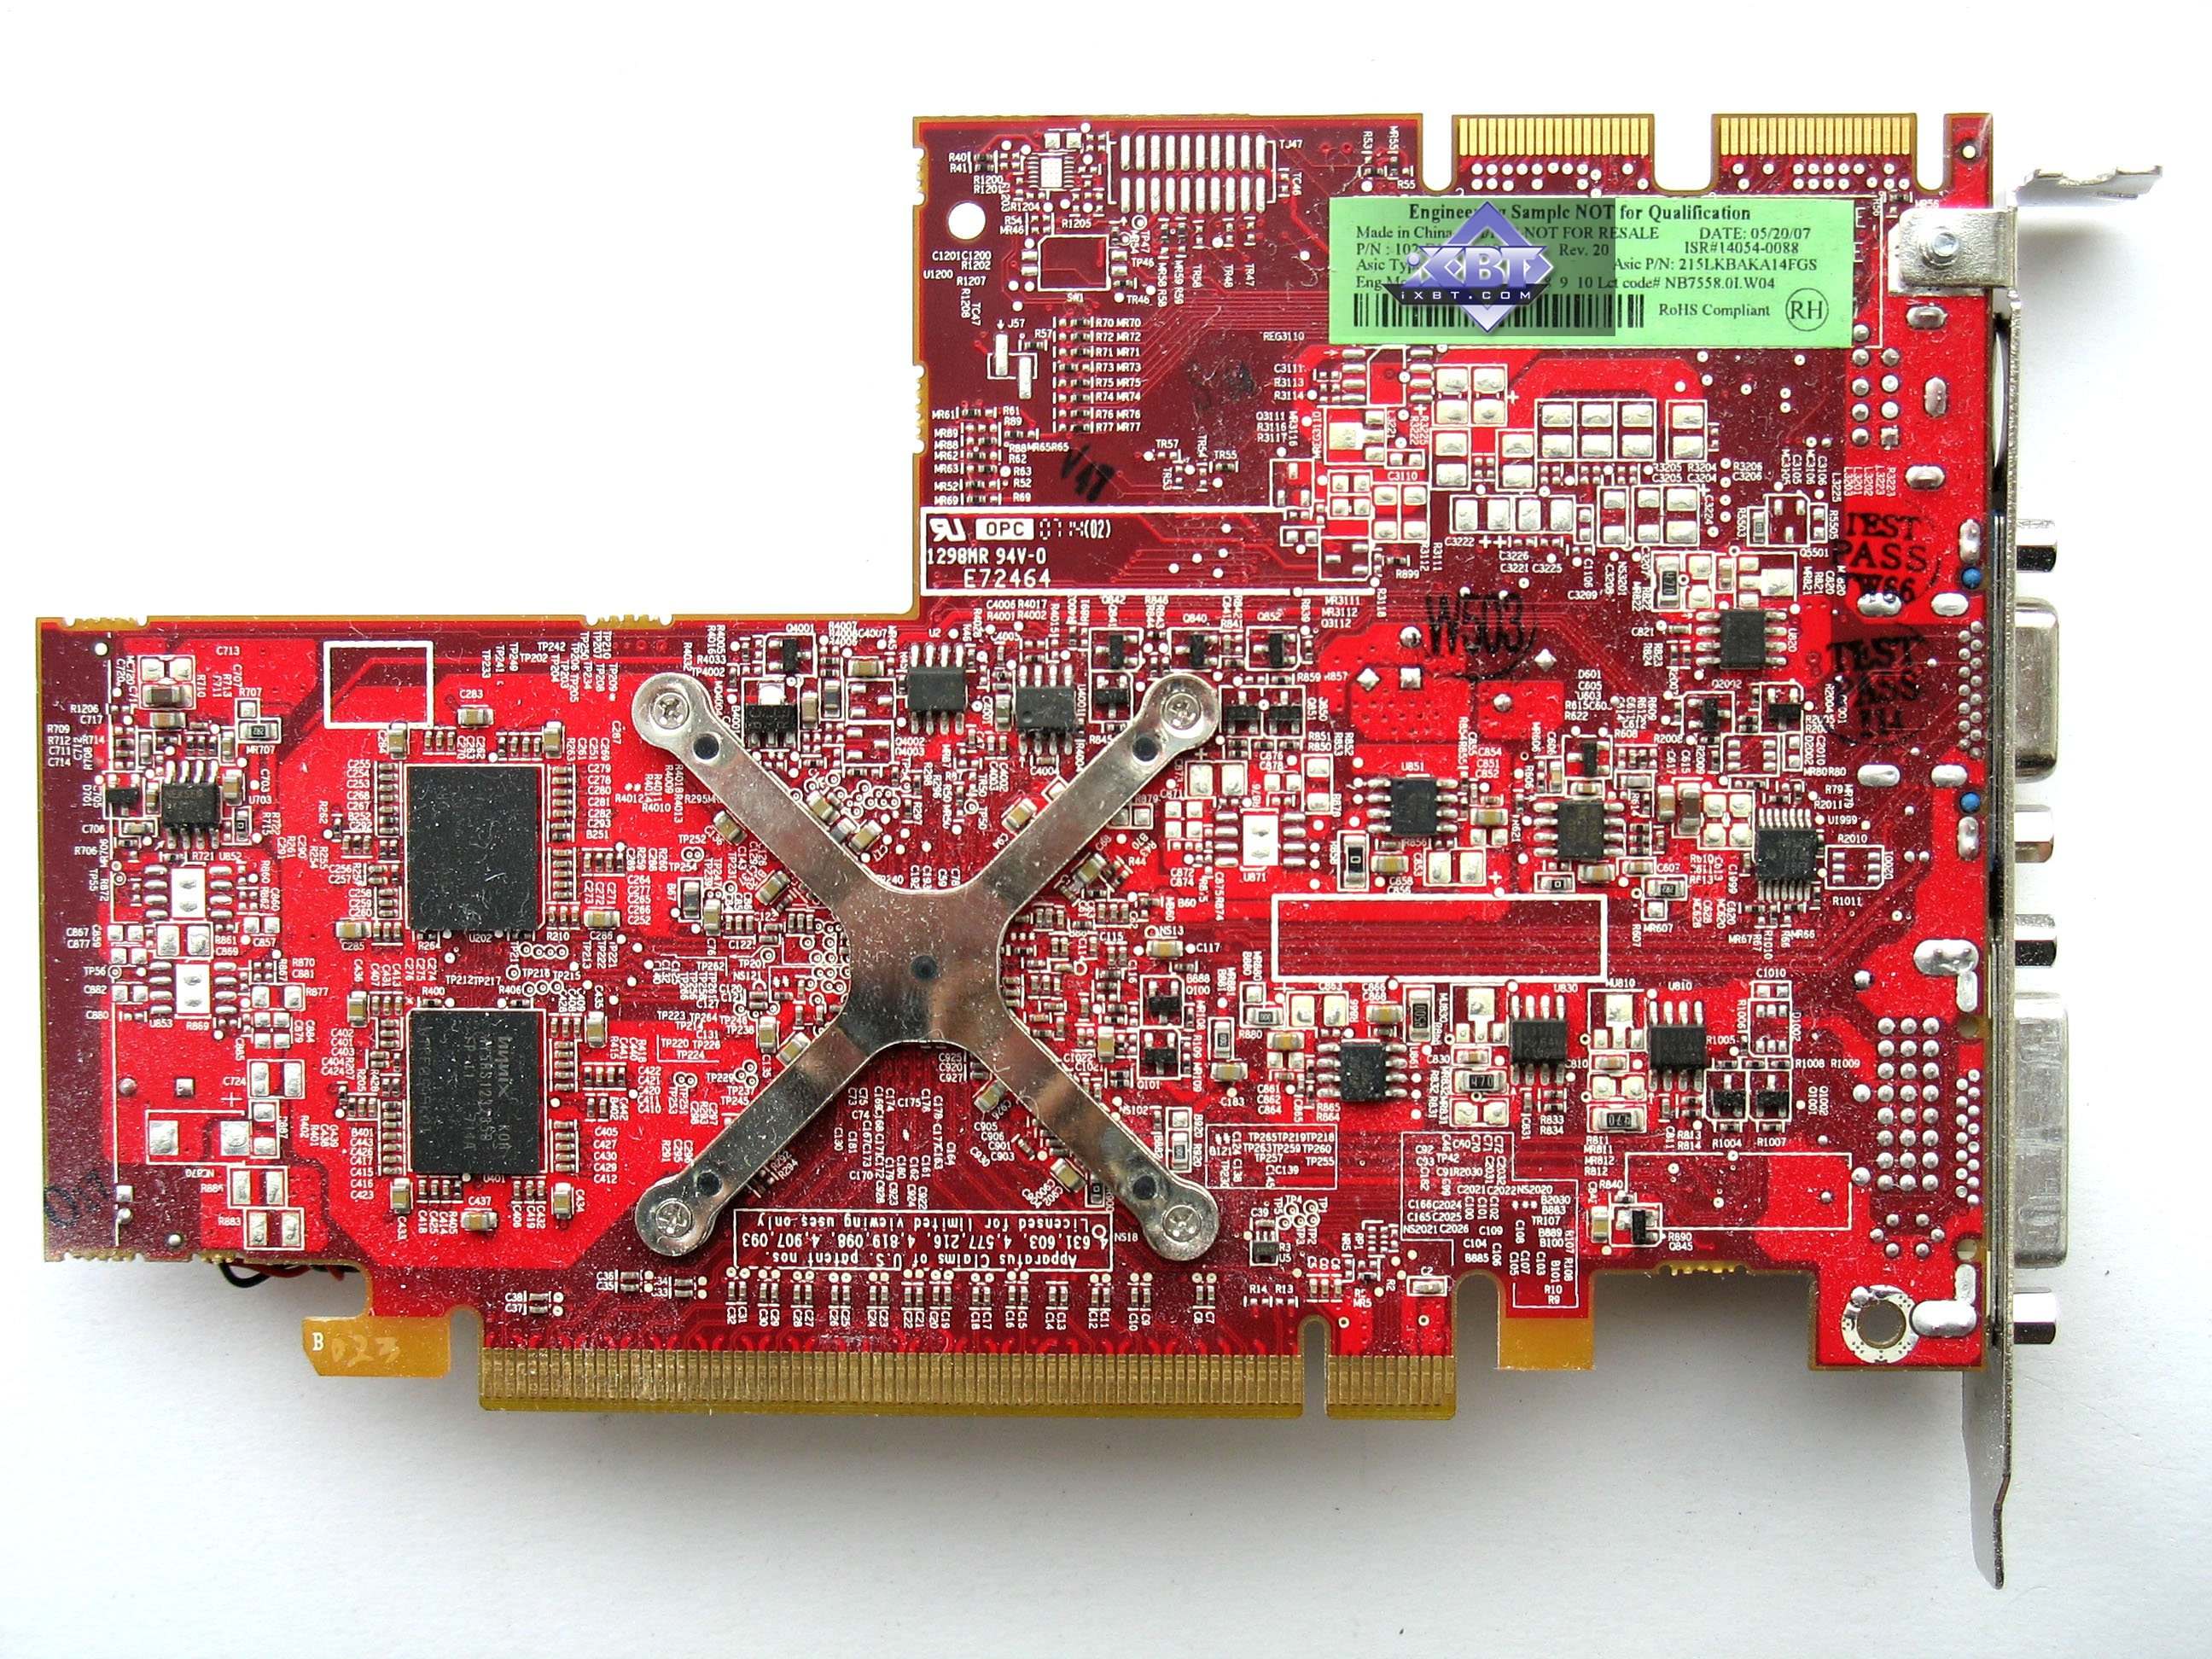
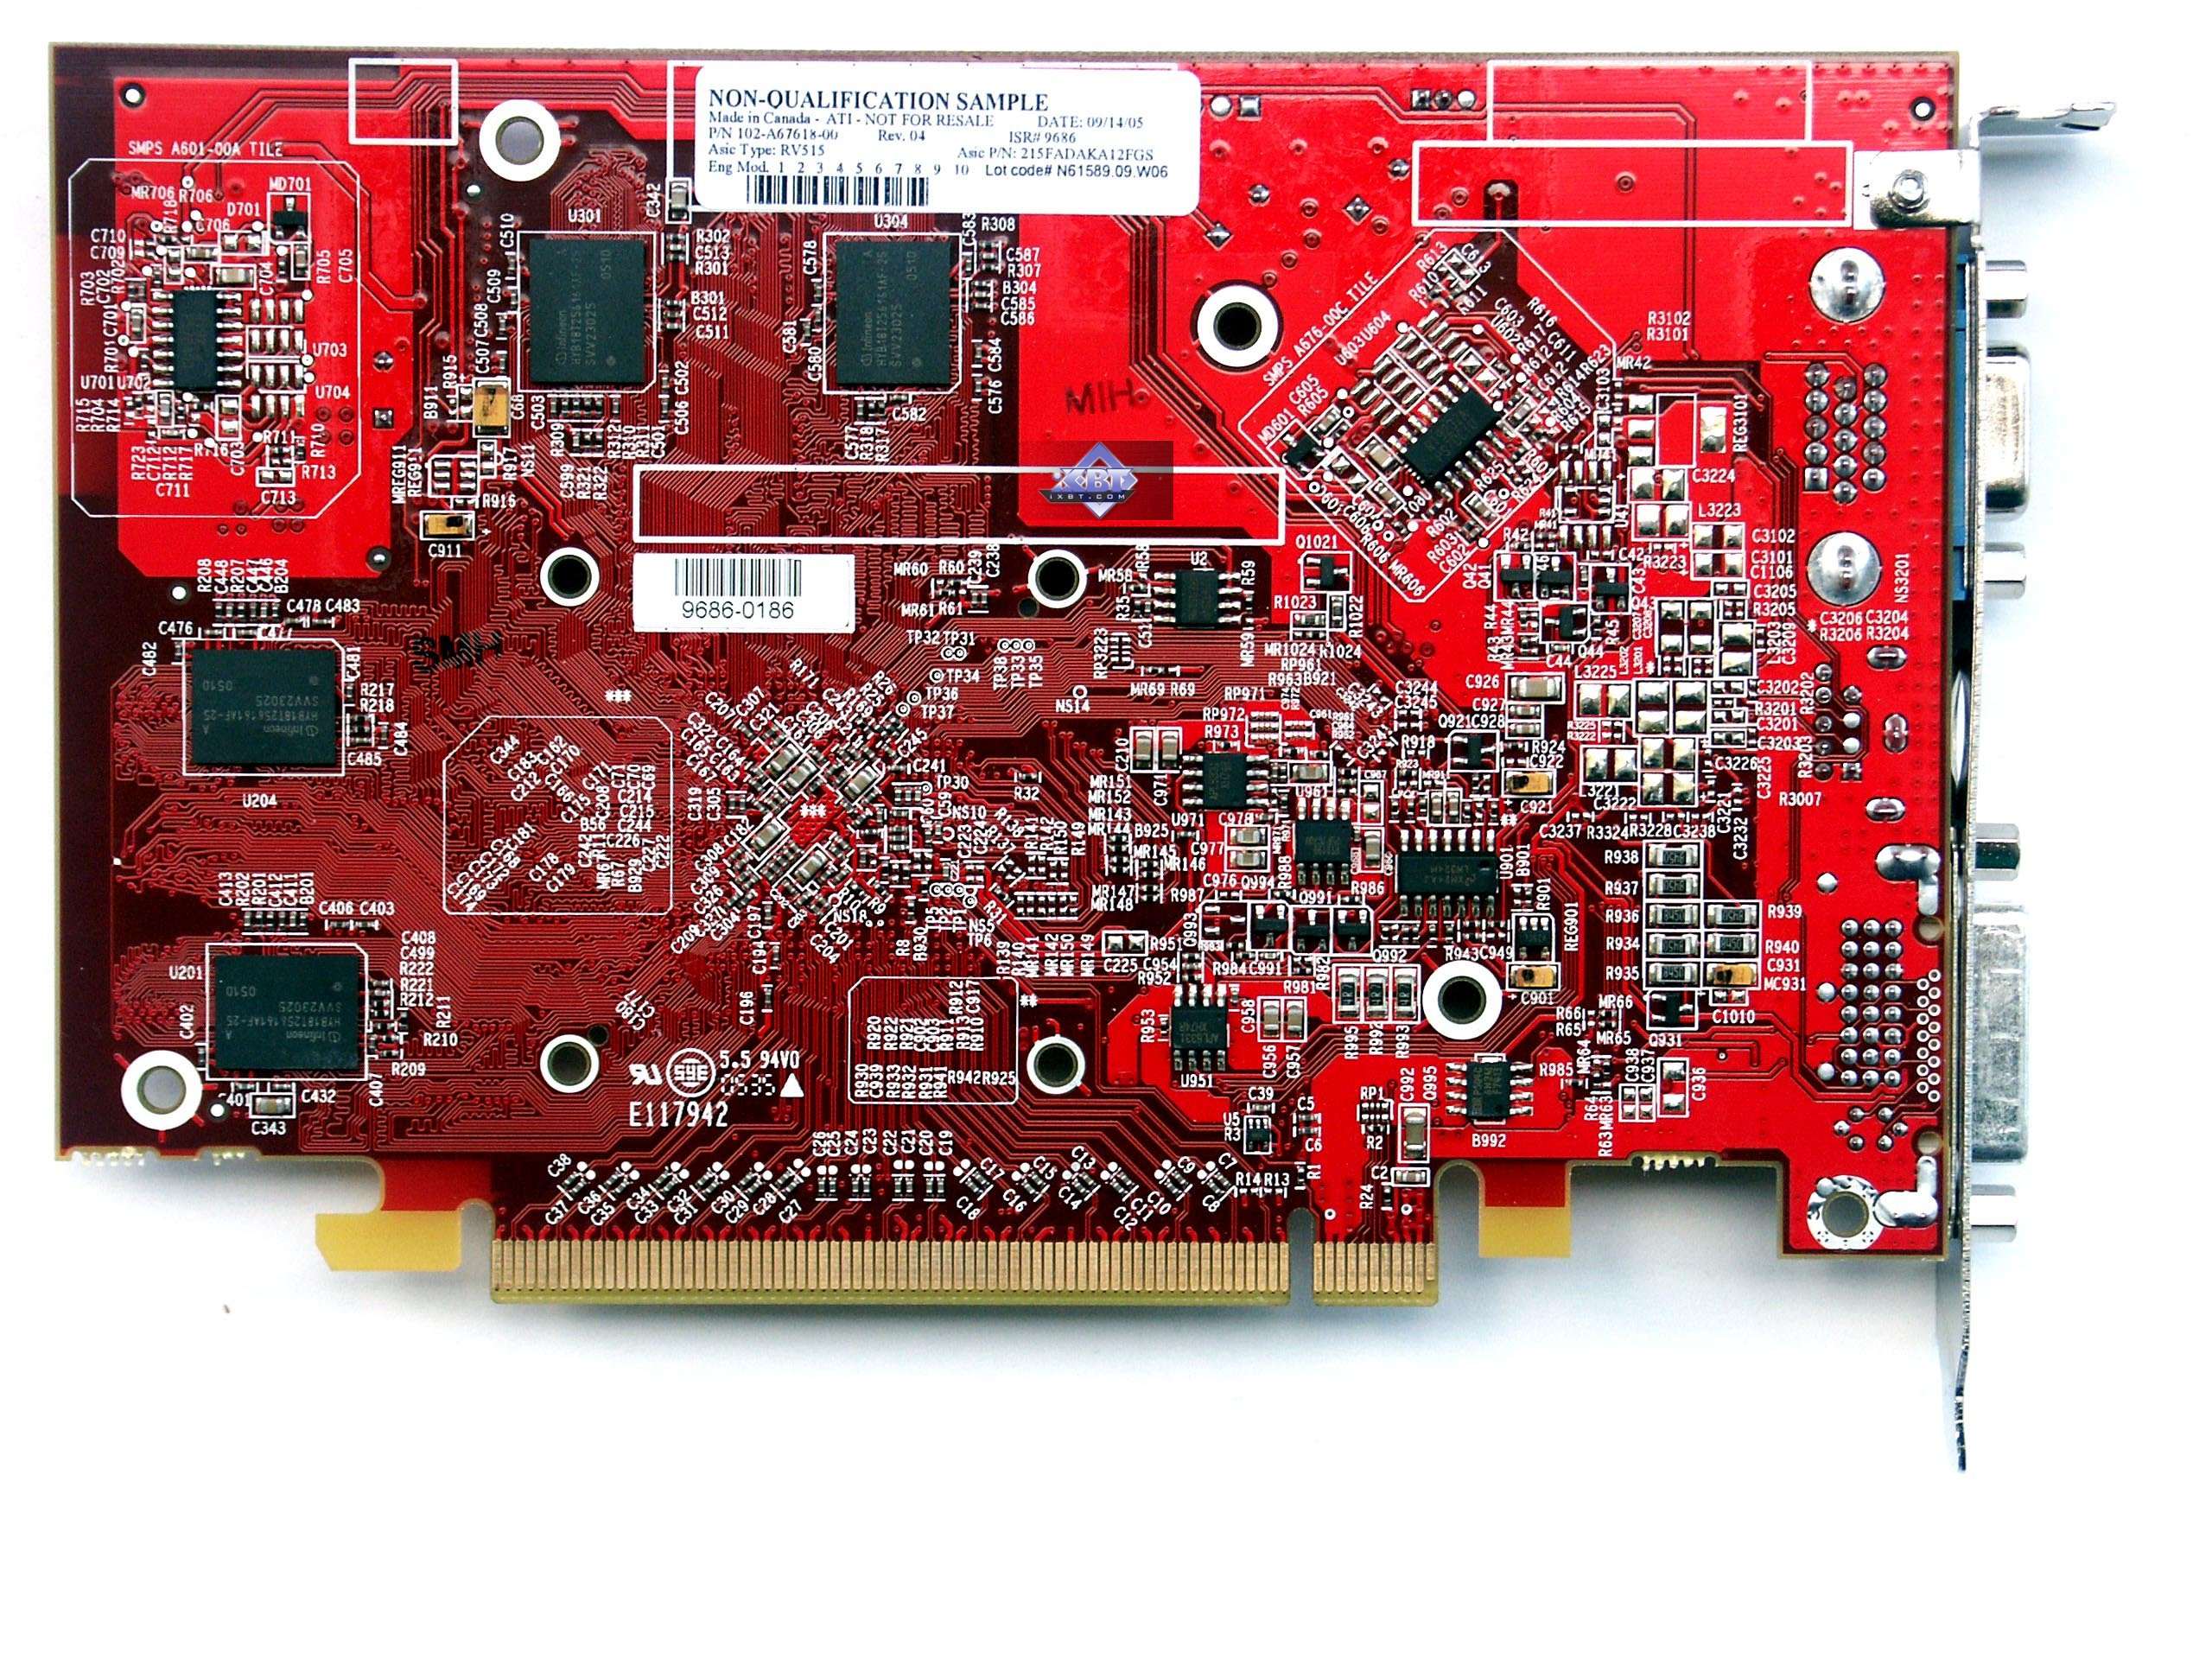
As is evident from the above photographs, these cards have a new design that has very little to do with previous ATI cards. It is noteworthy that the most expensive 2600 XT card, which has DDR4 memory, also happens to have the most complex design, probably because of the complex power supply binding. Incidentally, the 2600 XT variance which has DDR3 will have the same design as the Radeon 2600 PRO-based Sapphire card. It is interesting to notice that HIS is manufacturing its graphics cards with a blue PCB. The root cause of this change in color can be attributed to a number of events. However, the most likely one is that this change is a result of HIS changing its manufacturing partner. The cards come with a TV-Out port that uses a proprietary jack. A special adapter is required (usually shipped with the card) to output video to a TV-set via S-Video or RCA. You can read additional information regarding the TV Out here. The cards have full support for HDMI (in the 2600 cards). The HDMI support means that these cards come equipped with their own audio codec. The video and audio signals go through a special DVI-to-HDMI adapter, which comes bundled with the cards, to an HDMI receiver. We've already reviewed how modern graphics cards decode HD video in this article. In the near future, we plan to update the article with information about the HD 2600 family. The cards are equipped with a couple of DVI ports, save for the 2400 XT. The ports are Dual link DVI, so users can get resolutions above 1600x1200. Analog monitors with d-Sub (VGA) interface are connected with special DVI-to-d-Sub adapters. The maximum resolutions and frequencies of the cards are:
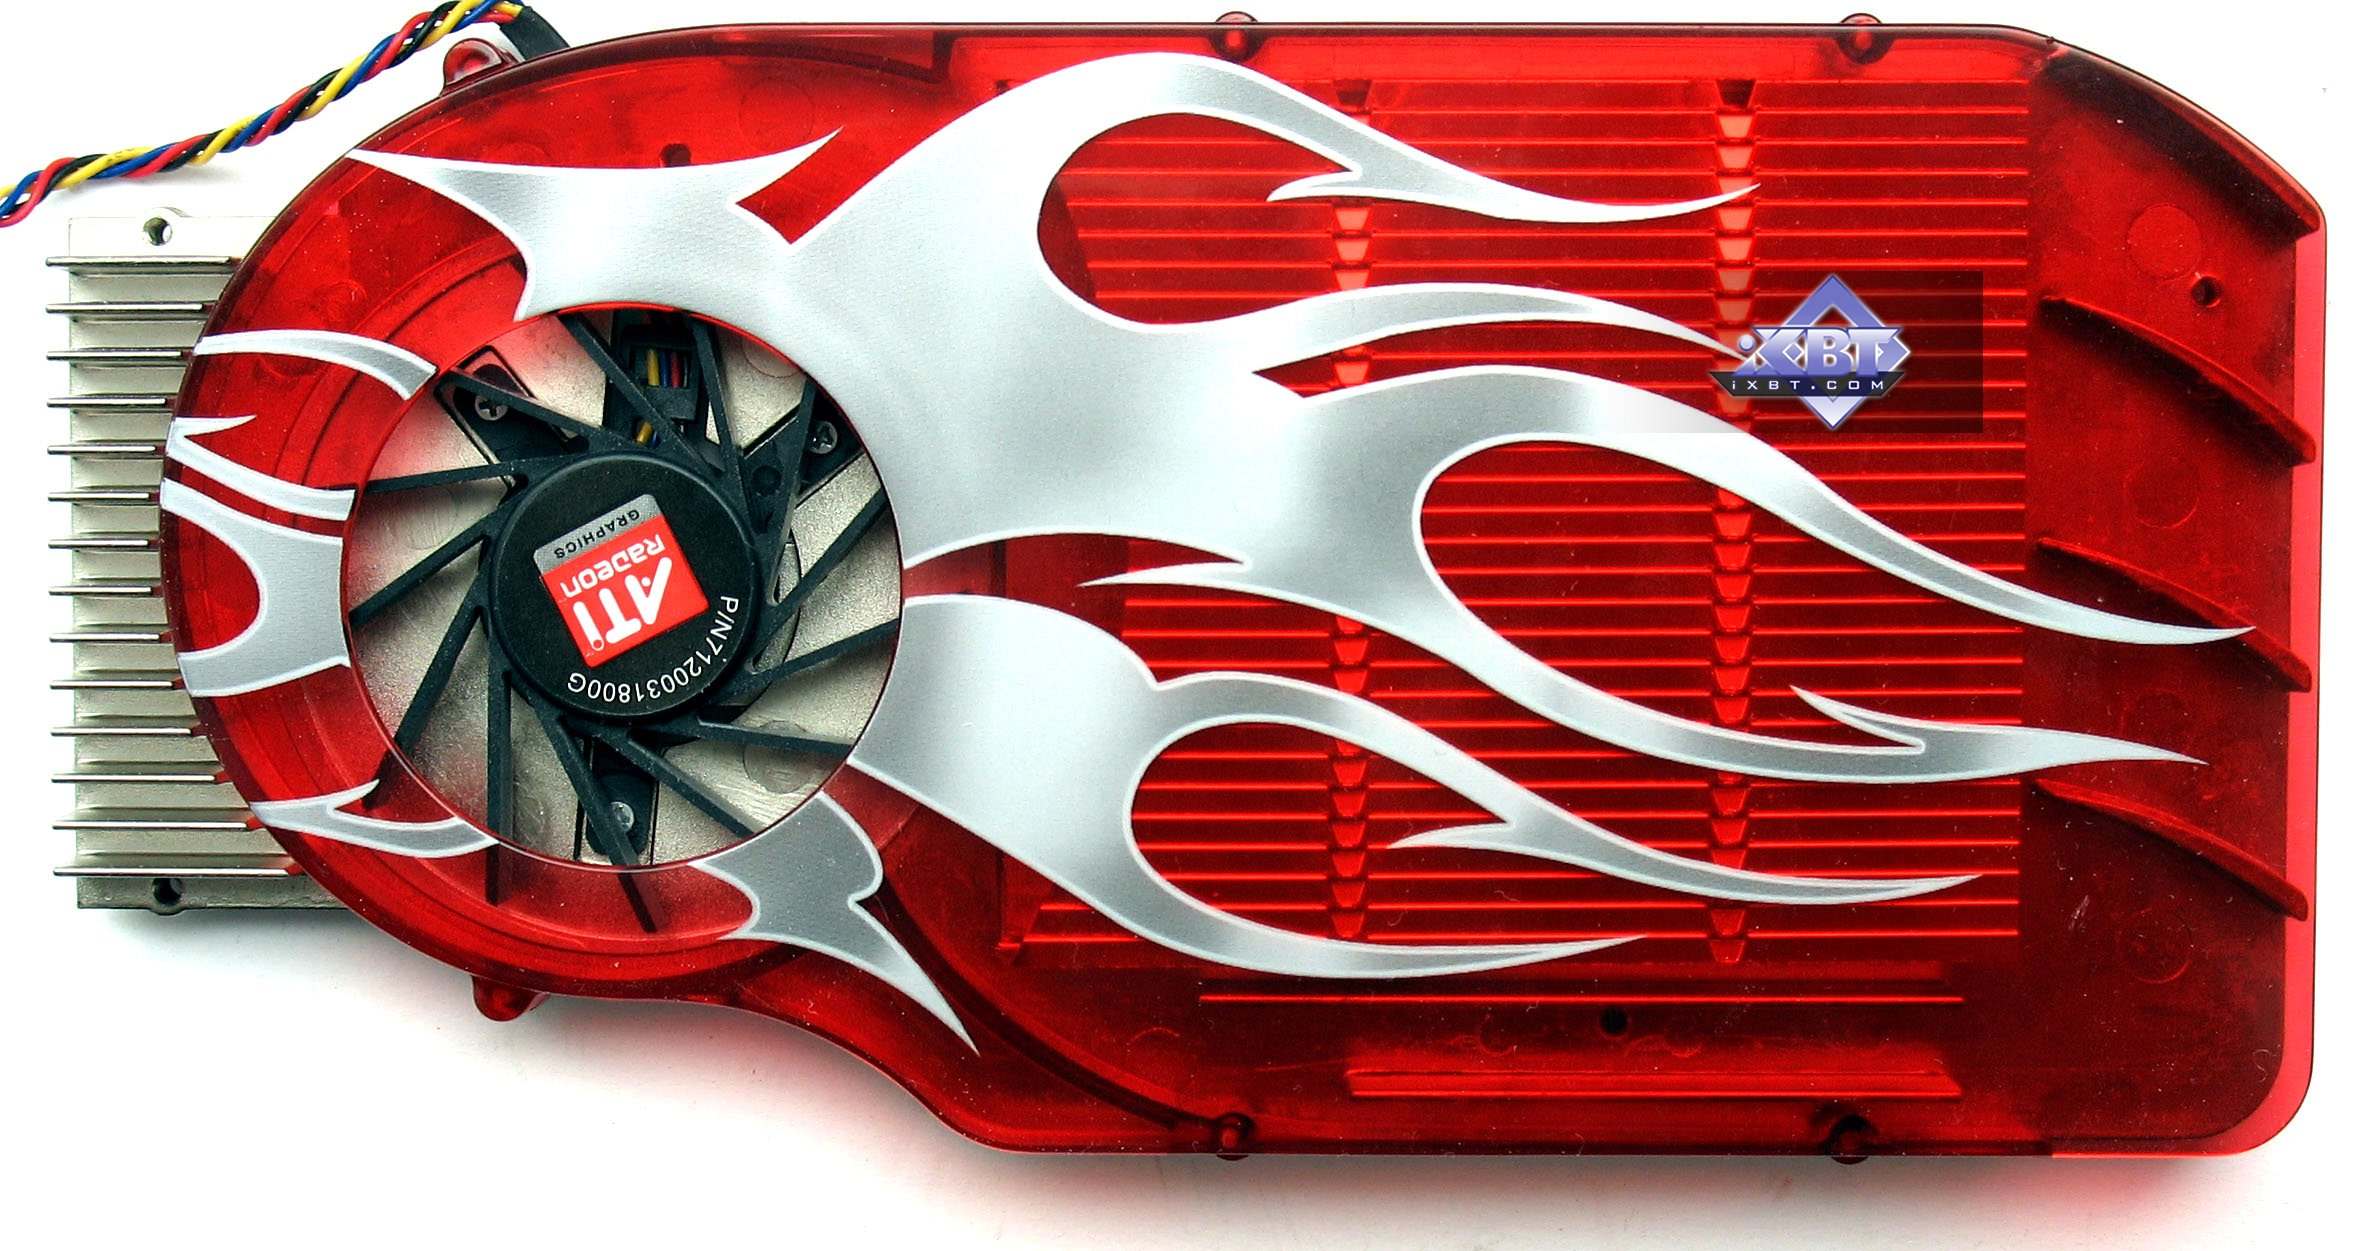
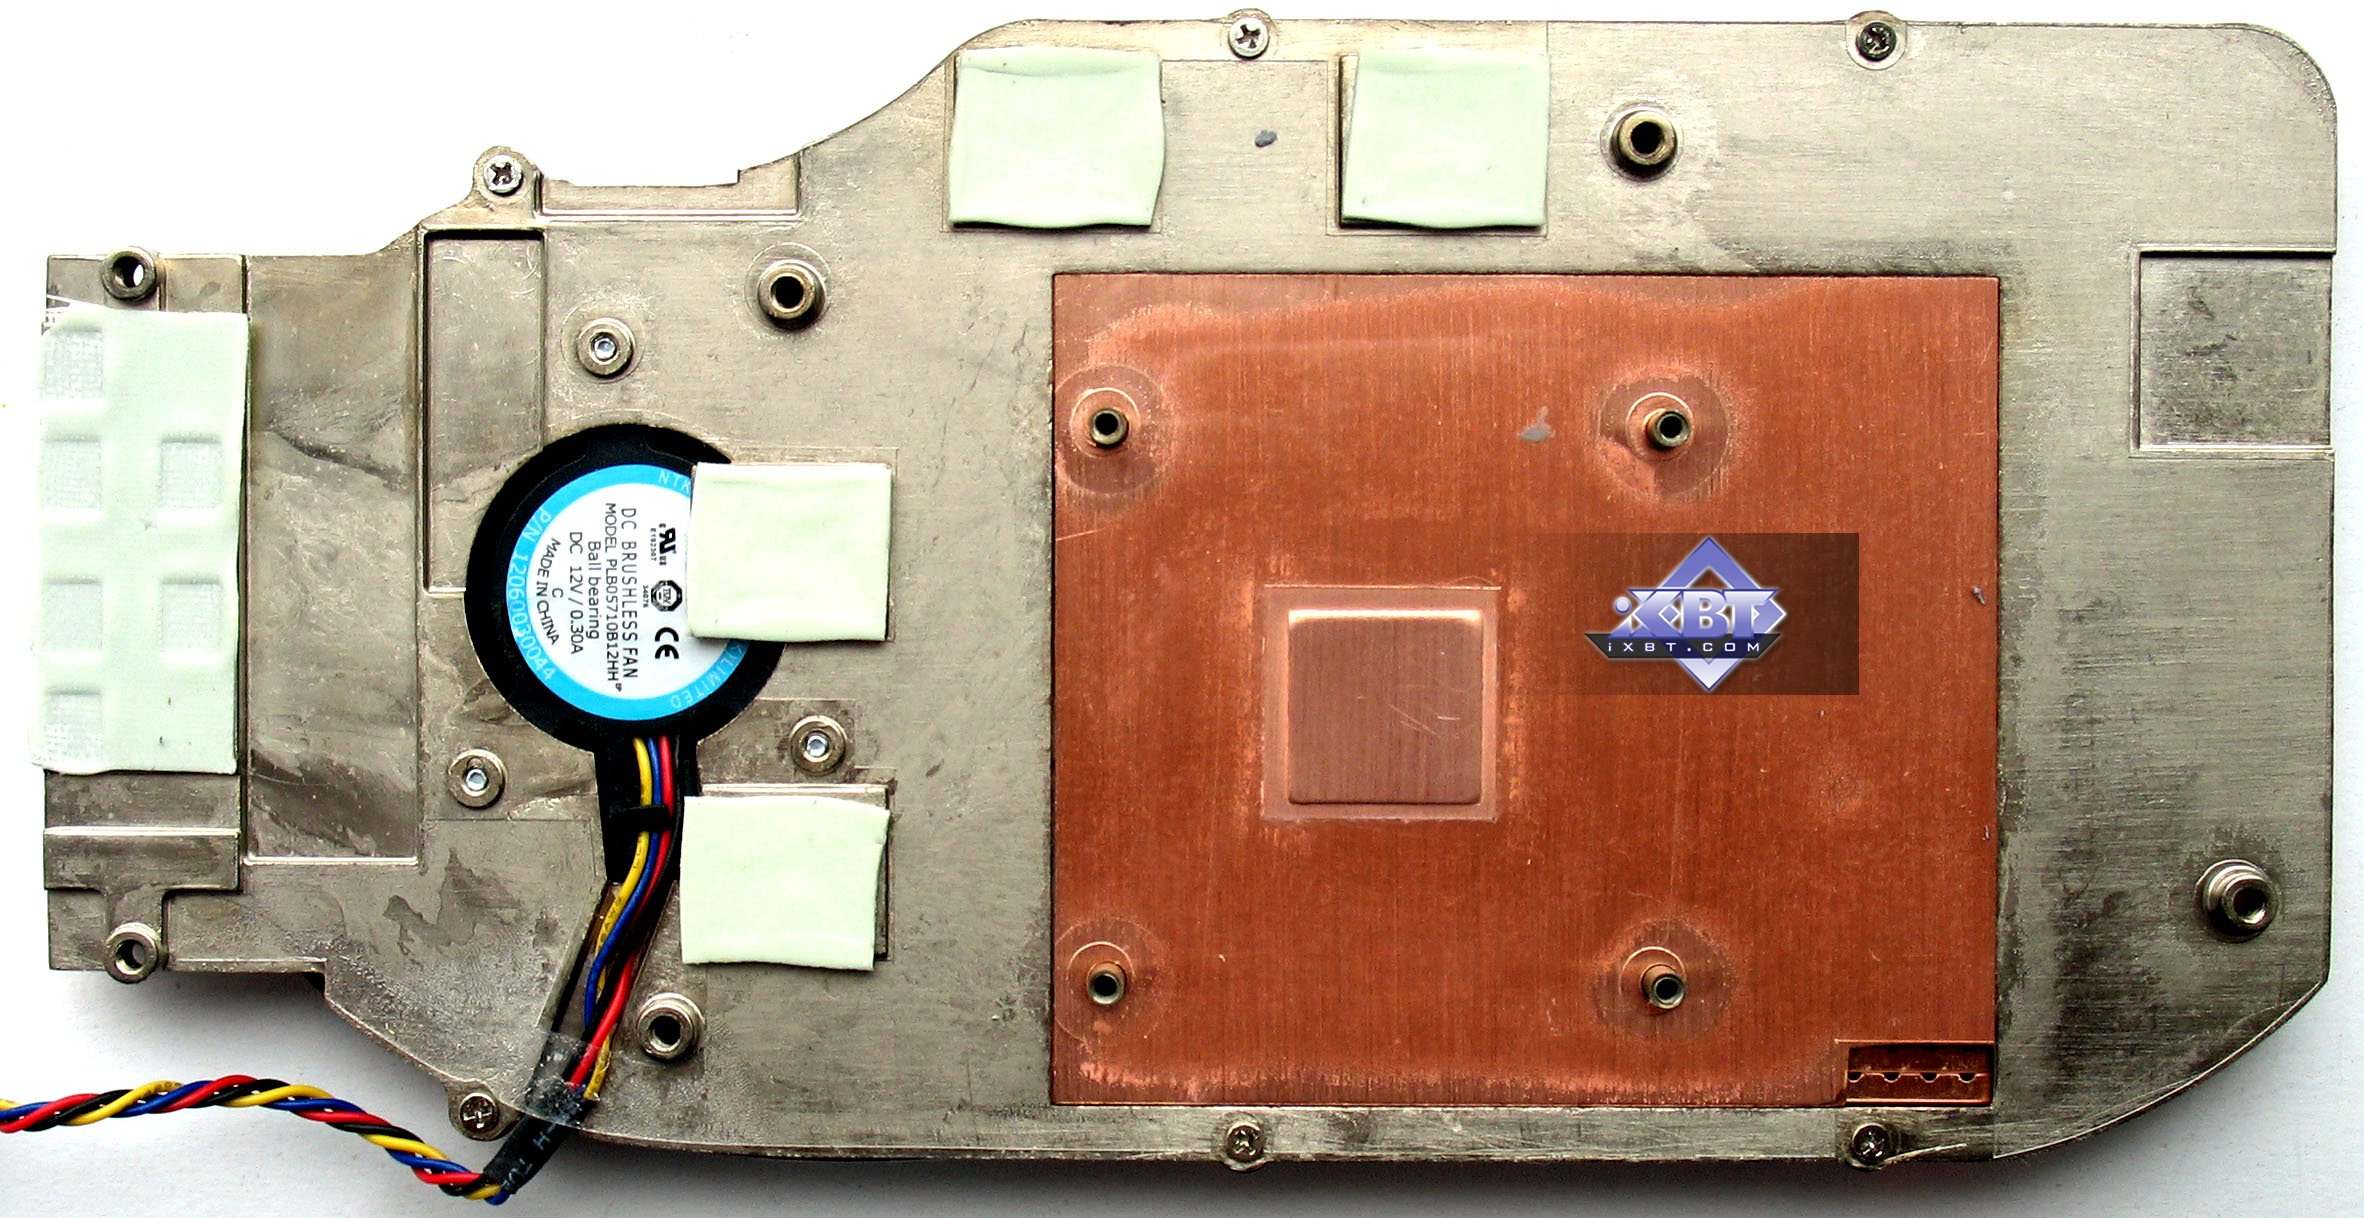
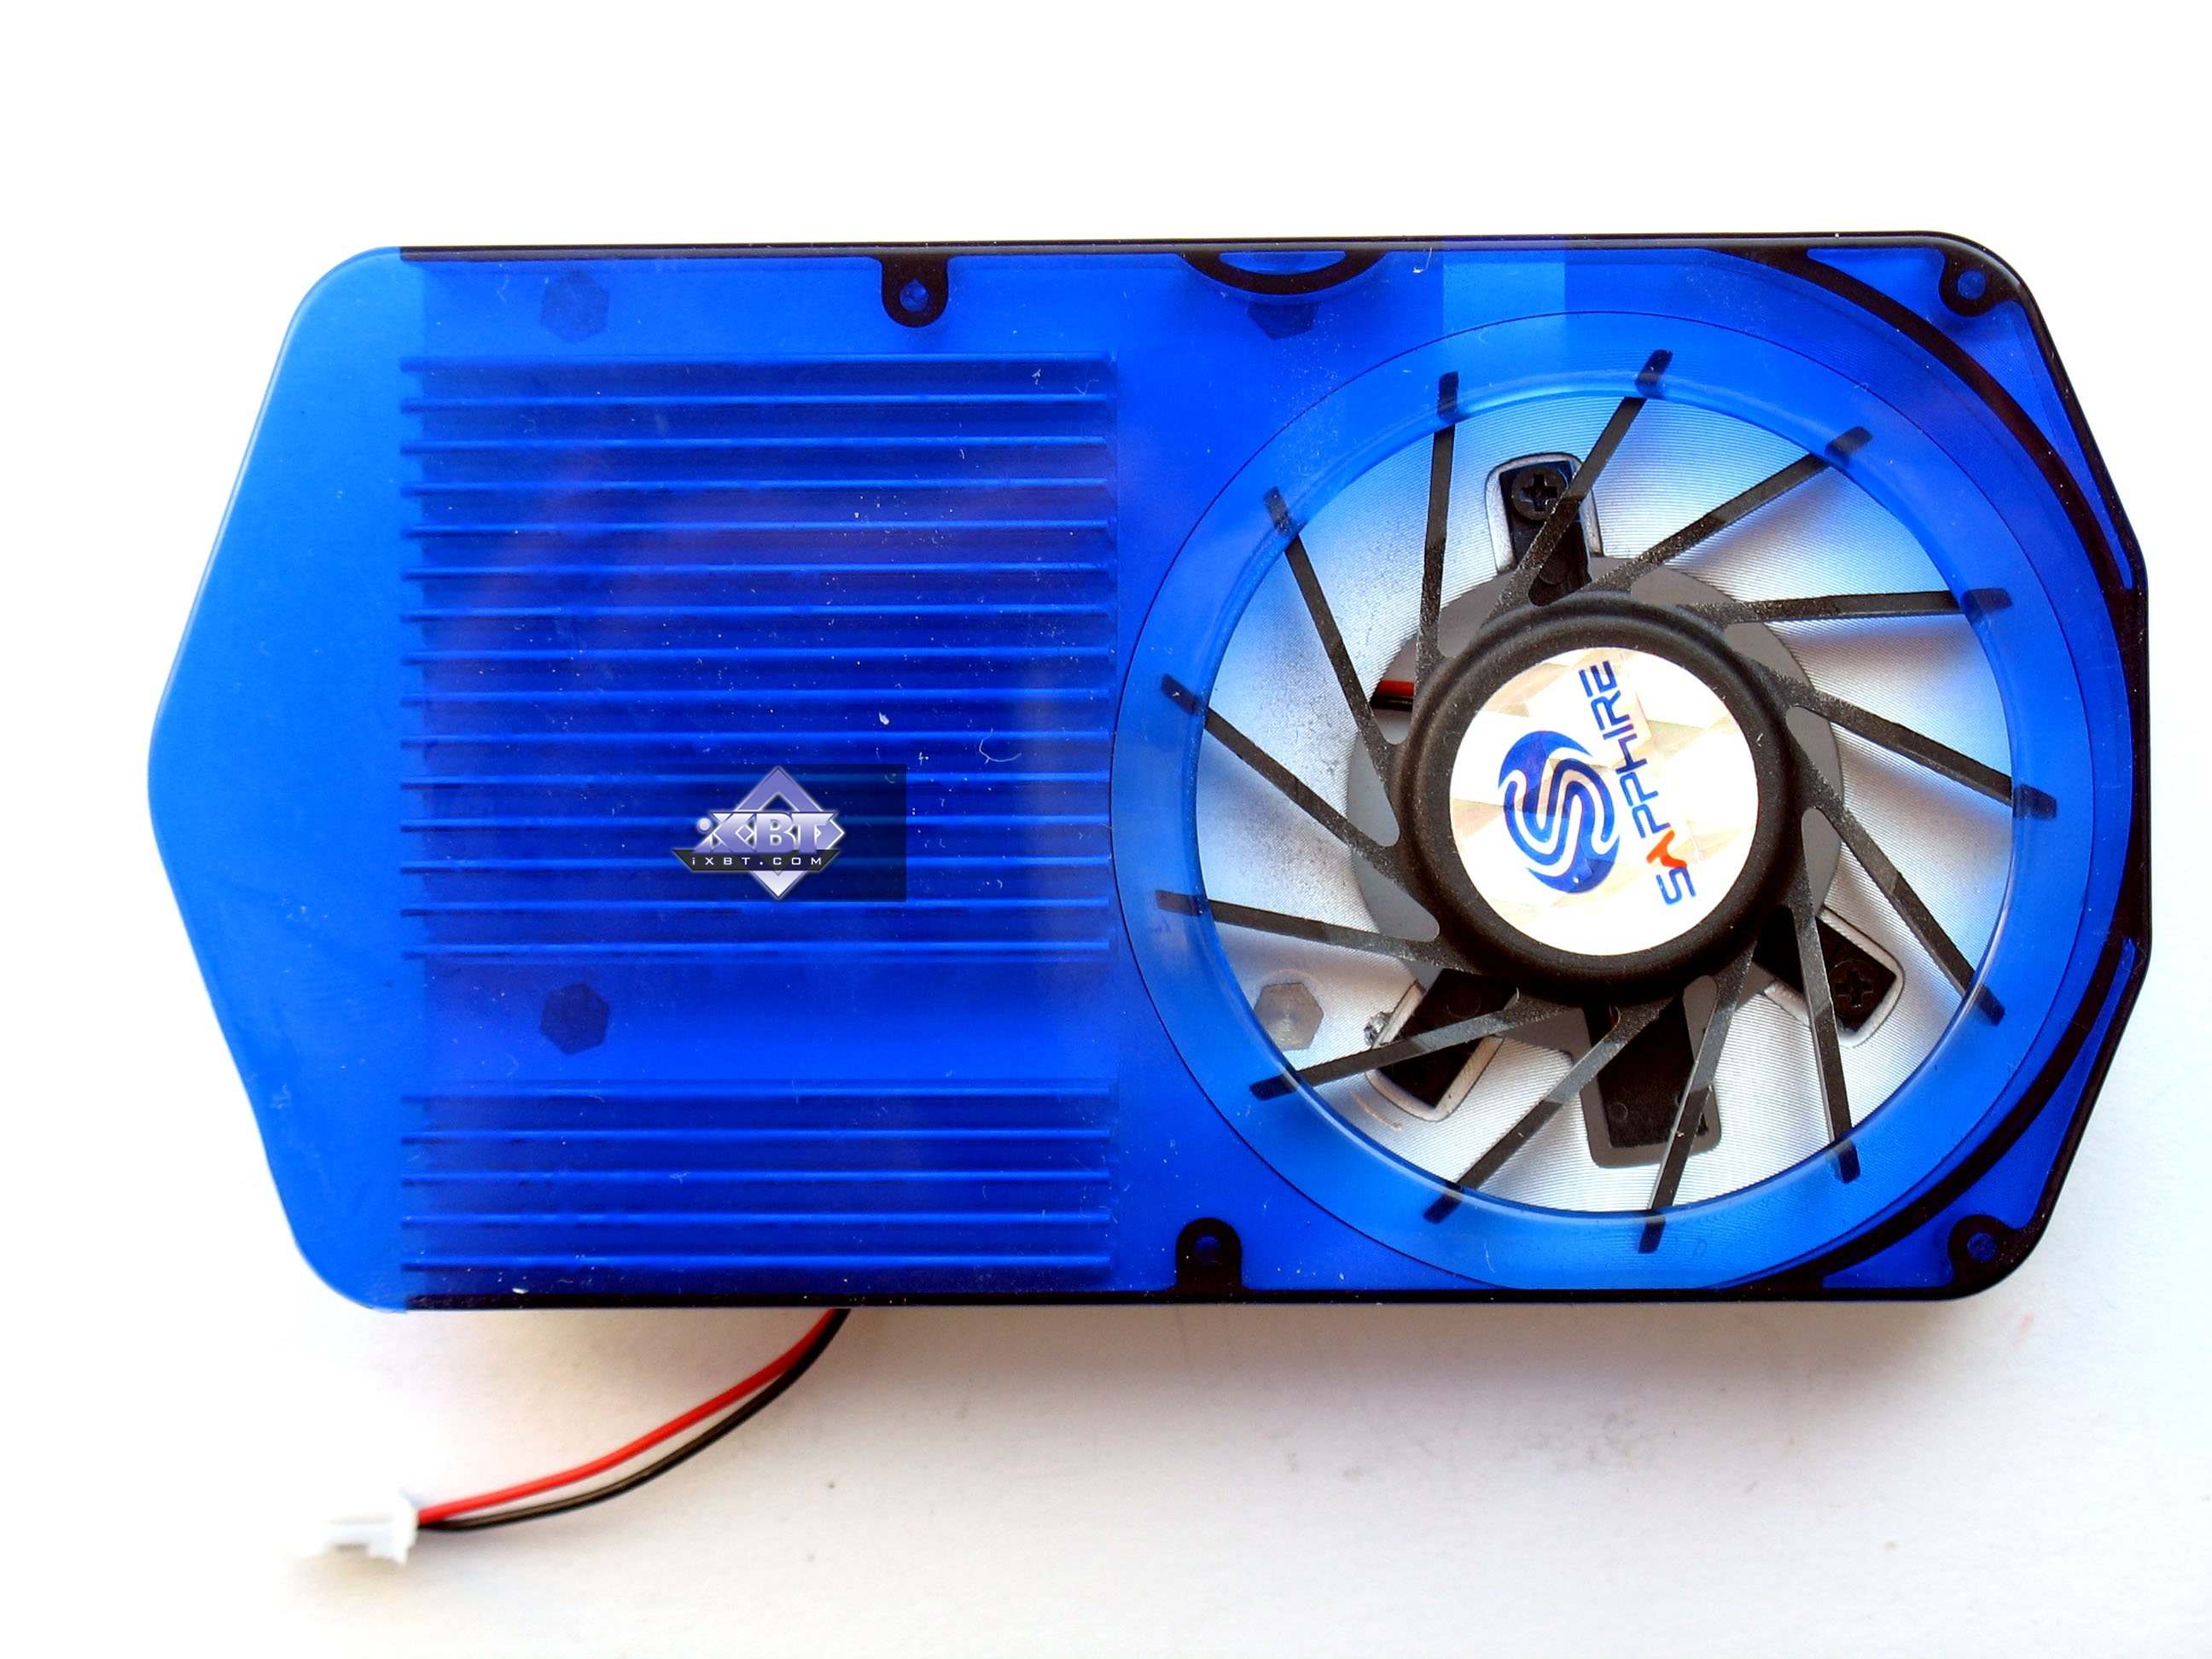
HIS traditionally uses an IceQ cooler for its cards, and these new cards based on the RV630/610 are no exception. We have examined the IceQ cooler on many occasions, so it is not completely necessary for us to include a detailed description about it. In short, it is a very quiet and efficient cooler. Here are our thoughts on the other cooling solutions:
Now let's have a look at the monitoring results. ATI RADEON 2600 XT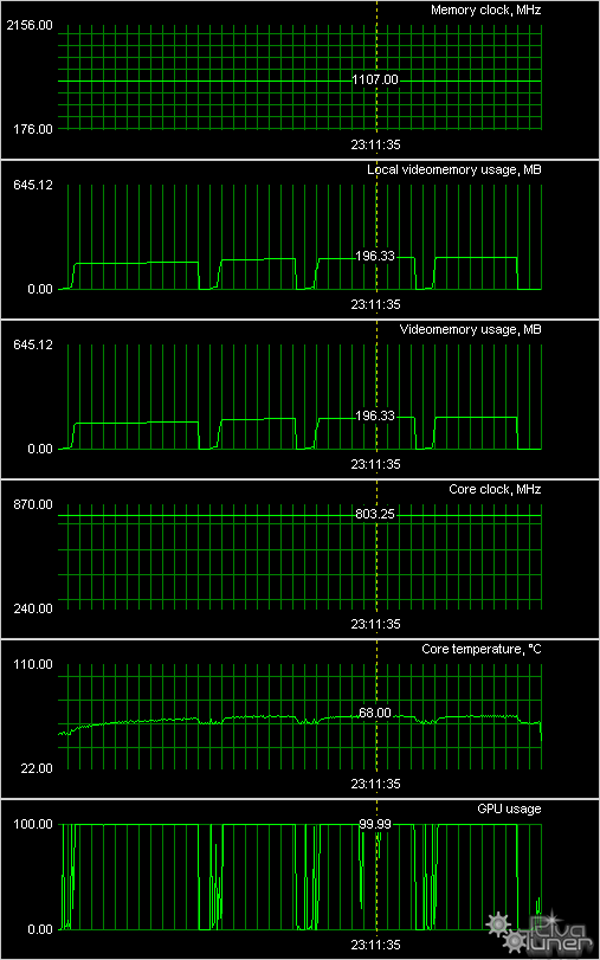 From the above graphs, we can plainly see that the cooling solution of the ATI Radeon 2600 XT reference board works quite well. For the most part, the operating temperatures stay quite low. Looking at the GPU itself, it was manufactured in Week 20 of 2007. That would mean the manufacturing date would fall into May indicating that the GPU we are testing is currently the latest revision. This would also indicate why the release of these cards was delayed for so long by AMD, so that they could wait for the latest revision of the GPU to complete. 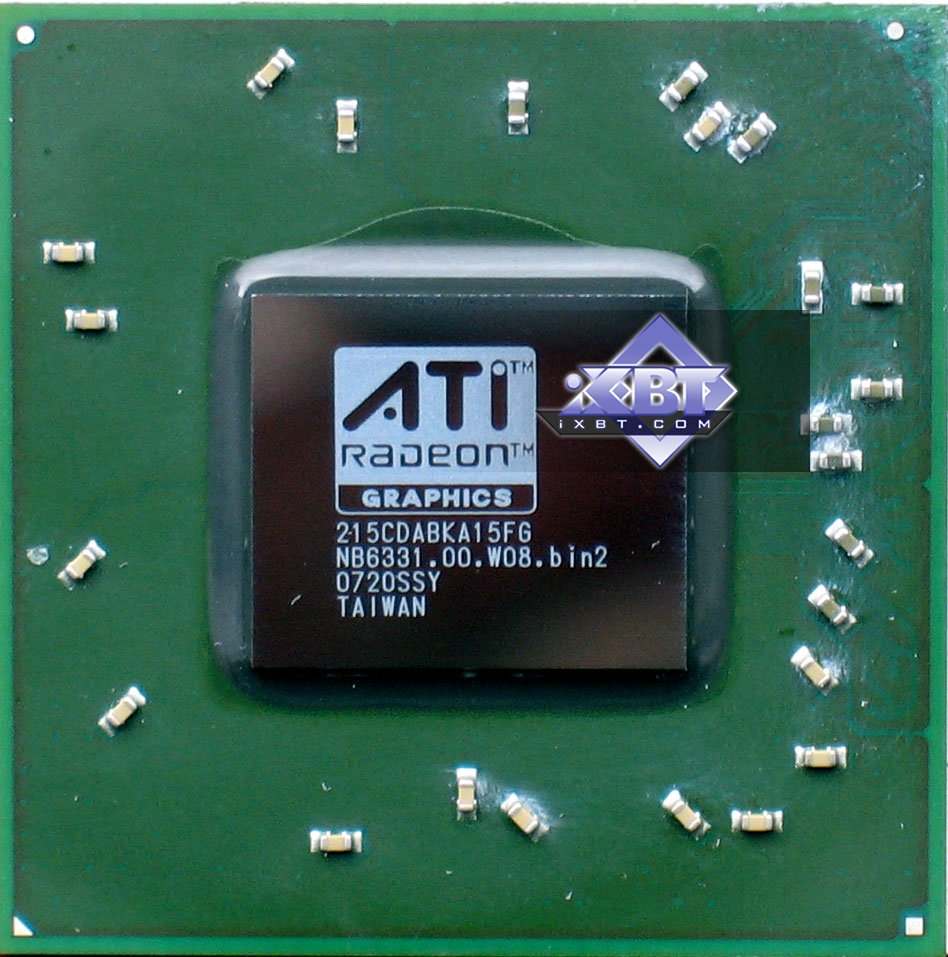 ATI RADEON 2600 PRO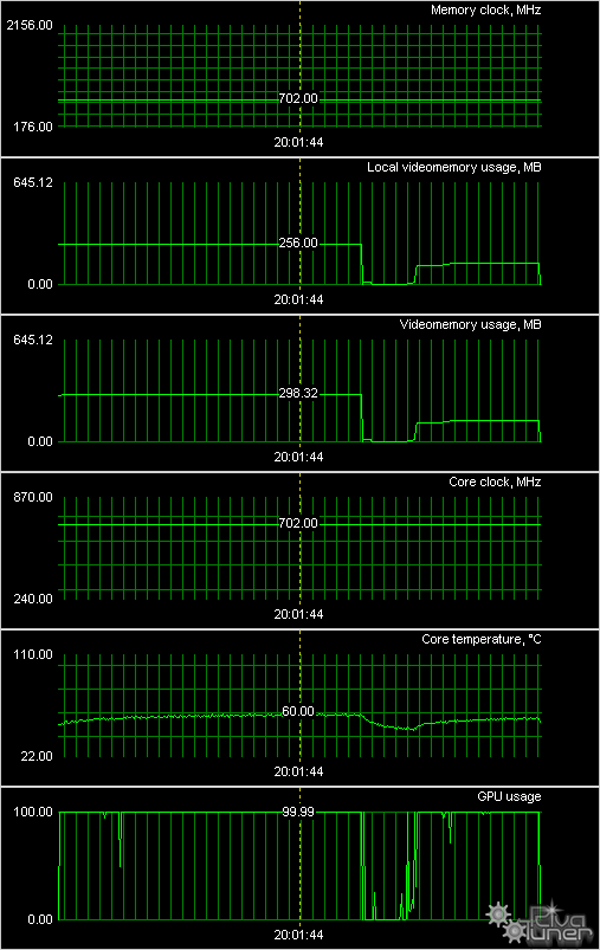 The above tests indicate that a simple cooling solution works well with the ATI Radeon 2600 PRO reference board. Despite the simplified cooler, the core temperature does not rise above 60°C during the tests. Looking at the GPU, it is plain to see that the ATI Radeon 2600 XT and 2600 PRO are identical chips operating at different frequencies.  ATI RADEON 2400 PRO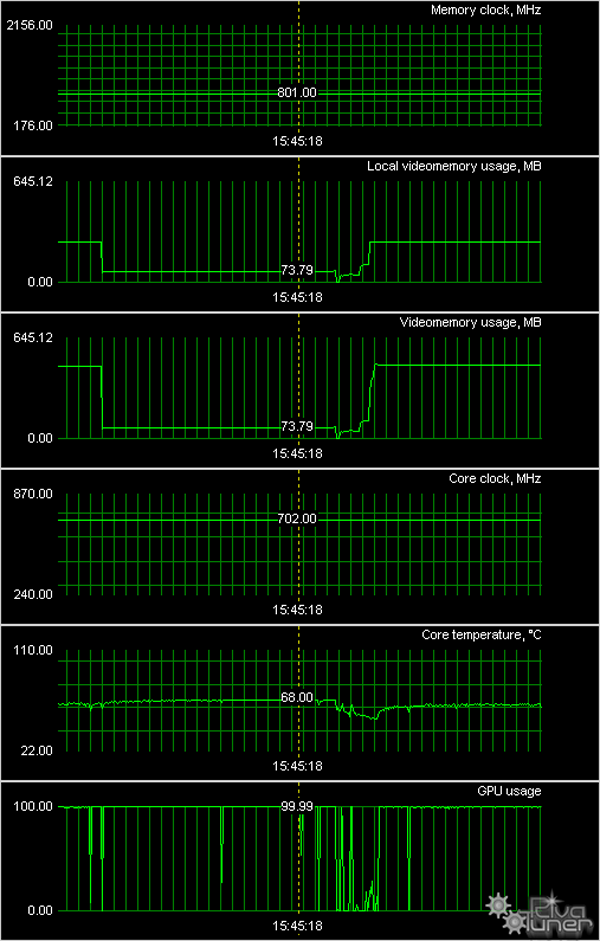 In these tests we again see that only a simple cooling solution is needed to cool these cards. As some of the cards reviewed today are engineering samples, their boxes and bundles are out of the question. Let's just say that the bundle includes DVI-to-VGA, DVI-to-HDMI, and VIVO adapters, TV cords. Sapphire and PowerColor products came in retail packages. Sapphire RADEON 2600 PRO (RV630) 256MB GDDR3 PCI-E PowerColor RADEON 2600 PRO (RV630) 256MB GDDR2 PCI-E Installation and DriversTestbed configuration:
Synthetic testsThe D3D RightMark Beta 4 (1050), the program we use for our synthetic tests, is available for download along with a description of it at http://3d.rightmark.org. We used complex pixel shader tests for SM 2.0 and 3.0 - D3D RightMark Pixel Shading 2 and D3D RightMark Pixel Shading 3. Some tasks that appear in these tests are already used in real applications. The rest of the tasks will almost certainly be used in the future applications. Our test sets can be downloaded here. We are going to switch to the new version of our benchmark soon - RightMark3D 2.0. It's written to test Direct3D 10 compatible graphics cards on MS Windows Vista. Some of its tests were rewritten for DX10, and new synthetic tests were added: modified pixel shader tests, rewritten for SM 4.0, geometry shader tests, vertex texture fetch tests. First of all we'll publish an article about RightMark3D 2.0 with test results of many graphics cards. Then we'll start using this test in our baseline articles. The synthetic tests are run on the following graphics cards:
We decided to compare the RV630-based cards against these GeForce models because they have the same market position, even if the prices are different. The RADEON HD 2400 XT is included in order to analyze the effects the scaled-back technical features of the RV610 have on performance. The performance results of the high-end solutions are also necessary in order to evaluate the relative performance of the slower cards. Pixel Filling TestThis test determines the peak texel rate in FFP mode for various numbers of textures per pixel: 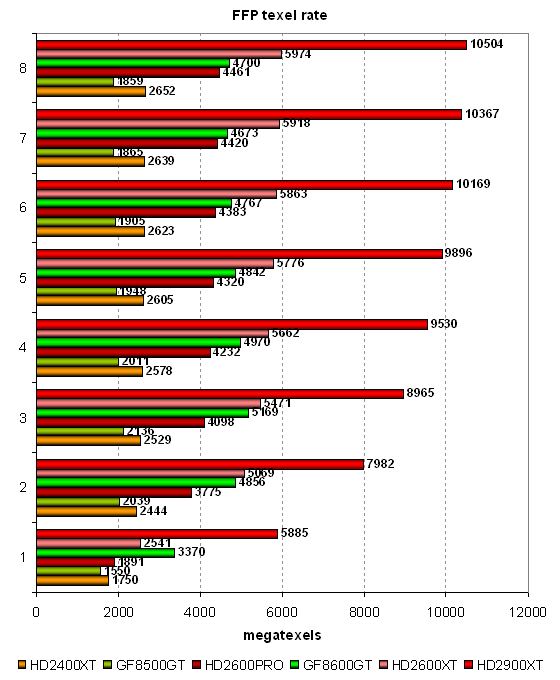 All low-end cards from AMD give results close to the theoretical maximum performance level. Their results in synthetic tests are only a little lower than the theoretical values, especially in modes with lots of textures. On the other hand, both graphics cards from NVIDIA are not even close to their theoretical maximum value, just like in our baseline review of the G84. Either our test is not quite correct, or NVIDIA provides wrong information about its low-end chips. Whatever the case is, we'll soon find out. Judging by our results, AMD chips can fetch 8 and 4 texels (for RV630 and RV610 correspondingly) per cycle for 32-bit textures and bilinear-filter them. Interestingly, NVIDIA GPUs look better with few textures per pixel, and they start lagging behind in heavier conditions. In short, AMD GPUs perform better than competing NVIDIA solutions judging by our texture fetch test; given that we compare the GeForce 8500 GT against the HD 2600 PRO and GeForce 8600 GT against the ATI Radeon HD 2600 XT.  The second synthetic test from RightMark measures fillrate performance. The test takes into account the number of pixels written into a frame buffer. NVIDIA chips perform better in the fillrate test with 0 and 1 textures, either because they have higher efficiency with the frame buffer or NVIDIA has made some special optimizations to the chips. Starting at two textures per pixel, the RV630 and G84 perform on par with each other. Immediately afterwards comes the fastest mid-range solution from AMD. The new architecture from AMD seems to be performing better with more texture fetches. As usual, we run the same task, this time executed in Pixel Shader 2.0 mode: 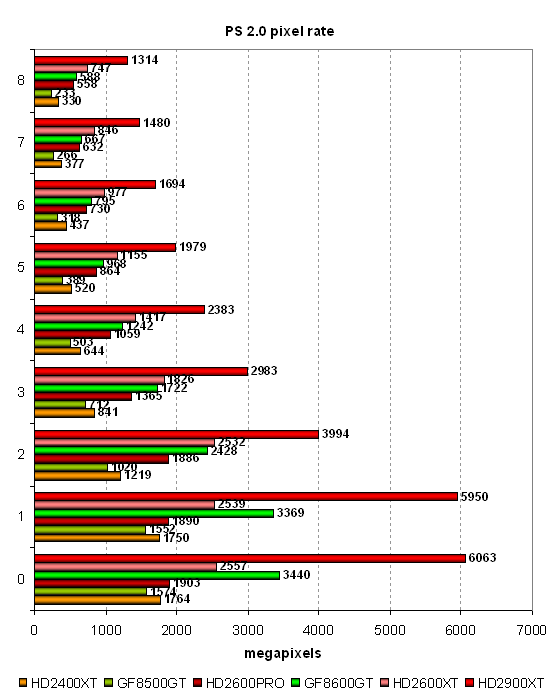 There are no changes this time either. FFP and Shaders 2.0 perform equally well (perhaps, FFP is emulated by a more efficient shader) on all graphics cards. All of the tested solutions show results similar to the previous test. Geometry Processing Speed TestWe'll start our tests of execution units with a traditional warning: you should always treat synthetic tests of unified architectures with caution. This is because synthetics tests place loads on selected parts of a GPU only. Real applications, on the other hand, use all GPU resources simultaneously. While GPUs with older architectures can display almost peak results in well-balanced 3D applications, GPUs with unified architectures usually show worse results in synthetic tests. The first geometry test contains a simple vertex shader that shows maximum triangle throughput: 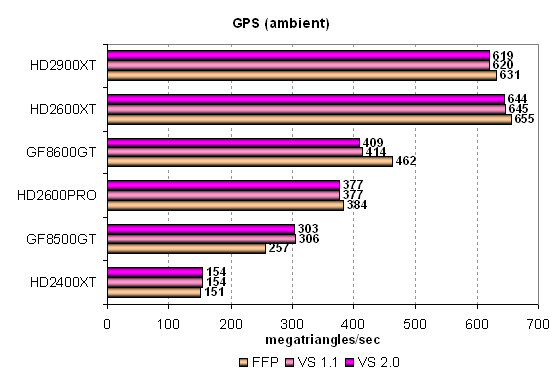 All GPUs in this review are based on unified architectures and since the processing load in this test mainly deals with geometry, all of the GPUs show high results. The RADEON HD 2600 PRO performs almost on a par with the RADEON X1950 XTX. Evidently, performance is limited by the API and the platform, not by the peak performance of the unified processors as this task is quite easy for them. The GPUs show similar execution efficiency of this test in various modes. There is a very small difference in peak performance in FFP, VS 1.1 and VS 2.0. There aren't any definitive comments we can say regarding the results of this test. The RV630 isn't on par with the R600, even theoretically, unless we take into account some API limitations. Despite the limitations, we can easily see that AMD products process geometry much faster than NVIDIA GPUs. Let's see what impact on performance a more complex test with a single diffuse light source will have on performance: 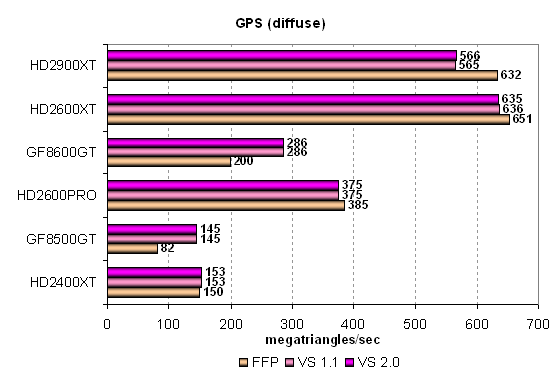 The performance displayed by the cards in this test is slightly closer to reality, but problems do still exist. The high-end Radeon HD 2900XT still performs equal to the mid-range Radeon HD 2600XT; naturally, this wouldn't be true in a real-world situation. The only thing we can say is that something is most likely limiting the performance of the HD 2900XT. FFP mode is slightly faster on some AMD graphics cards than in the last test, and a lot slower on NVIDIA cards. The slower FFP performance may be a problem with NVIDIA's drivers, or NVIDIA might have decided that FFP is not very necessary. Both the GeForce 8500GT along with the GeForce 8600GT are defeated by their price-point competitors by more than two-fold. Although this synthetic test does not hold much practical use, it shows the peak capacity of the GPUs. Let's see what happens to performance in more demanding lighting conditions. The third diagram offers a more complex computation of lighting with a single light source and a specular component: 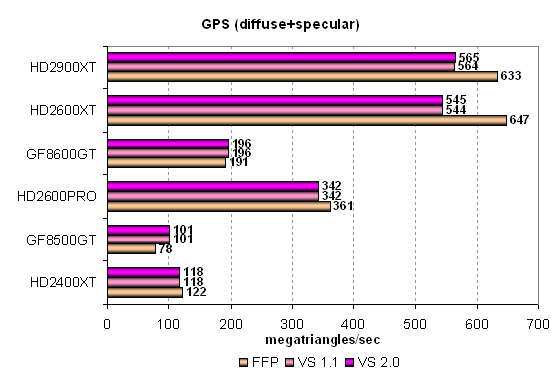 The gap between the Radeon HD 2900XT/2600 cards and the GeForce graphics cards grows even larger under more complex lighting conditions. The HD2900XT (R600) GPU remains the leader in geometry performance and the HD2600XT is only slightly behind. Looking at the other video cards, GeForce 8600 GT is outperformed by even the Radeon HD 2600 PRO. The GeForce 8500 GT ends up barely competing with the Radeon HD 2400 XT. Clearly GPUs from AMD process geometry much faster than NVIDIA GPUs. Next, let's analyze the most complex geometry task, which consists of three light sources with static and dynamic branches. The performance difference might grow even larger in this test: 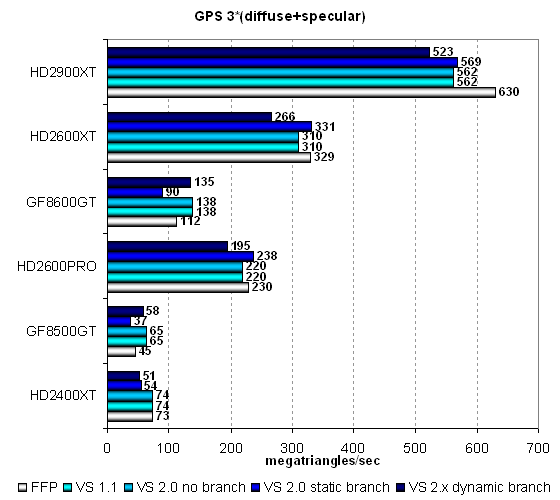 But no, the situation is almost the same here, except for the fact that the R600 heavily outperforms the RV630 here. To us, it seems that the potential of the R600 is not completely shown by even our heaviest task. From what we are seeing, its performance is limited by the API. This is another proof that the unified architecture of the R6xx series is indeed quite a strong one that is capable of processing geometry efficiently. The more difficult a task is, the better the results are compared to the unified architecture of the NVIDIA G8x family. One thing to remember, though, is that AMD and NVIDIA GPUs have opposite weak spots in vertex units - AMD loses more performance because of dynamic branching, while NVIDIA suffers more from static branching. Our conclusion on the geometry tests: The new entry-level and mid-range products from AMD show some very strong results in the synthetic geometry tests. These GPUs perform well in such tests primarily because of their strong unified architecture and special modifications. In the synthetic tests, we see that they are able to use all their unified stream processors to solve geometry tasks. The new unified architecture from AMD demonstrates its aptitude with complex vertex shaders as well. The AMD GPUs are able to outperform competing NVIDIA ones by significant margins. Remember, though, that these are only synthetic tests. In real applications, unified processors are usually busier with computing pixels. Keeping this in mid, we now proceed to the synthetic pixel performance tests. Pixel Shaders TestAs our comparison does not include NVIDIA GPUs of the older architectures, which gain advantage when a number of temporal registers along with their precision is reduced, we do not publish FP16 results. All of today's GPUs must execute pixel shaders with reduced precision at the same speed as authentic FP32 ones. The first group of pixel shaders is very simple for modern GPUs. It includes various versions of simple shaders: 1.1, 1.4, and 2.0. 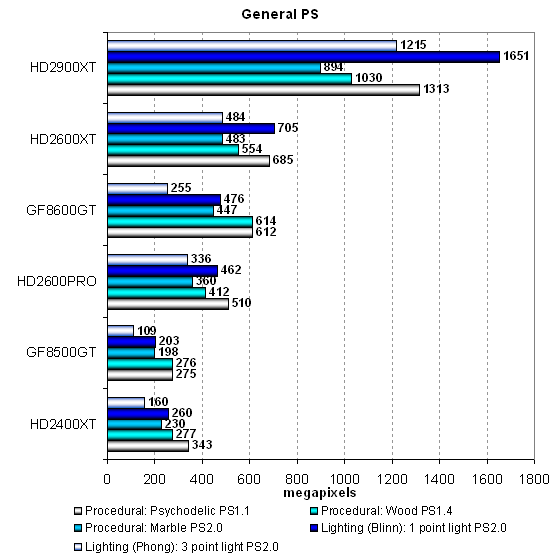 The G8x and R6xx GPUs have very little trouble with these tests. The tests don't show the true worth of unified architectures. Performance in the simplest tests is limited by texture fetches and fillrate, which is why the mid-range GPUs from AMD and NVIDIA end up with similar results. In the PS 2.0 tests the RV630 performs the highest. Looking at the situation of the GeForce 8500 GT/HD 2600 PRO pair, it is noticeably simpler. The AMD solution is always faster than its main competitor, which in the end has comparable performance to only the cheapest of AMD contenders tested today. Let's have a look at the results of more complex pixel programs, in between SM 2.0 and 3.0: 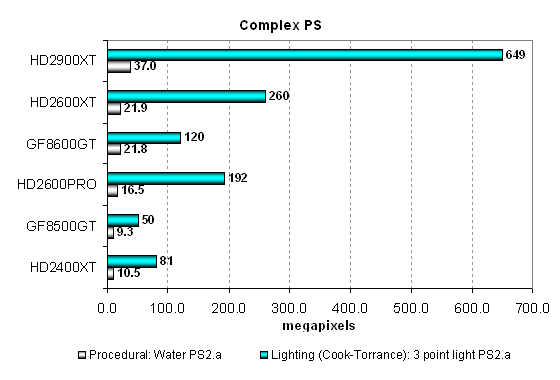 The procedural water test depends heavily on texturing performance and uses dependent fetches of highly nested textures. In this tests, a trend that we've been seeing repeats and again the GeForce 8600 GT and the HD 2600 XT show similar results. The HD 2900 XT is naturally way ahead, but the difference from the RV630 is less than twofold. The GeForce 8500 GT is again much slower than the HD 2600 PRO, it's even outperformed by the HD 2400 XT. The second test is more intensive in terms of computing. In it, all AMD products shoot forwards in terms of performance; the HD 2600 PRO ends up outperforming even the GF 8600 GT. This task seems to favor the superscalar architecture of the R6xx, which is made up of many unified processors in these GPUs. Compared to the R600, all inexpensive cards expectedly demonstrate much lower results. Although the RV630 is more than twice as slow as the high-end AMD solution, it still performs well for its class. The HD 2400 XT's performance mainly suffers from being heavily cut down on the side of technical features. Although it demonstrates decent results for its price segment, this HD 2400 XT will hardly be able to provide comfortable frame rates in real-world DirectX 10 applications with quality settings set to high. New Pixel Shaders testsThe new pixel shader tests were introduced not long ago, and as such they are more GPU-intensive and demanding than the above tests. In fact, we are plan to discontinue performing synthetic tests for old shader models (below 2.0) and use only SM 2.x, 3.0 and 4.0 written in HLSL. Performance of the old shader versions can be evaluated in games (they have been used there for a long time already). These tests are divided into two categories. We'll start with Shaders 2.0. There are two tests with popular effects from modern 3D applications:
Both shaders are tested in two modes: mathematical computation intensive and texture sampling intensive. Let's analyze mathematical computation intensive modes, as they are more promising from the point of view of future applications: 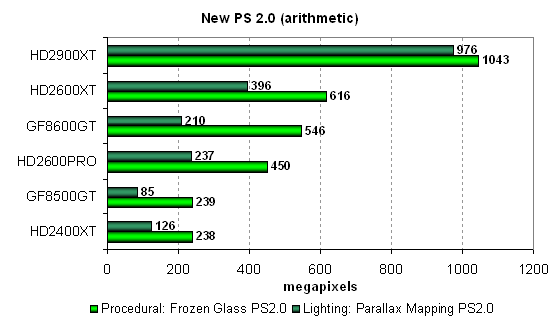 The situation is similar to what we have seen in the previous group of tests. The R600 is the leader here, but the high-end RV630-based card is just 1.7 times as slow in the Frozen Glass test. The G84-based card from NVIDIA is only slightly outperformed by the HD 2600 XT in this test. It confirms our assumption that performance is limited mainly by the texture sampling rate (texture sampling is inevitable in any tests). The GeForce 8500 GT traditionally competes only with the weakest card from AMD, which is outperformed by the RV630-based solution by more than a factor of two. The situation in the second test (Parallax Mapping) is different. The GeForce 8500 GT shows even worse results than the HD 2400 XT, and the GeForce 8600 GT is almost on par with the cheaper (according to preliminary data) HD 2600 PRO. That's what different tests with different TMU and ALU loads can do - the advantage can end up being larger in one test than the other. Assuming that the same may happen in real applications, NVIDIA solutions may end up with the advantage in some applications while AMD cards may perform better in the others. Let's analyze modes of the same tests that prefer texture sampling to mathematical calculations: 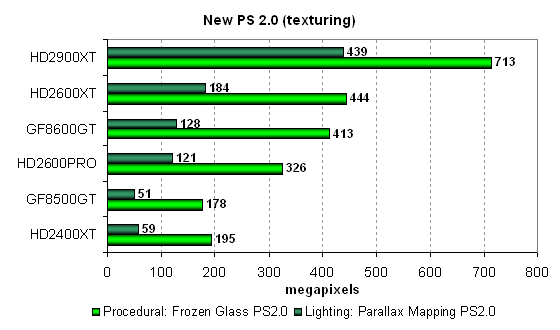 The situation changes here, but not drastically. Performance in these tests is limited mostly by the texturing units, which is why AMD cards do not break away from NVIDIA cards in the Parallax Mapping test. In any case, all of the GPUs prefer mathematical-intensive shaders and end up working faster with them. For modern architectures, focusing in on textures does not make much sense. GPUs of both architectures (G8x and R6xx) prefer mathematical computations over texturing. AMD (ATI) solutions have traditionally preferred mathematical computations, especially considering the small amount of TMU units. Take a look at the result of two more pixel shader 3.0 tests. These are out most complex synthetic pixel shader tests for Direct3D 9. These tests place a heavy load not only on the ALUs, but also on the texture units. Both shader programs are relatively complex, long, and have lots of branches:
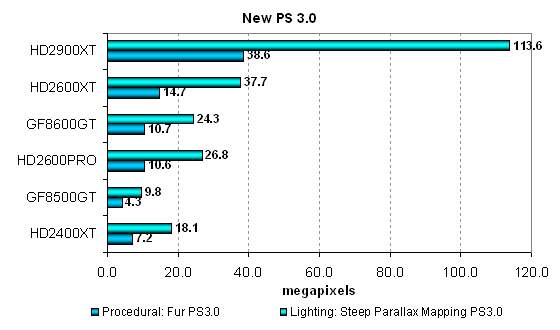 The GeForce 8600 GT based on the G84 fares slightly better than the 8500 GT. It is, however, more expensive than its direct competitor. Nevertheless, at least it provides performance similar to that of the Radeon HD 2600 PRO. These two tests show that cheaper AMD R6xx solutions execute complex pixel shaders 3.0 with many branches more efficiently than NVIDIA's entry-level products. The performance advantage of ATI cards over NVIDIA G8x cards reaches a factor of 1.5-2 in our synthetic tests. Conclusion on the pixel shader tests: The RV610 and RV630 chips are based on the efficient R6xx architecture, which from what we have seen is well suited for complex pixel shaders. The more complex calculations there are in the game, the more efficient the new architecture from AMD is. In this case, NVIDIA solutions cannot be saved by their higher theoretical texture sampling rate, which is important even in synthetic tests of pixel shaders, to say nothing of real games where the texturing speed plays an even more important role. As games are lagging behind the progress of technology, the situation in games may be slightly different, and the performance results may change. We will have a look at the test results of the RADEON HD 2600 and the HD 2400 in modern games in the next part of this article and will see whether our assumptions are true. Conclusion on the synthetic tests
As we have already noted in our baseline review of the new AMD unified architecture, the architecture is very powerful and designed for complex calculations. The architecture scales quite well and the entry-level products reviewed today are quite competitive judging by the synthetic test results. Since they are also manufactured by a finer process technology, the new entry-level and mid-range ATI chips get additional advantages in terms of power consumption and heat release. We are somewhat surprised, though, by the fact that AMD has no card to contend with the GeForce 8600 GTS. Was ATI not able to squeeze enough performance from the RV630 to perform well in modern applications and compete with the top G84 solution? In the next part of this article we will test the new low-end and mid-range solutions from AMD in modern games and see whether our conclusions made after the synthetic tests are true. The gaming section is the main part of the next article. In our opinion, you should make your choice of whether you want any of these new GPUs using the real-world game performance results. We conduct the synthetic tests primarily in order to reveal the potential of new architectures, and don't intend them to be the main deciding factor when purchasing a product.
Contents
Write a comment below. No registration needed!
|
Platform · Video · Multimedia · Mobile · Other || About us & Privacy policy · Twitter · Facebook Copyright © Byrds Research & Publishing, Ltd., 1997–2011. All rights reserved. | |||||||||||||||||||||||||||||||||||||||||||||||||||||||||||||||||||||||||||||||||||||||||||||||||||||||||||||||||||||||||||||||||||||