 |
||
|
||
| ||
|
||
|
||
| ||
 Quite some time has passed since the launch of Microsoft Windows Vista and the updated DirectX 10 API. There gradually appear games supporting Direct3D 10. They are just modified D3D 9 applications, and don't actively use new features of D3D 10. And the existing games surprise us with opposite results of graphics cards from the two main chipmakers. Of course, we can use them for comparisons, but it should be done with care... We don't see many synthetic and game tests supporting Direct3D 10 either. For example, Futuremark hasn't released the next version of 3DMark. But iXBT.com has its own synthetic benchmark, and we've been planning on updating RightMark3D for a long time already, in order to evaluate peak performance of D3D10 graphics cards in various tasks. The final version of RightMark3D 2.0 for benchmarking Direct3D 10 compatible graphics cards in MS Windows Vista has been released only recently. And we've immediately started using it in our articles. Some previously known tests were rewritten for DX10, new types of synthetic tests are added: modified tests of pixel shaders rewritten for SM 4.0, tests of geometry shaders, vertex texture fetch tests. It will be the first article about RightMark3D 2.0. We've tested a lot of graphics cards here. From now on we'll use the new benchmark in our articles. It should be noted that all these tests are purely synthetic. They usually use only certain GPU units, while influence of other units is intentionally reduced to minimum. All these tests load GPU only, CPU is not used. Now let's proceed to the long-anticipated DirectX 10 tests! Test conditionsOur version of RightMark3D 2.0 and its brief description can be downloaded at the following link: http://www.ixbt.com/video/itogi-video/ini/rmdx10.rar (4.5 MB) RightMark3D 2.0 requires MS Visual Studio 2005 runtime as well as the latest update of DirectX runtime. 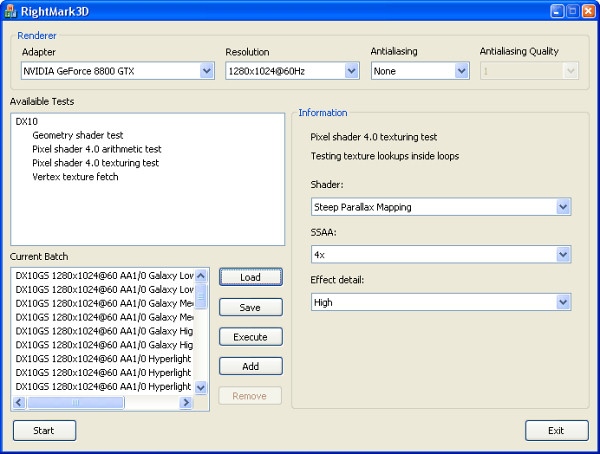 Note: the screenshot shows a special version of RightMark3D 2.0 that can test graphics cards in the batch mode. It's developed for our in-company tests, and we'll release it a bit later. Testbed configuration:
Synthetic tests were run with the following graphics cards:
In our comparison we'll use AMD-NVIDIA pairs of graphics cards with similar positioning: HD2900XT — GF8800GTS, HD2600XT — GF8600GT, HD2600PRO — GF8500GT. Some of the graphics cards are not yet available on the market, and if their real prices are different, you should adjust our conclusions. Prices are changing constantly, many of our conclusions are true only for the time this article is published. It has nothing to do with the theoretical comparison of Low-End and top GPUs from the same company, evaluation of their relative performance does not depend on pricing. Test Descriptions and ResultsResults of synthetic tests of unified DirectX 10 architectures should be analyzed with caution. These tests often load only one or two shader types: vertex, geometry, and pixel ones. Balanced load on all units will not reduce performance of the usual architecture. But in case of the unified architecture, it will load all units, and the rendering speed will drop down. PS 4.0 Tests (texturing, loops)RightMark3D 2.0 includes two PS 3.0 tests that we already know - the most complex of our synthetic tests of pixel shaders for Direct3D 9, as well as two brand new tests. The former have been rewritten for DirectX 10. Besides, they now have self-shadowing and allow supersampling, which increases their already heavy load on GPUs.
These two tests measure efficiency of executing looped pixel shaders with a lot of texture lookups (up to several hundreds of lookups per pixel in the heaviest mode!) and a relatively low ALU load. In other words, they measure a texture sampling rate and branching efficiency in a pixel shader. Fur will be the first pixel shader test. When used with the lowest settings, it uses 15-30 texture lookups from bump maps and two lookups from the main texture. The High Effect Detail mode increases the number of lookups to 40-80. When shader supersampling is enabled — the number of lookups grows to 60-120. And the High mode with SSAA is the heaviest mode — 160-320 lookups from a bump map. That's how it looks like: 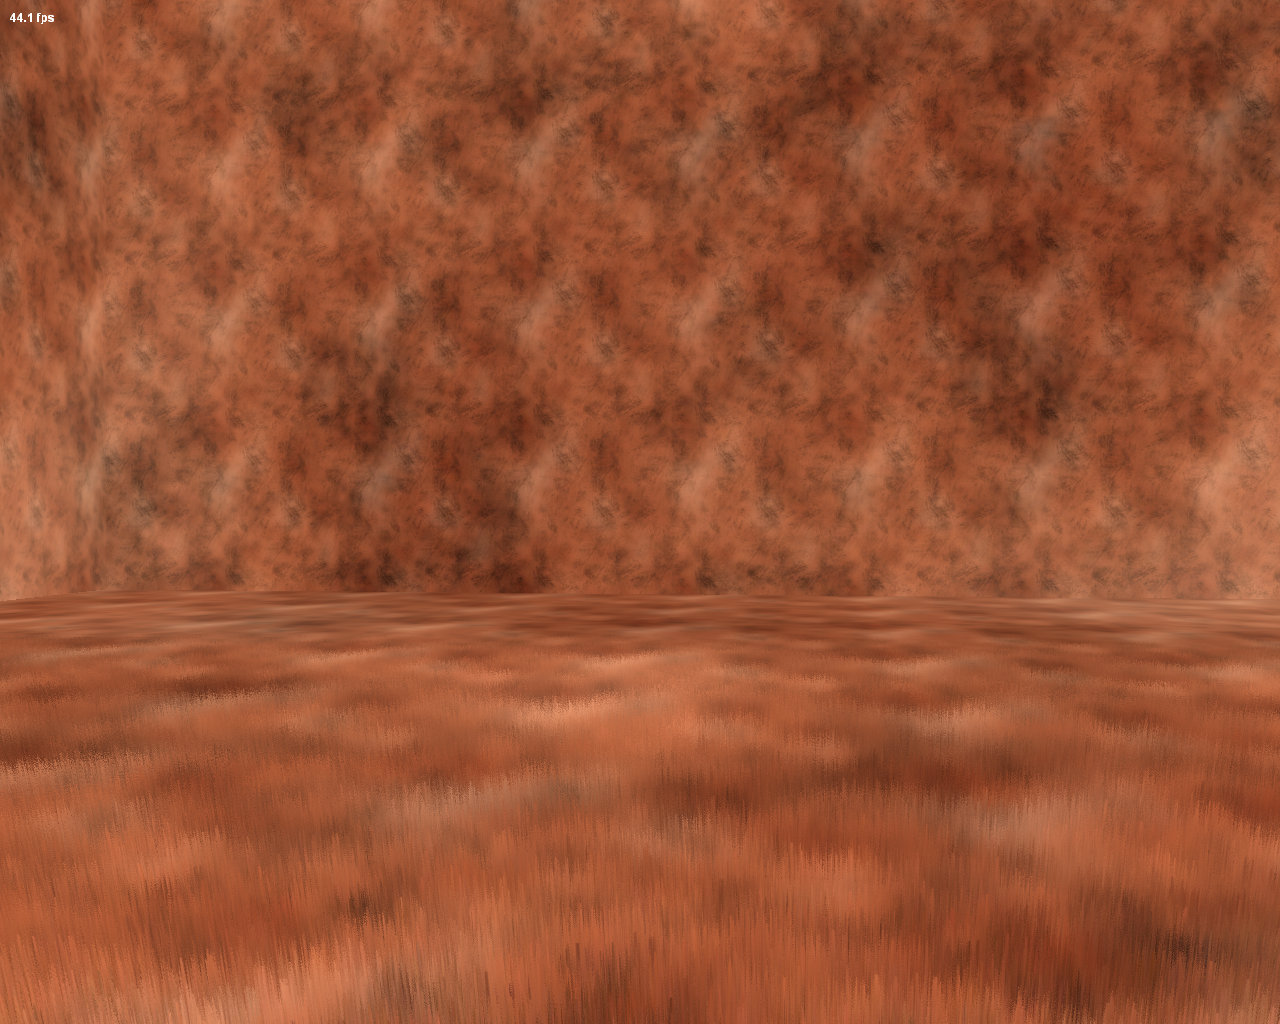 It's a very complex test, judging only by the description. Let's see how our DirectX 10 graphics cards cope with it. Let's see what happens in modes without supersampling - they are relatively simple, and the correlation of results in Low/High modes must be similar. The first tests of procedural fur with many texture lookups from complex looped shaders demonstrate a huge advantage of NVIDIA cards over AMD solutions. Even Mid-End NVIDIA GPUs perform on a par with the top AMD solution, to say nothing of G80-based chips, which are beyond competition. So, all NVIDIA solutions are faster than AMD cards in this test. This lag shouldn't have been possible even theoretically. So we can assume that AMD solutions demonstrate low results because of buggy drivers. Results demonstrated in different modes correlate well with each other — High-mode results are approximately 1.5 times as low as Low-mode results. What concerns the correlation of performance between top cards and Mid-End cards, we can say that cutting down execution units has a strong negative effect on Mid- and Low-End GPUs from both manufacturers. It especially concerns NVIDIA solutions (as well as AMD, if the assumption about buggy drivers is true) — G84 is outperformed by G80 threefold, and G86 demonstrates even twice as low results. Judging by the results, performance of this test depends not only on the number and speed of TMUs, or the difference would have been smaller. Let's have a look at results of this very test with enabled shader supersampling, which quadruples the load: Only top GPUs can cope with such test complexity, demonstrated framerates prove that. On the whole, this situation is similar to the previous case. But as shader complexity and GPU load grow, AMD solutions start to catch up with NVIDIA cards. The GeForce 8600 does not outperform the HD 2900 XT, although it's close. And the GeForce 8500 GT starts to lose to its competitor — the HD 2600 PRO. Supersampling theoretically quadruples the load. But G8x-based cards drop their performance by more than five times, while R6xx-based cards — only by three times. That's why the latter cards demonstrate relatively good results in these conditions. NVIDIA will most likely manage to reduce its performance drop with SSAA by optimizing its drivers. But AMD also has this opportunity... The second test that measures efficiency of executing complex looped pixel shaders with many texture lookups — Steep Parallax Mapping. With low settings it uses 10-50 texture lookups from a bump map and three lookups from main textures. In the heavy mode with self-shadowing, the number of lookups grows twofold (20-100). Supersampling quadruples this number (40-200 lookups). The most complex test mode with supersampling and self-shadowing uses 80-400 texture lookups, that is eight times as many versus the low mode. 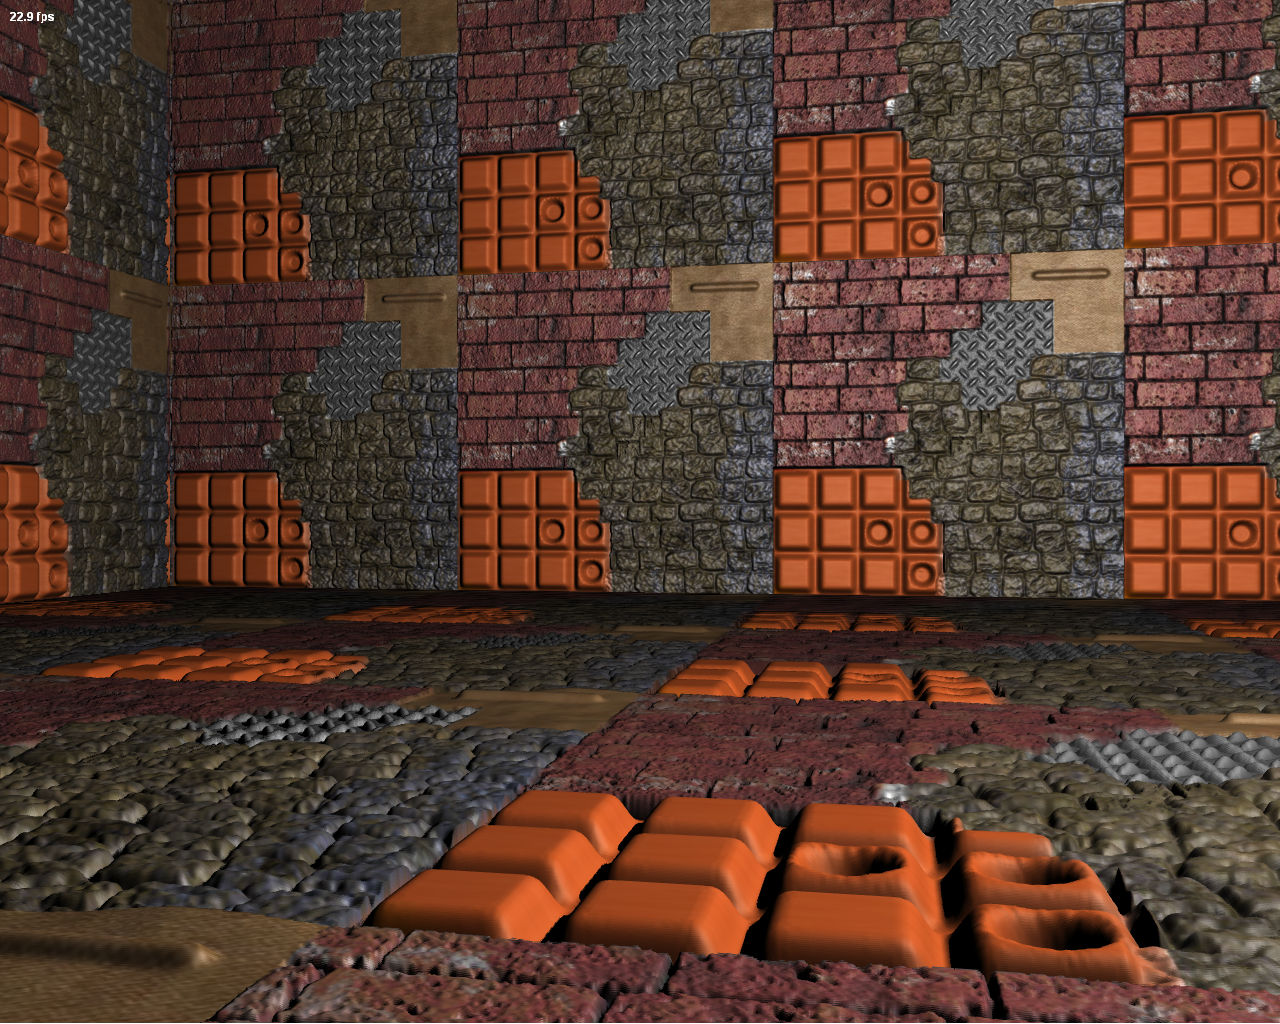 First of all we'll test simple modes without supersampling: The second test is more interesting from the practical point of view, because various parallax mapping methods are already used in games, and heavy modifications, like our steep parallax mapping, will soon appear in games. Along with supersampling, this test allows to enable self-shadowing, which increases the GPU load twofold. This mode is called High, the usual mode is called Low. ATI cards (and then AMD solutions) were traditionally good at our Direct3D 9 parallax mapping tests. This time they are not victorious. On the contrary, NVIDIA copes with this task faster without supersampling. Pay attention to the bigger performance drop demonstrated by AMD cards, when we switch from Low to High mode. When self-shadowing is enabled, NVIDIA results change by 1.5, AMD — over twofold. That's why the latter cards demonstrate relatively low results in High mode. So we can again congratulate NVIDIA with a victory in all price segments, especially in the top segment. Mid- and Low-End GPUs perform in the same way or a tad better: Mid-End GPUs are outperformed by top solutions by more than twofold. The cheapest solutions are outperformed by Mid-End products by the same value. Let's see what will change, when we enable supersampling. It caused a bigger performance drop in NVIDIA in the previous test, so it may improve the rating of AMD cards. FPS results again reveal complexity of our tasks even for high-end solutions. Have a look at the framerate with enabled supersampling and self-shadowing (the last graph). Their combined efforts increase the load almost eightfold and cause a catastrophic performance drop. The difference between performance of graphics cards from different price segments remains. Supersampling has a similar effect here — AMD R6xx-based cards improve their ratings relative to NVIDIA G8x. I wonder why NVIDIA cards dropped performance fourfold (equal to the theoretical one), while AMD cards — only threefold. But AMD is still not victorious. The only exception is in the Low End segment - the GeForce 8500 GT (G86) is outperformed by the HD 2600 PRO (RV630). NVIDIA is victorious in other pairs. PS 4.0 Tests (computing)The next couple of pixel shader tests contain minimum texture lookups. It's done to reduce the influence of TMU performance on the overall speed. But they use a lot of math operations (sin, cos, involution, etc.) These tests measure computing performance of GPUs, the speed of executing math instructions in a pixel shader. The influence of other execution units is minimized. The first computing test is called Mineral. It's a complex procedural texturing test, which uses only two texture lookups and 65 instructions like sin and cos, over a thousand instructions per pixel in total. 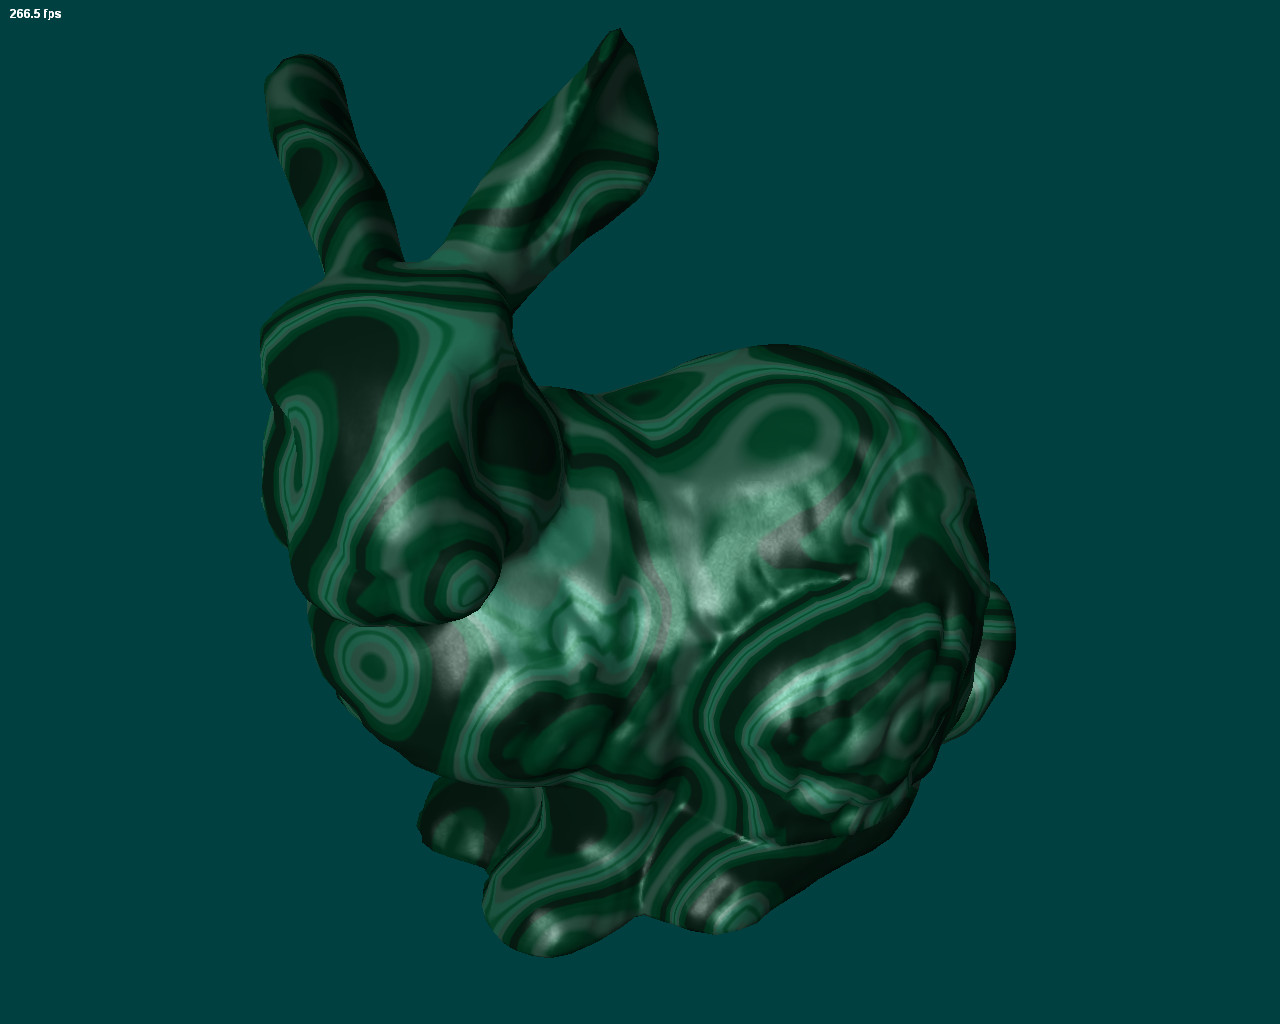 According to our previous version of Direct3D 9 synthetic tests, AMD's architecture performs well in complex computing tasks. All solutions from this company outperform their competitors. But NVIDIA G8x-based cards are not much slower. AMD solutions are indeed faster in all price segments. But the breakaway from NVIDIA in High-End, the most strategically important segment, is not big, especially considering that NVIDIA also offers more expensive solutions. The G86-based solution cannot cope with the RV630 in Low- and Mid-End. It performs on a par with RV610. And the fast G84-based solution is outperformed by the top RV630-based card. On the whole, AMD is victorious here, if we take into account real and estimated prices for all solutions. Mid-End solutions from both manufacturers are approximately twice as slow as top solutions in this test. Performance of Low-End chips is twice as low as that of Mid-End ones. This ratio is again strictly proportional to cut down units and operating frequencies. Low- and Mid-End DirectX 10 GPUs are not that bad... We don't mean maximum settings in future D3D 10 games, of course. Even High-End cards will hardly cope with them. The second test of this group is called Fire, it's even harder for ALUs. It looks up only one texture, but the number of sin/cos-like instructions is increased to 130, over a thousand instructions in total. 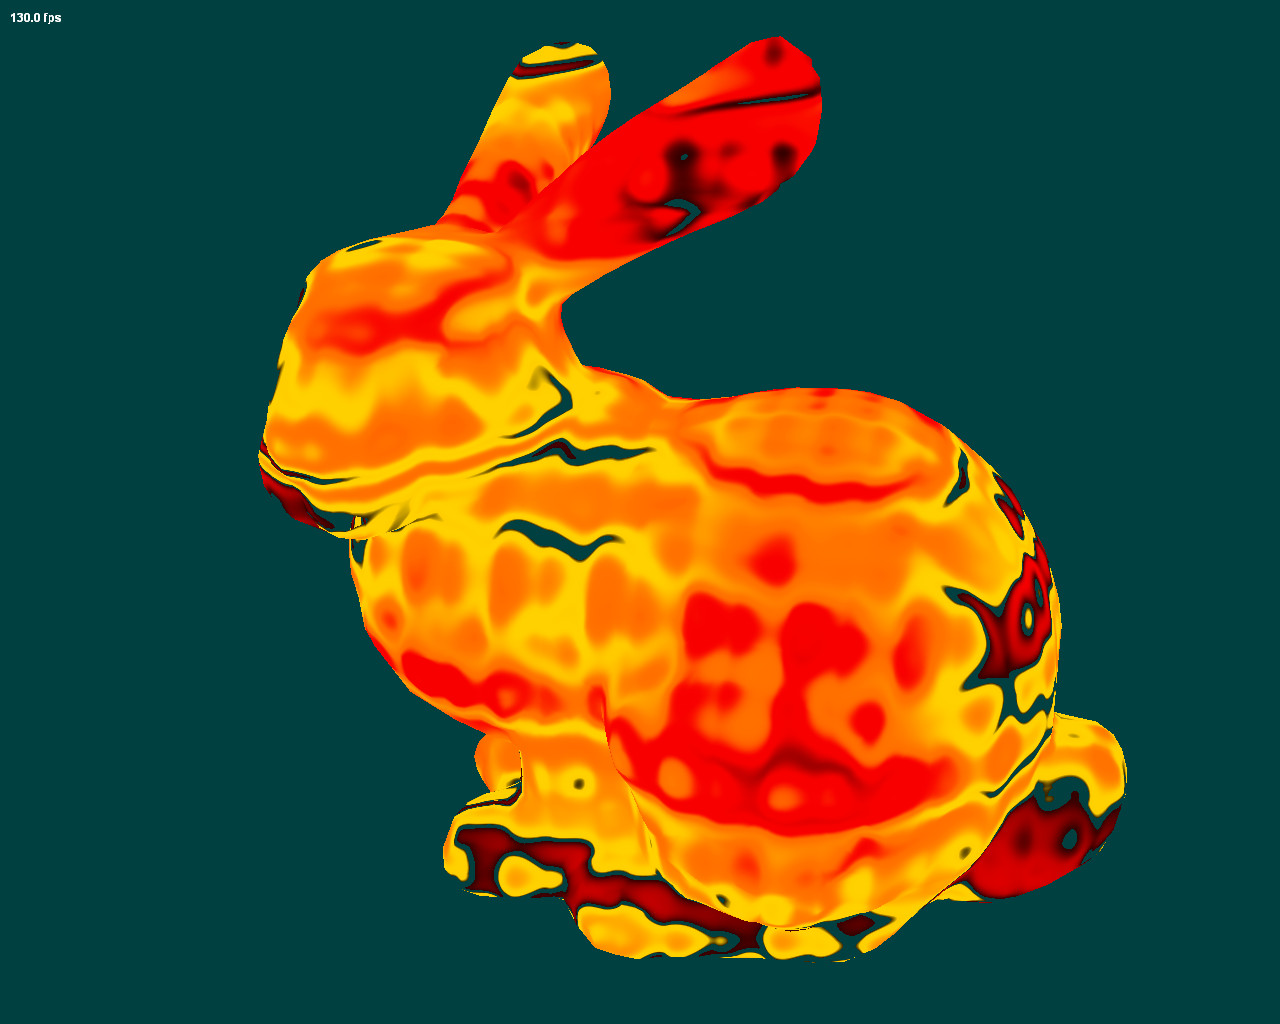 Let's see what changes as the load grows: Note that a well-posed comparison in the Fire test is impossible — AMD drivers have a bug that does not allow their products to demonstrate real results they are capable of. Before you draw conclusions, wait for bugfixes. The difference between the Low-End G80 solution and the top G84-based card is again a tad over two times, which is close to the difference in frequencies and the number of execution units. The same concerns the Low-End GPU from NVIDIA. Geometry Shader TestsRightMark3D 2.0 includes two tests of geometry shaders that benchmark their performance in various conditions. The first test is called Galaxy. It's similar to point sprites from previous Direct3D versions. This test animates a system of particles, a geometry shader creates four vertices (quad expansion) that form a particle from each point (from 0.5 to 2.0 millions in total). To all appearances, such algorithms will be widely used in future DirectX 10 games, so these test results are especially interesting.  It should be noted that the altered balance in our tests of geometry shaders does not change visual results. The resulting image is absolutely identical in both cases, only scene processing methods are different. The "GS load" parameter determines which shader performs the task — vertex or geometry. But the amount of computing is identical in both cases. Let's analyze the first modification of Galaxy with vertex computing for three levels of geometric complexity: We can see that the performance ratio with different scene complexity levels is identical for all conditions, only absolute results are different. Performance of all solutions corresponds to the number of points, FPS is halved each step. NVIDIA graphics cards perform a tad better here, demonstrating high results in all compared pairs: the GeForce 8800 GTS is faster than the HD 2900 XT, the GeForce 8600 GT is faster than the HD 2600 XT, the GeForce 8500 GT is faster than the HD 2600 PRO. There is a small difference in performance. The task is not that complex for modern graphics cards, top solutions insignificantly outperform Mid-End graphics cards, the difference does not reach twofold. But Low-End cards are outperformed by Mid-End solutions by two times. The situation may change, when some computing is offloaded to geometry shaders. It concerns comparisons of solutions from different manufacturers as well as price segments. We'll check it up now. Indeed, there are some changes. G8x-based solutions do not always defeat R6xx-based cards in all cases with various geometry levels. Although the GeForce 8600 GT still outperforms the RADEON HD 2600 XT, and the GeForce 8500 GT is a tad faster than the HD 2600 PRO, the top graphics card from AMD shoots forward. Interestingly, there is almost no difference between results of the GeForce 8800 GTX and GTS, the number of their active execution units being different. As a result, AMD is still outperformed. It feels strange, considering high efficiency of executing vertex shaders demonstrated by these GPUs in our previous tests. Perhaps, results will be different in the second test... Hyperlight is the second test of geometry shaders in our new RightMark3D. It uses several interesting techniques: instancing, stream output, buffer load. It uses dynamic geometry generation by outputting data into two buffers. This test also uses the new DX10 feature — stream output. The first shader generates ray directions, their speed and growth vectors. These data are stored in a buffer, which is used by the second shader for rendering. Each ray point is used to generate 14 vertices in a circle, up to a million output points. 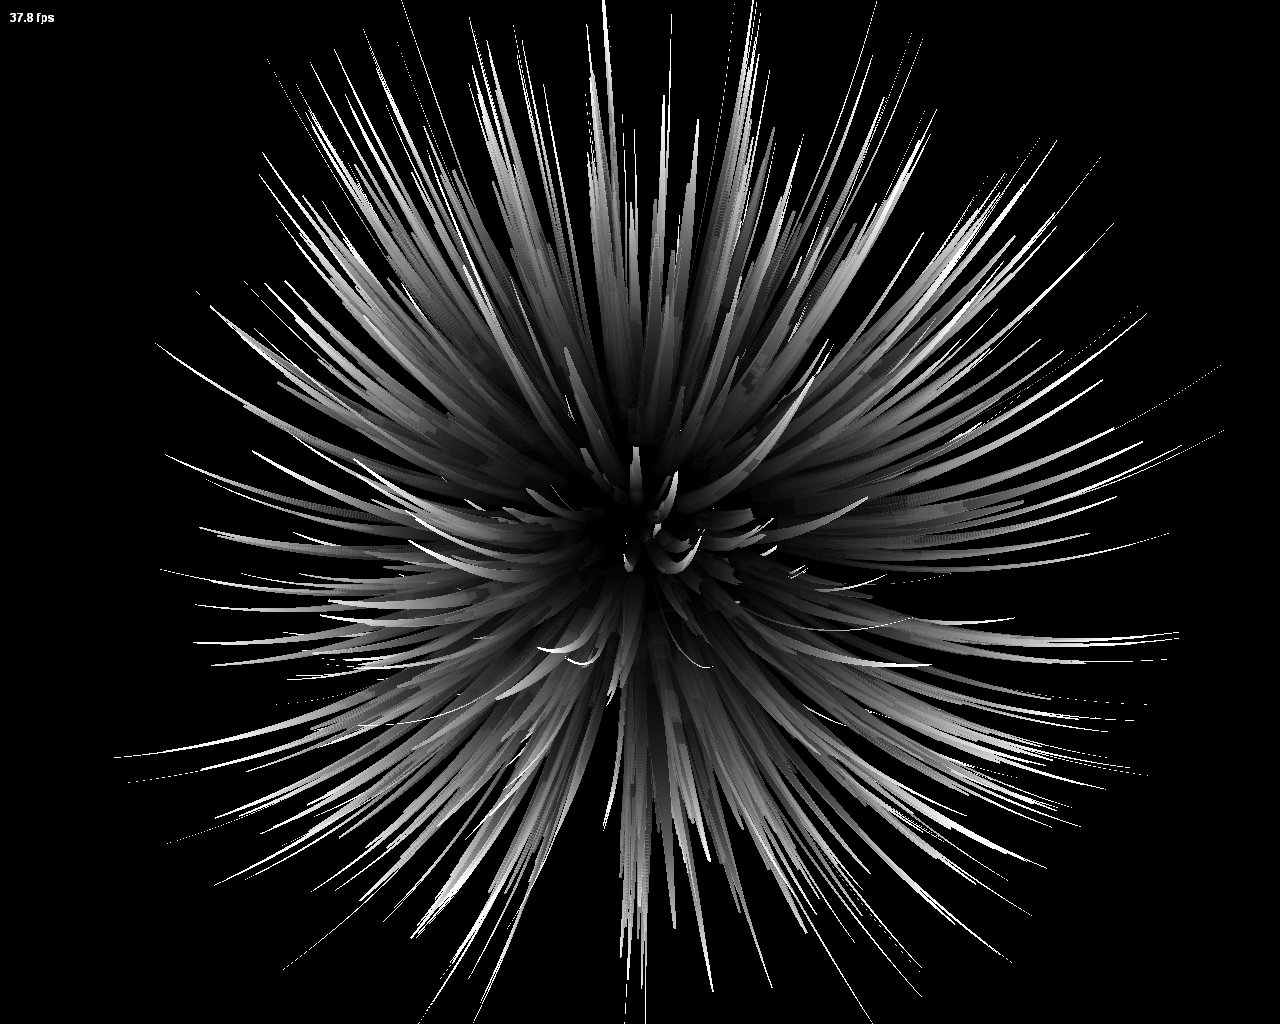 The new type of shader programs is used to generate rays. If "GS load" is set to "Heavy" — it's also used for rendering. That is in Balanced mode, geometry shaders are used only to generate and grow rays. Output is up to instancing. The geometry shader also outputs data in the Heavy mode. Let's analyze the easy mode first: Results of various graphics cards are practically no different, regardless of geometry complexity of the scene. Performance scales well and almost corresponds to theoretical parameters. According to these parameters, each next level of Polygon count must be twice as slow. NVIDIA graphics cards again demonstrate a great advantage, when the load on geometry shaders is not that big. The RADEON HD 2900 XT is outperformed even by the GeForce 8600 GT, and the cheapest solution from NVIDIA slightly outperforms the HD 2600 XT. There is no need to mention the G80 — it's far ahead. Performance of these solutions is evidently limited by something else, because they are not much faster than G84. Interestingly, performance of the HD 2400 XT almost matches that of the HD 2600 PRO. Both results are much lower than that of the HD 2600 XT. We haven't seen it last time. All these results may change in our next test, where geometry shaders are used even more actively. It will be especially interesting to compare results obtained in Balanced and Heavy modes.
This situation is quite different! We can say for sure that AMD R6xx GPUs do this work much faster than NVIDIA G8x ones, the advantage reaches more than two times. Performance of these tests depends much on complexity of the work for geometry shaders. It's not just that AMD chips do the work faster than NVIDIA solutions, this difference grows with geometry complexity. So the more complex the work for a geometry shader, the faster R6xx versus G8x. But when we compare results in various modes, when different shader types are responsible for the output, NVIDIA's results in the Balanced mode are better than AMD's results in the Heavy mode. The resulting images are identical. So developers of 3D applications will have to optimize their code for two different architectures, in order to get maximum performance from both. NVIDIA graphics cards drop performance, when we switch from instancing to a geometry shader for output, they become 2-6 times as slow. The cheaper the GPU, the bigger the difference in rendering speed between these two modes. It's vice versa with AMD. Results with a geometry shader used for output are higher than those with instancing, but the difference is not as big. So as the work load (a number of generated vertices) grows, geometry shaders work better in AMD chips. But reality differs from synthetic tests - developers are free to choose their methods, and if vertex shaders will be expedient in their projects, they'll use them. We are also interested in the difference between performance in Balanced and Heavy modes of various GPUs from the same series. The funny situation with the HD 2400 XT and HD 2600 PRO got worse — now the Low-End chip outperforms the faster GPU. The problem is probably in the higher frequency of the Low-End solution and limited triangle setup performance. That's not the case with NVIDIA. All GPUs perform strictly by their ranks — G84 is slower than G80 by 2-3 times, and G86 — by 4-6 times. The HD 2600 PRO has another riddle we cannot solve — only this graphics card drops performance, when we switch from the Balanced to Heavy mode with lots of geometry. We should mention a bug in AMD drivers that appears only with the HD 2900 XT - this card does not output any picture in the heaviest mode of the Hyperlight test and demonstrates an anomalously high result, which cannot possibly be correct. That's why the last diagram does not contain a result of this graphics card. Here is the main conclusion on this part of the article — different tests of geometry shaders can demonstrate different results, sometimes NVIDIA cards will be faster, sometimes — AMD cards. As geometry complexity grows, AMD shoots forward. But we should remember that we analyze synthetic tests. Real performance will be demonstrated only in games, which are extremely rare. Vertex texture fetch rateVertex Texture Fetch tests measure the speed of many vertex texture fetches. The tests resemble each other. Theoretically, the correlation between results in the Earth and Waves tests must be approximately the same. Both of them use displacement mapping based on fetched texture data. But the Waves test uses conditional branches, while the Earth test doesn't. The first test (Earth) does 32 (for Effect detail Low) or 48 (Effect detail High) bilinear texture fetches per each vertex. The number of vertices can be changed. Here are corresponding values for three possible modes: 30000, 124000, and 280000. 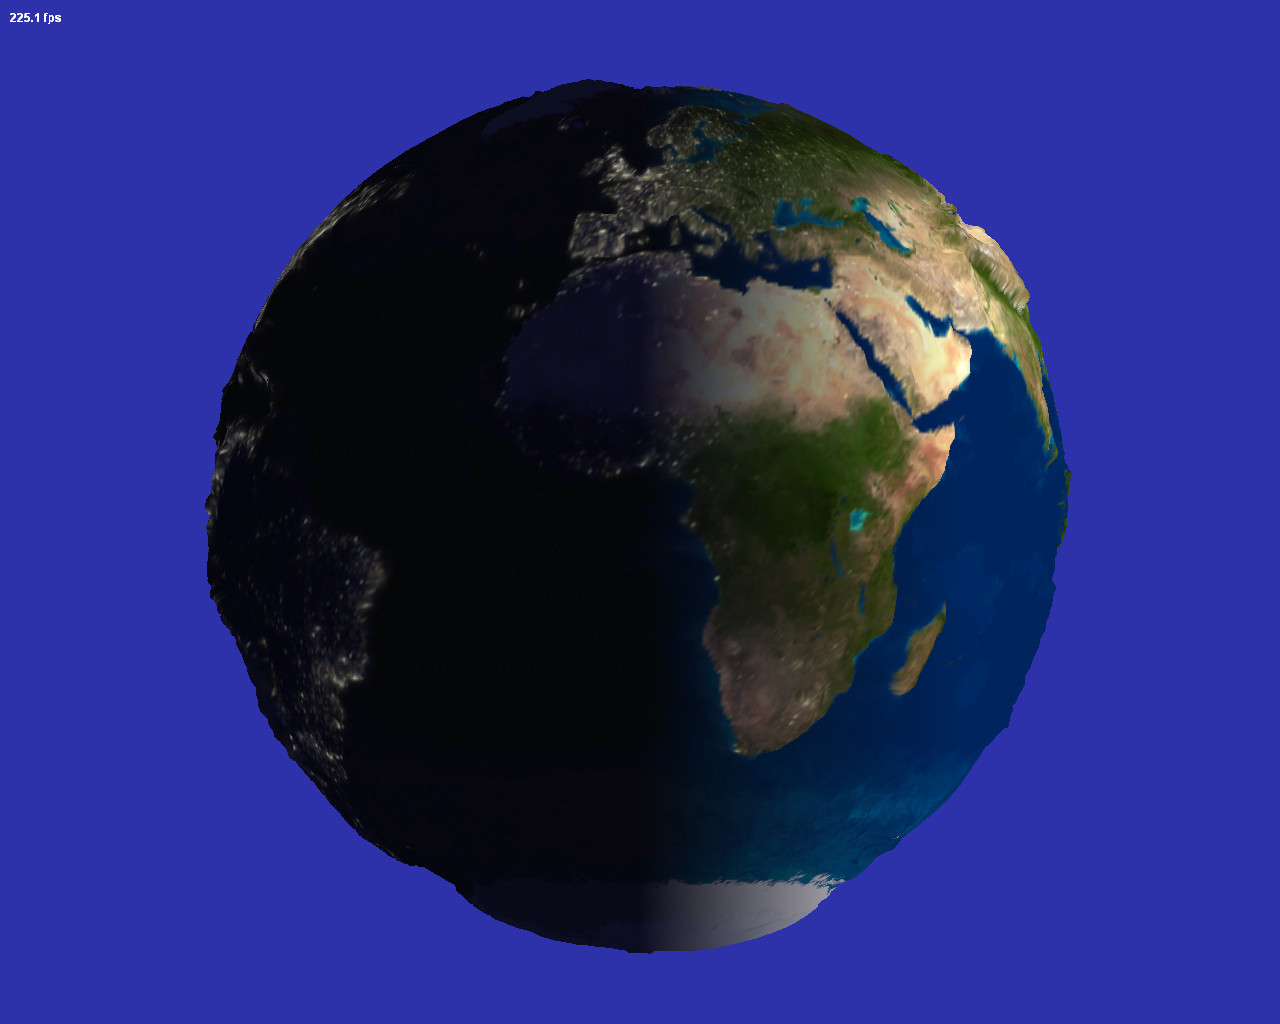 Let's analyze the Effect detail Low mode: All three graphs show similar relative performance of graphics cards. Only the GeForce 8500 GT slumps faster under heavy load than the HD 2600 PRO. While the former card wins in the Low mode, the AMD solution is faster in the High mode. The HD 2600 XT and GeForce 8600 GT perform differently. The AMD card is faster in the Low mode, and it's a tad slower in the High mode. There is no competition in the top segment, all G80-based cards are faster than R600 solutions. The performance correlation between top solutions and Mid/Low-End graphics cards remains the same, up to 2-3-fold difference between the former and 2-3-fold difference between the latter. There is an interesting big performance difference between the HD 2600 PRO and the HD 2600 XT. We cannot explain it by the different number of TMUs, because these cards use identical chips. Test results my be affected by memory bandwidth, which differs significantly in the PRO and XT modifications. Let's see results of this tests with more texture fetches: AMD cards lost some performance here relative to their competitors. All NVIDIA cards are victorious here owing to more TMUs. The difference between AMD and NVIDIA in these conditions is up to 1.5-2 times. NVIDIA GPUs evidently fetch texture data more efficiently, judging by our tests and vertex/pixel shaders. Let's have a look at results of the second VTF test. I wonder whether similar problems will appear there. The Waves test executes fewer texture fetches, but with conditional branches. The number of bilinear texture fetches in this case reaches 14 (Effect detail Low) or 24 (Effect detail High) per each vertex. Geometry complexity changes like in the previous test. The total number of vertices can equal 124000, 498000, and 1122000 for "Polygon count Low", "Medium", and "High" modes correspondingly. 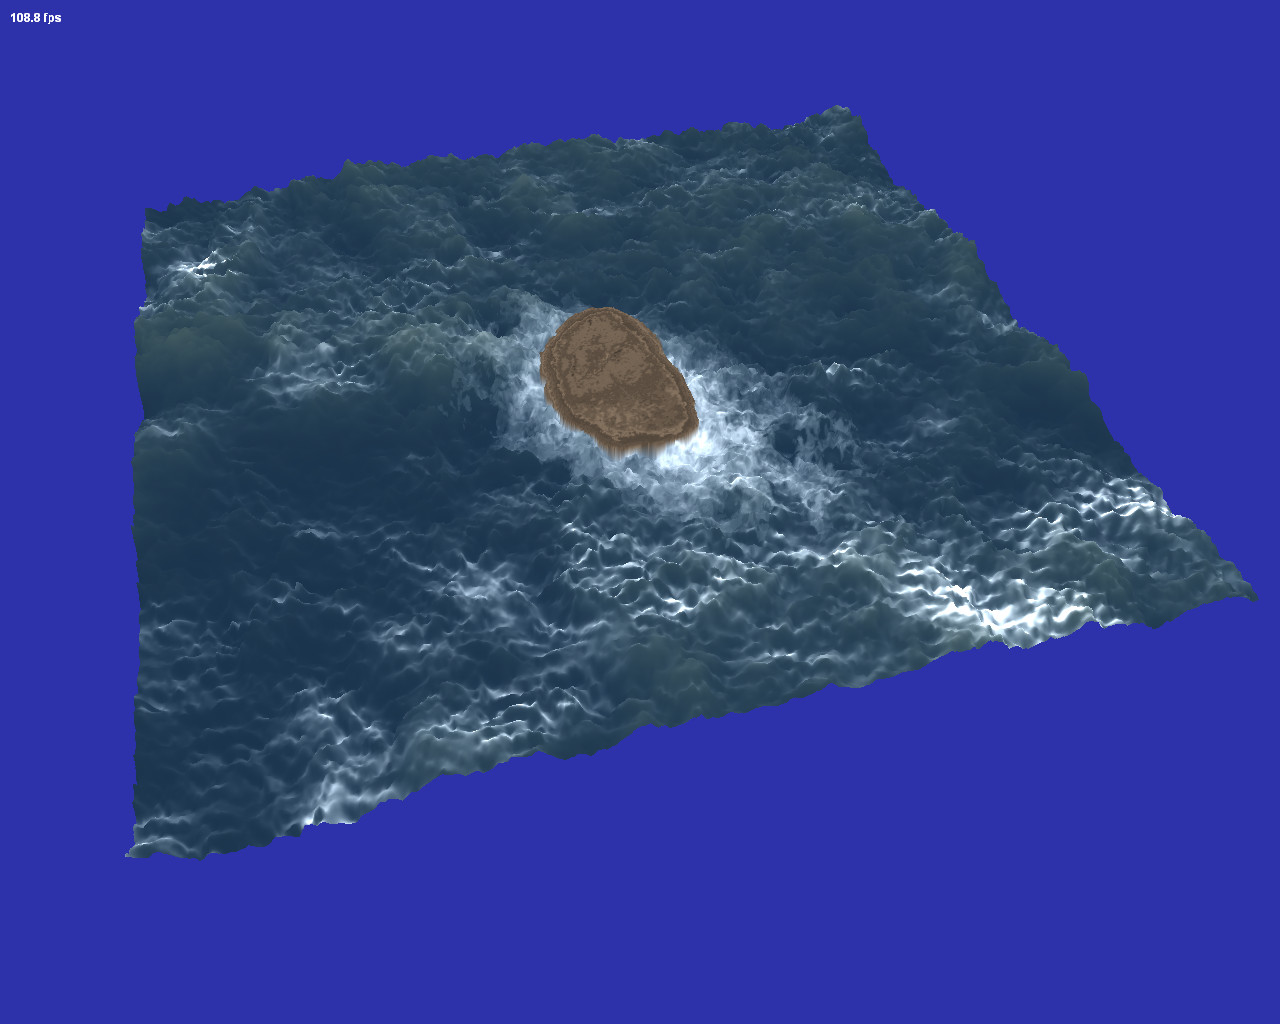 The Waves test does not reveal anything new. Everything is similar to the previous Earth test. Some NVIDIA cards (G80 and G86) lose frames per second as geometry grows a tad faster than the AMD cards (R600 and RV630). But NVIDIA cards are still the best in most cases. These results are also similar to those demonstrated in the previous cases. Only the advantage of NVIDIA solutions is more apparent. On the whole, NVIDIA G8x-based cards execute our vertex texture fetch tests faster than AMD R6xx cards. That's the main conclusion on this series of VTF tests. Conclusions on the synthetic testsSo, RightMark3D 2.0 has debuted in our web site reviews. Its tests involve almost all aspects of new Direct3D 10 features. They can be flexibly configured to evaluate relative performance of all Direct3D 10 GPUs from AMD and NVIDIA. Both unified architectures fare well in our new Direct3D 10 tests. We haven't found any significant performance drops, except for a couple of situations with rude bugs in AMD drivers. Both families (R6xx and G8x) are notable for high computing and texturing performance, they cope well with complex shaders of all types.
Alexei Berillo (sbe@ixbt.com)
August 22, 2007 Write a comment below. No registration needed!
|
Platform · Video · Multimedia · Mobile · Other || About us & Privacy policy · Twitter · Facebook Copyright © Byrds Research & Publishing, Ltd., 1997–2011. All rights reserved. |


