 |
||
|
||
| ||
|
||
|
||
| ||
IntroductionOver a year has passed since our review of NVPerfKit 2. We've been using PerfKit and PerfHUD all this time to analyze modern games, and game developers have been using these tools in their projects. Much changed since that time: there appeared new Microsoft Windows Vista and DirectX 10 API, NVIDIA launched a new series of graphics cards based on G8x GPUs supporting this API. That outdated version of PerfKit didn't support these new features, which were vital for game developers. So the kit had to be updated. In the end of this summer, NVIDIA launched PerfKit 5, where PerfHUD suffered most changes. As you can see, both names got rid of the NV prefix. Now these tools are called NVIDIA PerfKit and NVIDIA PerfHUD. These tools are vital for 3D developers, because modern 3D applications are too complex to let developers use all features of the new GPUs. They will need utilities to help them detect mistakes and performance bottlenecks. Video chips perform a lot of various operations with video pipes during rendering. General performance of an application depends on the slowest sector, so you need convenient tools to detect such bottlenecks. Complexity of pipelines has grown for the last years, and it's very difficult to make head or tail of these processes without convenient tools. Especially as unified shaders (vertex, geometry, and pixel ones) changed the approach to optimizing 3D applications. The habitual approach to shifting the load from pixel to vertex shaders and back may not work here, especially if the number of vertices will be similar to that of pixels. Pixel or vertex shaders do not limit performance separately any more, now we've got only unified shaders to worry about. There used to be only simple debugging tools, then special tools appeared, such as PerfHUD. The utility is successfully used to develop most popular games by all big developers. Let's list some titles: Battlefield 2142 (DICE), World of Warcraft (Blizzard Entertainment), Gamebryo (Emergent Technologies) - TES4: Oblivion, Company of Heroes (Relic Entertainment), Settlers VI (Blue Byte). These names are published by NVIDIA itself. According to our research, PerfHUD was used to develop the following projects: Armed Assault, Gothic 3, Far Cry, Serious Sam 2, S.T.A.L.K.E.R., Dark Messiah of Might and Magic, Need for Speed: Carbon, Test Drive: Unlimited, Splinter Cell: Double Agent, GTR 2, and many others. PerfHUD reached this level of popularity, because it really helps developers optimize their projects in an easier and more efficient way. According to NVIDIA, hundreds of PerfHUD users improved performance of their programs. PerfHUD compares favorably to similar utilities, as it works in real time with the analyzed application. The entire process of debugging and detecting bottlenecks is carried out right in an application, while other utilities use offline analysis, which is less convenient. The new PerfKit 5 is available at NVIDIA web site for developers, we offer you a review of its features. PerfKit 5 OverviewPerfKit 5 is a bundle of programs for developers of 3D applications, which contains powerful tools to analyze performance of Direct3D and OpenGL applications using performance counters of the driver and hardware counters of a GPU. Performance counters may be used to determine the reasons for low performance of 3D applications and to find out how well a given application uses available GPU capacities. PerfKit 5 components:
Even though Direct3D features of PerfKit are richer than those for OpenGL, this API is also supported. NVIDIA recommends using gDEBugger for these applications. A pre-release version of this utility came with PerfKit, and now you can download it from the official web site for developers. PerfKit 5 system requirements
This special driver is a must for PerfKit. These debug drivers are also called instrumented drivers. They contain additional code to monitor and measure performance. Debugging tools, such as PerfHUD, communicate with drivers to get necessary information about GPU and NVIDIA driver's operations. Instrumented drivers should not be used for comparative performance tests, because they affect rendering speed. However, this negative effect does not exceed several percents, and it can be disabled in NVIDIA control panel. Let's review the key features of PerfKit one by one. We'll start with a brief description of counters, as they are used by the entire kit, including popular PerfHUD (it actively uses counters). PerfKit countersPerfKit offers counters of several types: hardware counters that read data from a GPU, software Direct3D and OpenGL counters that contain data obtained from the debug driver. There are also so-called "simplified experiments" - multipass operations that provide detailed information about GPU status. Hardware counters contain results accumulated since the last time a GPU was sampled. For example, the number of triangles in the setup_triangle_count counter equals the number of polygons processed since the last query. When PDH is used to read data from counters, for example, from built-in Performance Monitor (PerfMon) from Windows, they will be queried one time per second. But when you integrate counters into your applications, you can query them as often as you want. Unlike hardware counters, driver counters return values accumulated for the last frame rendered. When using the PDH interface, counters can be reported in one of two methods: raw and percentage. Raw counters count events (triangles, pixels, milliseconds, etc.) since the last call. Percentage counters return the time a certain GPU unit was busy or waiting data from another unit. If you call the counter data from a program using NVPerfAPI functions, they return raw values and the total number of completed GPU cycles. Triangle and vertex counters return a number of processed elements. Some of software performance counters for Direct3D and OpenGL applications: FPS, a number of draw calls, a number of vertices and triangles per frame (with/without instancing), video memory usage (textures, vertices, buffers, etc), several special SLI counters that show the number and volume of data transfers from GPU to GPU, the number of transferred render buffers, etc. Hardware counters are more interesting: GPU Idle, Shader Utilization, ROP Utilization, Shader Stalls, ROP Stalls, Vertex Count, Primitive Count, Triangle Count, and Pixel Count. Let's examine GPU counters in more detail. More of them were added in PerfKit 5, so it will be easier to analyze performance of 3D applications now.
Using performance counters from applicationsThere are two ways to access NVIDIA's software and hardware counters from user applications. You can use NVPerfAPI and Performance Data Helper (PDH) interfaces for that. PDH is a general interface to access performance counters, offered by Microsoft in its operating systems. It's used by PerfMon and some other utilities. For example, there is an open-source project of a utility to access PDH counters - PerfGraph. Unfortunately, it's not developed anymore, but the latest version is quite usable. It can collect data from software and hardware counters, as well as other system data. However, it does not allow to save the data for further analysis. It's a cross-platform project, there are versions of this utility for Windows and Linux. Using NVPerfAPI NVPerfAPI is a special program interface that gives to developers of 3D applications access to performance counters and simplified experiments, which provide more details about GPU performance nuances. PerfKit includes the corresponding NVPerfAPI libraries and sample code. You just have to add several lines of code into a user application. By the way, unlike software counters, which can be called an unlimited number of times, there is a certain limit as to how many hardware counters can be read simultaneously. Simplified Experiments (SimExp) One of the most useful features of PerfKit is the option to run experiments on certain GPU units and to collect performance data. They are called simplified experiments. SimExp provides "Speed of Light" (SOL) and "Bottleneck" values for several sections in the GPU pipeline. The first digit shows the time when a certain GPU unit was used. The "value" returned tells us how many cycles during the experiment the unit was active, and the "cycles" returned gives the total number of cycles it took the experiment to run. Similarly, when running a Bottleneck experiment, the "value" represents the amount of time this unit was acting as a bottleneck and the "cycles" is the experiment duration. Using PerfSDK features via Performance Data Helper To start collecting data with Performance Data Helper, you need to tell the driver and PDH system what counters you are interested in collecting. This is done through the NVIDIA Developer Control Panel, which is started from Windows Control Panel. Once it is open, you can select which signals to report while 3D applications are running. 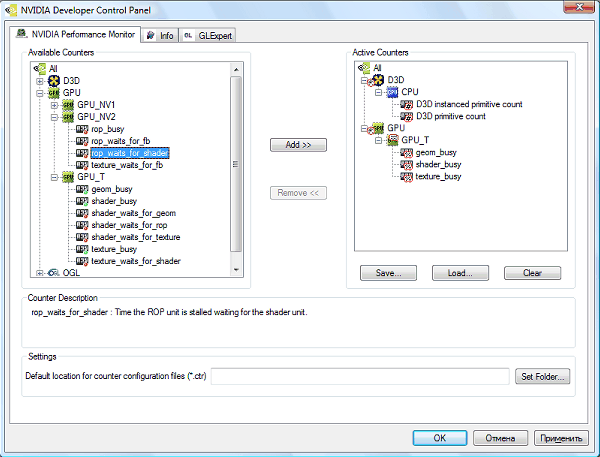 Added counters must be in the list of Active Counters. It's mentioned that a GPU can collect data from a limited number of hardware counters, and this number varies in different GPUs. The number of software counters running simultaneously is not limited. But each signal reduces performance, so the best solution is to enable only those that you really need at the moment. If you run your application in a window, you can interactively enable/disable GPU counters. This allows you to set your application up to sample all of the counters of interest. By the way, you can get the total number of counters and some system information right from the Developer Control Panel: 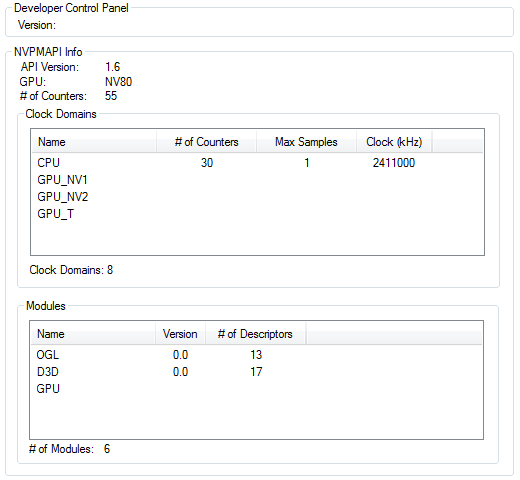 Using the standard Windows utility - Performance Monitor One of the simplest ways to see the counters is through the Windows system utility called PerfMon. This helpful utility graphs PDH information over time. Once you have used the NVDevCPL to enable the counters you want to sample, you can add them to the PerfMon graph. You need to select the NVIDIA GPU performance object to add hardware counters and NVIDIA Direct3D Driver or NVIDIA OpenGL Driver to add software counters. That's how the graph looks like. 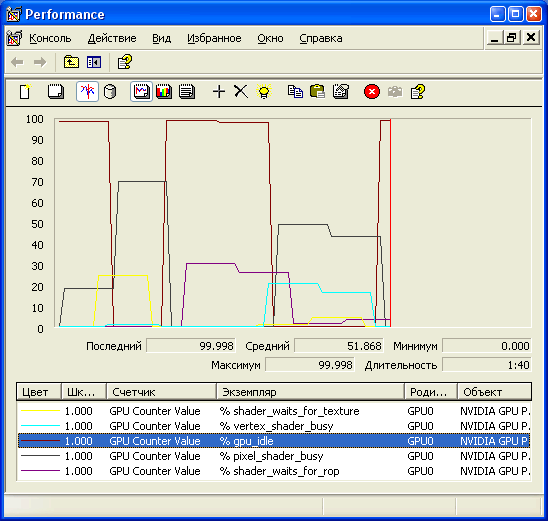 This is not very convenient. Third-party utilities are better, they allow to analyze data and save them, or you can use a PIX plug-in. NVIDIA Plug-in for Microsoft PIX for Windows PerfKit includes a plug-in to import values of PerfKit performance counters into Microsoft PIX for Windows. This PIX plug-in displays driver and GPU counter data alongside the associated Direct3D calls for additional correlation and performance tuning. The PerfKit installer writes the PIX plug-in into the corresponding directory of DirectX SDK, where this utility is located. To use these features, don't forget about a mandatory instrumented driver and necessary settings in the NVDevCPL. 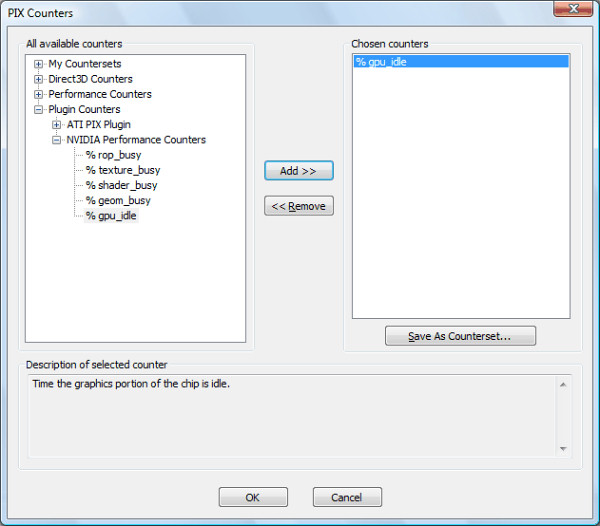 To set up sampling, first remember to enable the counters that you are interested in the NVDevCPL. Once this is done, you are ready to enable the counters in PIX. From the Experiment window in PIX, make sure you choose "More Options", then the action type to "Set Per-Frame Counters", and click the Customize button. Then select necessary counters from the Plug-in Counters - NVIDIA Performance Counters list in the "PIX Counters" dialog. These will now show up in the data stream that PIX produces. Moreover, if PIX graphing and analytical features are insufficient, you can export all data into CSV format and analyze them in other programs. 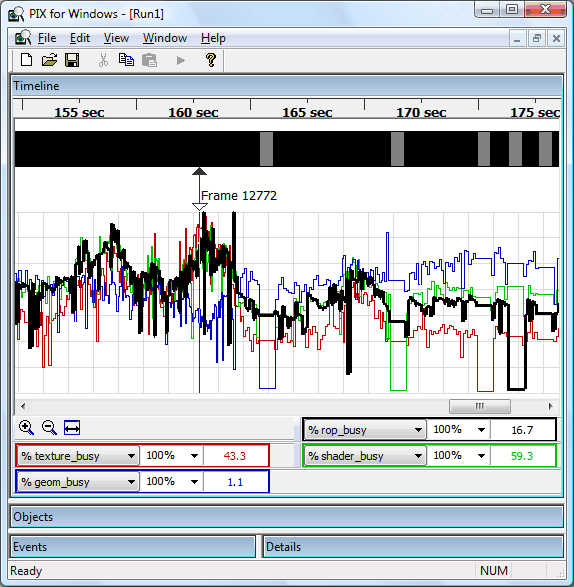 Enhanced PerfHUD 5.0PerfHUD is a convenient utility to tune performance and debug Direct3D applications. It helps solve difficult problems with rendering speed and quality by monitoring performance, inspecting pipeline status, and getting debug information, which appears on the heads-up display (HUD). That is, the PerfHUD interface is drawn right on the application frame. It contains graphs, text fields, and controls. The program collects data from an application, driver, API, and GPU. Once started, it works together with an application and displays the data it collects on the foreground of the application. PerfHUD uses special code in the driver that collects data from GPU counters as well as intercepts API calls to gather statistics and integrate into the application. That's why there is some performance drop compared to the usual mode, without the special driver and enabled HUD. However, it does not interfere with the operation. This utility shows how a frame is rendered on-the-fly, call by call. At the same time, you can analyze (the latest version of the utility also allows to modify!) shaders, geometry data, textures, etc. Other utilities, such as PIX, also allow to monitor all Direct3D API calls, but they don't do it in real time, only at user's requests. So PerfHUD is more convenient to use, although it offers a tad fewer features than PIX. On the whole, PIX works better for debugging, while PerfHUD is a better tool for detecting and eliminating performance bottlenecks. We cannot actually compare PIX and PerfHUD directly. PerfKit facilitates your work with PIX, it gives you an opportunity to use low-level GPU counters, which data are very relevant for debugging. PerfHUD 5 is the fifth version of NVIDIA's performance analysis utility, one of the key components of PerfKit. Like the previous version, PerfHUD 5 shows how a 3D application renders a frame call by call, and offers several so-called experiments. All these features work in real time. A single key press gives you the list of draw calls, grouped by time. It's usually not easy to collect data about GPU units, especially as modern games render a frame with several thousand draw calls. PerfHUD allows to split a scene and analyze each call separately. It makes the task easier by displaying errors and performance bottlenecks so that a developer could eliminate them. PerfHUD 5 has a lot of improvements, which have to do with functionality and user interface. The key new features: Full support for NVIDIA G8x GPUs, Direct3D 10 API, and Microsoft Windows Vista, as well as a lot of functions and counters, a new custom user interface, you can now edit shaders, etc. Here is a detailed list of changes in NVIDIA PerfHUD 5:
Along with G8x and Direct3D 10 support, the most interesting new feature, in our opinion, is editing shaders and render states in real time. The utility allows to modify shader code on-the-fly and immediately see the result, which makes it much easier to test new ideas and optimize shader code. As PerfHUD is a powerful tool to analyze 3D applications, NVIDIA implemented protection to restrict the access of third-party users to analysis of applications without developers' consent. In order to use PerfHUD, an application should support it - it must have several lines of code in the DirectX initialize subroutine. When an application is started under PerfHUD, the driver creates a special video adapter to be used by the application, or PerfHUD won't work. Besides, PerfHUD works only with the reference rasterizer. An application will still use hardware features of the GPU, though it selects the NVIDIA PerfHUD video adapter. This solution has been used for a long time, since PerfHUD 2.x, so developers can use the new version in their programs without any modifications. Applications that do not support PerfHUD in the described way, cannot be analyzed with this utility. Since PerfHUD 5, the conditions have been toughened. While we could see the interface and some data (FPS and a number of triangles in a scene) on a monitor, now we don't see PerfHUD data at all: 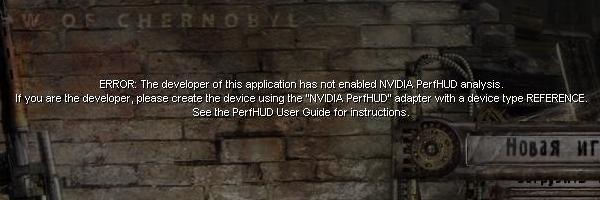
In order to run a Direct3D application together with PerfHUD, you should specify a path to an executable file in the command line of the utility or drag the application or its shortcut to the PerfHUD icon. The interface of a program uses hot keys for fast access to functions, there are also mouse control elements. Activity of the interface switches between a user application and PerfHUD with the hot key specified in the settings. When the program is started for the first time, it displays a configuration window, where you should specify key settings. 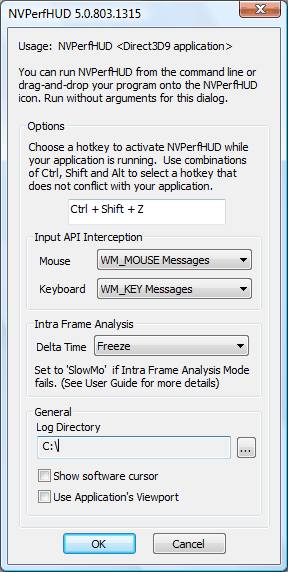
You choose a hot key to call PerfHUD, specify the HDD path to store log files, choose a method to intercept mouse and keyboard signals (DirectInput or standard system methods), and change settings for Frame Debugger and Frame Profiler modes. The latest version also allows to force the software mouse cursor - a hardware cursor is used by default, which improves mouse control at low frame rates, but it may cause some problems on rare occasions. Later on, you can open the configuration window by launching the program without specifying the application name. PerfHUD modes:
That's how the program works. When a Direct3D application is started from PerfHUD, it runs in the initial interface mode - Performance Dashboard. It overlays the image rendered by an application that runs under PerfHUD. This mode is convenient for initial tests. It provides basic info about the GPU pipe in a user application. Then you should display a scene that you want to analyze more thoroughly. If it demonstrates some rendering errors, it's easier to determine the reasons in Frame Debugger mode, where you can see how a scene is rendered call by call, and see a geometry model, textures, shaders, and ROPs for each call. Frame Profiler will help you solve performance problems. It allows advanced profiling that helps determine rendering performance problems. Frame Profiler displays a lot of useful statistics in the form of automatic analysis with full info on all draw calls and the time spent by various GPU units. Let's analyze each mode in more detail. Performance Dashboard That's the general mode that we have used since the first versions of this utility. It provides detailed monitoring and analysis of general application performance. It shows statistics on the 3D application and GPU and video card usage in real time. 
In this mode, PerfHUD shows the main performance graphs. The scrolling graph in the top right corner shows the load of unified processors of a GPU with various shader types: geometry, vertex, and pixel. In case of non-unified architectures, it shows the load of each shader type. This graph can be used to balance the load between various shader types. Another GPU load graph is located to the left of it, the vertex graph is marked red (by default), shader usage graph is green, TMU load is blue. You can add other unit loads to the graph, for example, ROPs. These graphs show sections of the pipeline that limit performance. The main graph of this PerfHUD mode (it's in the bottom of the screen, in the middle) contains four linear graphs that show the total frame render time, the time spent in the driver, GPU idle time, and the time CPU waits for GPU. The graph is situated in the bottom part of the screen. The Draw Primitives graph above shows a number of DrawPrimitive, DrawPrimitiveUP, and DrawIndexedPrimitive calls in the process of rendering a frame. An indicator of created resources is above the latter. It blinks when various Direct3D resources are created dynamically: various textures, shaders, vertex and index buffers, etc. This indicator is really helpful, as dynamic creation of resources in Direct3D applications has a negative effect on performance. Other interface elements in this mode: info bar on top of the window and several graphs underneath. These graphs show the number of DrawPrimitive calls and the average batch size, as well as usage of video memory allocated for frame buffers, render targets, and textures. You can replace the Batch Size/Draw Primitives graph with a histogram that shows the number of batches versus geometry size. The first column of the graph contains a bar that indicates the number of batches with the number of triangles below 100, the second - with 100-200 triangles, etc. There is another interface element in this mode - info bar in the upper part of the screen, which shows average FPS for the last 20 frames, the number of triangles in a frame, the current speed, as well as indicators of render modes: wireframe, 2x2 textures, etc. These modes are another interesting feature in Performance Dashboard, experiments to locate pipeline bottlenecks by disabling them. This work requires separate analysis of each pipeline stage. Since GeForce 6, new GPUs have corresponding hardware counters that show the load of each unit. But you can disable parts of a pipeline to produce a similar effect. For example, you may force a program to use a special 2x2 pixel texture instead of all textures in order to reduce the texturing effect on the overall performance. This option can be used to determine whether texturing is the main limiting factor. The same concerns the other parts of the pipeline. You can reduce the effect of ROP and pixel shader units, as well as disable all pipeline stages (ignore DrawPrimitive and DrawIndexedPrimitive calls) in order to determine whether 3D pipe performance is limited by the code of a user application. Some of the functions can be started with hot keys. For example, you can disable selected pixel shaders of various versions. You can enable render visualization of each version separately, up to 4.0. Rendering results are replaced with a certain color for each shader version. Similarly, you can enable wireframe and overdraw modes. Let's talk about new features of the latest PerfHUD version. Information panel of the utility has been significantly overhauled. Developers created a convenient fully customizable user interface, so that you can add your own set of graphs of necessary size. You can choose from a full set of dozens Direct3D and GPU counters from PerfSDK. Up to four counters can be selected for each graph: 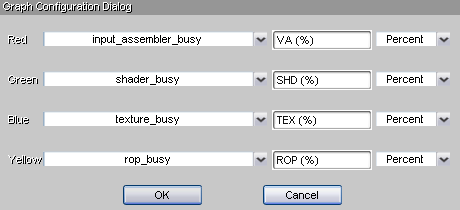
What's important, you can add custom labels (this feature does not work in our localized Windows XP), and choose location and size of the graphs. 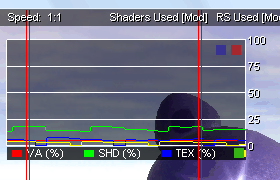
You can resize a graph by pulling the green square in the bottom right corner just like you do with windows in operating systems. The red square closes the application, the blue square calls a configuration menu of the graph (see above). You can create as many graphs as you need, and remove them from the screen. You can save and load your custom interface in the context menu: 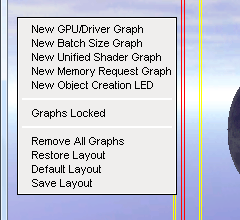
Graphs can be locked, so that you couldn't accidentally resize or move them, you can also restore the default interface. What concerns functional changes, we can mention new experiments: minimize geometry processing, highlight results of Pixel Shaders 4.0 and others. Debug Console Debug Console is the simplest PerfHUD mode. Debug Console allows developers to look through a list of diagnostic error messages and warnings of DirectX debug libraries, a list of resource creation events, as well as additional warnings of PerfHUD itself, and messages of a user application displayed by the OutputDebugString function. 
This mode allows to clear the window after each frame to see messages for the current frame only. It may be useful in case of many errors and warnings. You can also disable gathering data with the Stop Logging option. There are no major innovations in PerfHUD 5 here. They are not necessary, this mode does its job hundred-per-cent. Frame Debugger Frame Debugger is one of the most impressive PerfHUD modes, the render process pauses at the current frame and you can watch it being rendered step by step, one DrawPrimitive call at a time. It helps determine problems with a wrong order of drawing objects. This tool makes it easy to find out why rendering errors appear in the process of rendering a frame. Using the scroll bar below, you can go through a frame step-by-step, which is especially useful for complex scenes with lots of draw calls and several render targets. 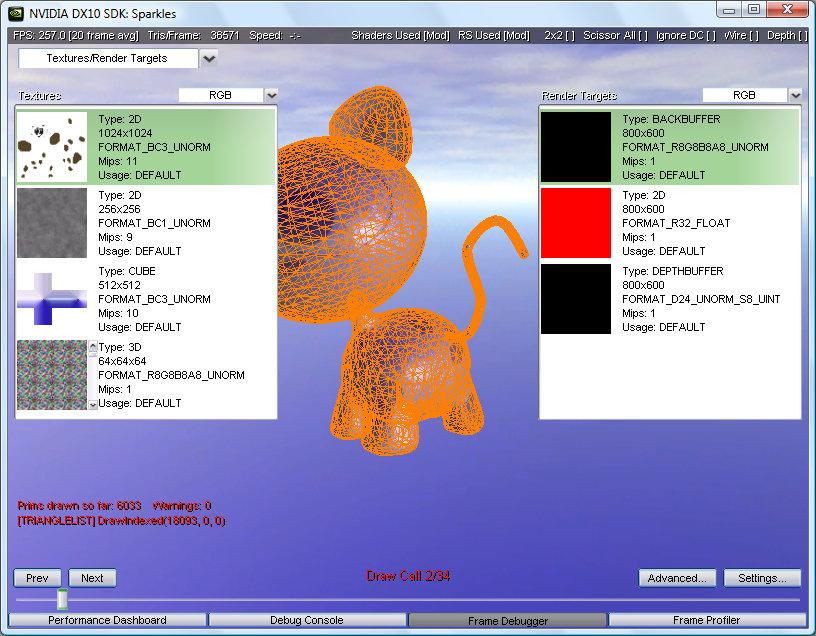
Having detected a frame with render artifacts in Performance Dashboard mode, you should switch to Frame Debugger and check whether a scene is drawn in the right order and correctly. As this mode freezes a user application, it has some limitations. For example, Frame Debugger will work correctly, only if an application uses standard system calls QueryPerformanceCounter or timeGetTime. There are also some other limitations, described in detail in PerfKit Documentation. When you switch to this mode for the first time, you are shown results of the first draw call. Using the scroll bar below or left and right arrow keys on the keyboard, you can browse results of each next draw call. Geometry data used in the current draw function are highlighted with an orange wireframe. Textures are shown in the left field, buffers - in the right. Information displayed for textures and render to texture targets includes an image of the texture and its parameters (texture type: 1D, 2D, 3D, cubic, resolution, filtering method, texture format, a number of mip levels). If a draw call renders to texture targets, its contents are displayed in the center of the screen. With warnings enabled, their list is displayed in the upper part of the screen. When you click any of them, a corresponding DrawPrimitive is called. The Advanced button will take you to the advanced mode, which offers detailed analysis of each draw call using state inspectors. The scroll bar below is still available in the advanced mode. The other part of the screen is divided into five parts - by the number of stages in a graphics pipe: Vertex Assembly, Vertex Shader, Geometry Shader, Pixel Shader, Raster Operations. Corresponding inspectors allow to browse geometry models, shaders of all types, as well as raster operations for a chosen draw call. 
When you choose Vertex Assembly, PerfHUD displays information about the status of a vertex assembly unit in the current draw call. A center of the screen displays a wireframe of the geometry used in this call. There is also a side field with parameters of the draw call, formats of index and vertex buffers, their sizes, etc. In this mode, you can make sure that all geometry data are sent correctly. In Vertex Shader State Inspector, Geometry Shader State Inspector and Pixel Shader State Inspector modes, the window displays information on the shader code used in a given draw call. It shows the vertex/geometry/pixel program and its constants and textures. The Raster Operations window displays information about ROP operations in the current draw call. It displays a frame buffer format, render state, etc. This inspector will come in handy to check whether alpha-blending works correctly. For example, you can see whether the buffer contains necessary data, if blending does not work correctly. New options of the Frame Debugger in PerfHUD 5 include rotating a wireframe model and displaying only one draw call instead of all previous ones. A lot of texture types can be visualized: 1D, 2D, 3D, shadow maps, cubic maps, and texture arrays. Another new feature is pop-up tips with texture coordinates and texel color as you move the mouse cursor over textures and render targets: 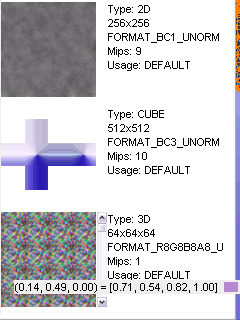
But the most interesting feature is the Shader Edit-and-Continue mode, which allows to edit shaders and execute them. You can change programs in HLSL and .fx formats for DirectX 9 and DirectX 10 programs, it concerns all shader types: vertex, geometry, and pixel ones. You can edit shader code in a usual way - in special text fields, where you can search for text, switch between original and modified codes, as well as restore the original program. So it's much easier to detect errors and to optimize 3D applications. You don't have to quit from an application and run it again in order to change a single line in shader code. Now you can do it in a visual way. 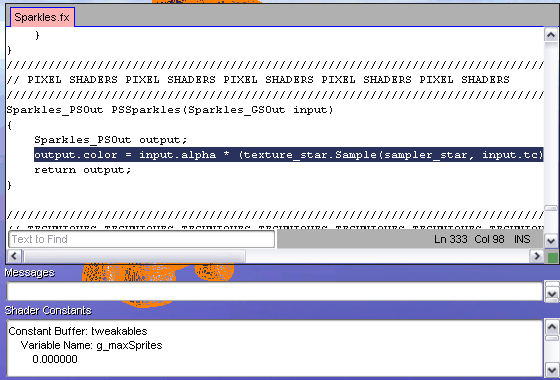
By the way, there is a similar mode, which allows to edit render states, called "Render State Edit-and-Continue". It's similar to editing shaders - you can change render states, switch between the original and modified sets. 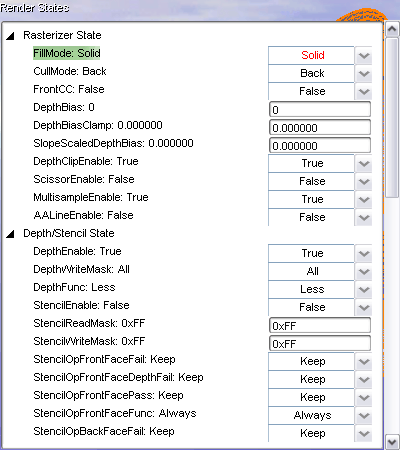
Performance analysis in Frame Profiler PerfHUD mode, called Frame Profiler, that appeared in the previous version of this utility is intended to help you optimize performance of 3D applications. Frame Profiler uses hardware GPU units and instrumented code of the driver to measure the load of separate GPU units in an application, it helps detect bottlenecks in the graphics pipeline. When PerfHUD goes to this mode, it runs several experiments to analyze performance of the current frame and gives a detailed report on draw calls. Frame Profiler mode is an efficient method to determine problems in some scenes. It displays the most exacting draw calls in a frame as well as provides detailed info on each draw call. It allows to determine those that require your special attention. The mode consists in rendering the current frame several times and measuring GPU usage for each draw call separately. Proceeding from this information, draw calls are grouped into state buckets. All calls in a single bucket have similar characteristics, so removing a bottleneck in one of draw calls will increase performance of other draw calls in this bucket. 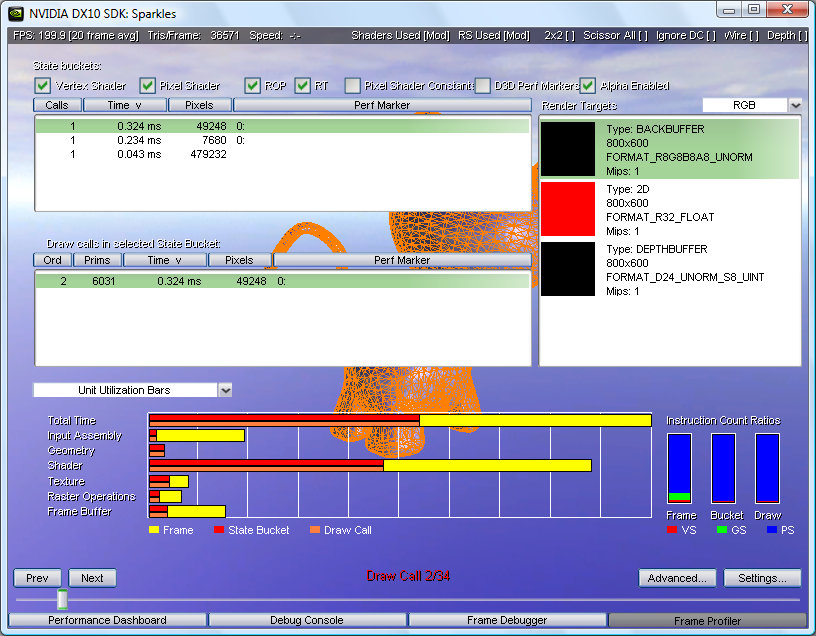
GPU usage diagram is displayed in the bottom by default. The upper bar of the graph shows an entire frame, the bars below show the load of separate GPU units (vertex assembly unit, geometry unit, unified shader units, texturing unit, ROP unit, and frame buffer unit) during the current draw call and all calls in a given state bucket. The yellow section of each bar shows the total time of a frame in milliseconds, the red one - the time GPU units are used by all state buckets calls, the orange one - the time a unit is used in the current draw call. The GPU usage graph resembles the one displayed in Performance Dashboard mode. But the graph in Frame Profiler mode is based on the analysis of a single frame and displays GPU usage for each draw call separately. You can also see the following graphs: draw call durations in milliseconds - the time each draw call lasts in a frame; the time the FastZ depth/stencil unit is used - it shows activity time of this unit in milliseconds and a counter of processed pixels in each draw call. As in the previous mode, Frame Profiler has the second interface view - Advanced, to access state inspectors. This Frame Profiler view allows to see details (PerfHUD 5 also allows to modify) of a given draw call (geometry data, pixel/geometry/vertex shaders used, ROPs) and see the time spent for each draw call in a selected frame. The mode is implemented in the same style as the Advanced mode in Frame Debugger. The color diagram resembles the bars in the GPU usage graphs, described above. 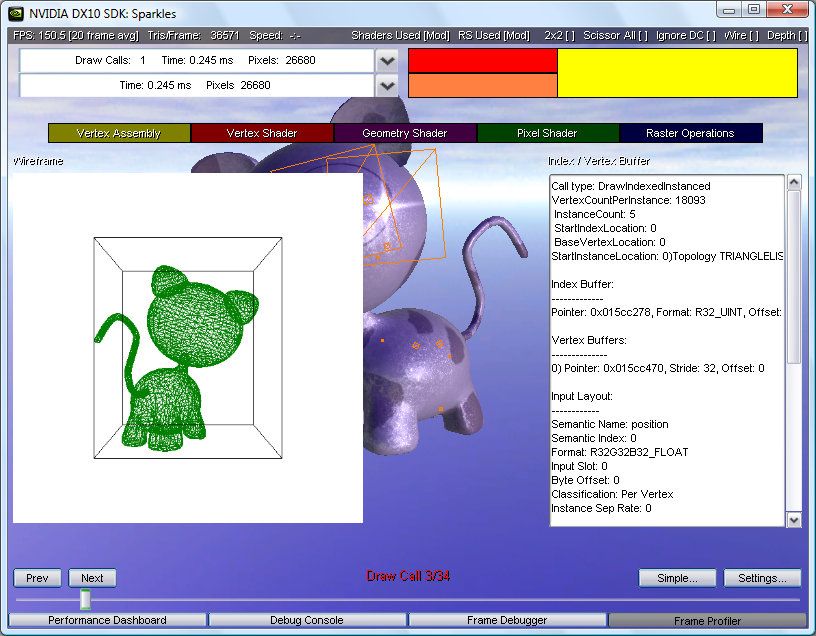
PerfHUD 5 improvements also include Frame Profiler. There appeared Instruction Count Ratio graphs that show the correlation between the number of instructions in vertex, geometry, and pixel shaders for the entire frame, state block, and a separate draw call (see the screenshot). There were added pop-up tips for graphs with numeric values, the new Alpha Enabled criterion for state blocks, as well as support for the hierarchic structure of Direct3D performance marks. Minor DefectsAdvantages of PerfKit 5 for 3D developers are apparent. These tools make programmers' lives easier. They get a convenient tool to analyze performance and debug their programs. Now it's time to speak about a fly in the ointment. Like in any new product, there are some defects in PerfKit 5, which are rapidly fixed in updates (so make sure you use the latest version by visiting this NVIDIA web site). For example, some users face installation problems, instrumented drivers do not always work correctly on all operating systems, there may be a runtime error, when you exit from a Direct3D application running under PerfHUD. For some strange reason, we couldn't use PDH in Windows Vista, while it worked fine in XP. There is another minor problem - a performance drop due to the instrumented driver in Windows Vista may be higher than that in Windows XP. But NVIDIA are working on it. They promise to fix this problem in future. Besides, there is still no updated documentation for PerfKit. Only part of the User Guide was updated at the time this article was written. In addition, it's not quite clear how to enable/disable special features of the instrumented drivers. This may come in handy, because special features reduce performance by several percents. NVIDIA Panel does not open in Windows XP tray, it crashes with an initialization error, and NVIDIA Developer Control Panel does not seem to have any options to disable driver instrumentation. That's another bug, although it does not ruin the main task of PerfKit. It copes with it brilliantly. ConclusionsPerfKit offers very convenient tools to detect performance bottlenecks in 3D applications, optimize them, and eliminate render errors. You can use PerfKit to evaluate the effect of each unit in the graphics pipeline on the overall performance, and then eliminate bottlenecks. Features of the updated PerfKit 5 make it much easier to determine problems in code. Software and hardware performance counters offer useful information about NVIDIA GPU operations. They can be used to evaluate the load on main GPU units in various scenes. There are several ways to use counters: you can use NVPerfAPI from your application or analyze their data in PerfMon and PIX. If you need a visual and convenient tool to analyze a Direct3D application, you may use PerfHUD, which will provide full information about a given application and GPU performance in a convenient form in real time as the application runs. The latest version of PerfKit has several new features, which 3D developers have been waiting for a long time: support for the NVIDIA G8x architecture, full support for Windows Vista and Direct3D 10 applications, more experiments, hardware and software counters, convenient customizable interface of PerfHUD 5, editable vertex/geometry/pixel shaders and raster operations in real time, and many others. Better compatibility and stability were not forgotten either. Some minor bugs from previous versions were fixed. There have appeared new bugs, of course, but they are being fixed in frequent updates. In our opinion, the most interesting new feature of PerfHUD is editing shaders and render states in real time. The utility allows to modify shader code on-the-fly and immediately see the results, which makes it much easier to test new ideas and optimize old ones. So, PerfKit 5 will be extremely useful for all developers of modern 3D applications that use Direct3D or OpenGL. It will help solve most complex development problems: locating performance bottlenecks and render errors, full use of GPU resources, reaching balance between the load on various GPU units, etc. Alexei Berillo (sbe@ixbt.com)
October 19, 2007 Write a comment below. No registration needed!
|
Platform · Video · Multimedia · Mobile · Other || About us & Privacy policy · Twitter · Facebook Copyright © Byrds Research & Publishing, Ltd., 1997–2011. All rights reserved. |


