 |
||
|
||
| ||
|
||
|
||
| ||
IntroductionModern 3D applications are very complex. Developers should use proper utilities to use all features of new video chips - they allow to detect bottlenecks in performance. Video chips perform a lot of various video pipe operations during rendering. General performance of an application depends on the slowest sector, so you need convenient tools that can detect such bottlenecks to obtain high performance. Especially as hardware graphics pipes have become significantly more complex for the last years. It's nearly impossible to puzzle out these processes without convenient tools. Developers used to have only the simplest debugging tools in the recent past. Then there appeared such tools as NVPerfHUD. This utility is successfully used by game developers, it offers the most detailed and fullest info about a video chip in a given 3D application. The first versions of NVPerfHUD were simply built into NVIDIA drivers and worked in any application, offering only part of modern features to analyze GPU operation. In future, NVPerfHUD grew into a stand-alone tool for 3D developers that offered an extended list of necessary features. And now the latest version of this utility is included into a new set of utilities for developers - NVPerfKit 2. NVPerfKit 2 is part of NVIDIA Developer Toolkit, a very interesting set of programs, which help analyze 3D performance in Direct3D and OpenGL applications, determine sectors that have the strongest influence on performance. NVPerfKit tools are already used by a lot of developers all over the world. They have been using NVPerfHUD for a long time to search for rendering errors as well as to detect bottlenecks in their code and the resulting 3D performance. NVPerfKit 2 is available at NVIDIA web site for developers, we offer you a review of its features. NVPerfKit 2 OverviewNVPerfKit 2 is a kit of programs for developers of 3D applications that contains powerful tools to analyze performance of Direct3D and OpenGL applications using low-level driver performance counters and hardware counters of a video chip that are offered to third-party developers for the first time. Performance counters may be used to determine the reasons for low performance of 3D applications and to find out how well a given application uses video chip capacities. NVPerfKit 2 components:
System requirements of NVPerfKit 2
It's necessary to install a special driver with additional tools for debugging and monitoring performance in order to use NVPerfKit utilities. Such drivers are called instrumented drivers. They contain additional code to monitor and measure performance, and are included into the kit. Debugging tools, such as NVPerfHUD, communicate with drivers to get necessary information about GPU and NVIDIA driver's operations. The documentation runs that instrumented drivers are not recommended for comparative performance tests, as they affect rendering speed. But their negative effect does not exceed 5-7%, not that bad. Instrumented drivers gather debug info by default, but it can be disabled in NVIDIA Control Panel, Driver Instrumentation page. 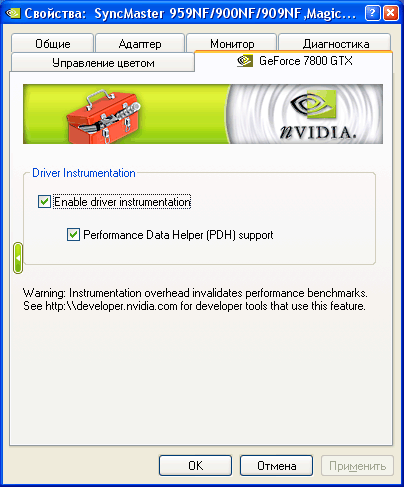 Let's analyze the key peculiarities of NVPerfKit 2 one by one. Let's start with a brief description of performance counters, as they are a basis of the entire kit, including NVPerfHUD. NVPerfKit performance countersThere are several types of NVPerfKit counters: hardware counters that read data right from a video chip, software counters for Direct3D and OpenGL that contain data of the debugging driver. There are also simplified experiments - multipass operations that provide detailed information about video chip's status. All of the GPU counters give results accumulated from the previous time the GPU was sampled. For instance, the triangle_count gives the number of triangles rendered since the last sample was taken. When PDH is used to read the data from counters, for example, from the built-in Performance Monitor (PerfMon) from Windows, they will be queried one time per second. But when you integrate counters into your applications, you can make queries as much as you want, even each frame. Unlike hardware ones, driver counters return values accumulated for one frame. When using the PDH interface, counters can be reported in one of two methods: raw and percentage. Raw counters count events (triangles, pixels, milliseconds, etc.) since the last call. Percentage counters are event counts based on the clock rate; event counts divided by the number of cycles since the last sample. If you call the counter data from a program using NVPerfAPI functions, they return raw values and the total number of completed GPU cycles. Triangle and vertex counters return a number of processed elements. Examples of software performance counters, for Direct3D and OpenGL applications: frame rate per second, number of triangles per frame (with/without instancing), video memory usage, several special counters for SLI that show quantity and volume of data transfers from chip to chip, a number of rendering buffers transmitted, etc. Hardware GPU performance counters: GPU Idle, Pixel/Vertex Shader Utilization, ROP Utilization, Shader Stalls, ROP Stalls, Vertex Count, Primitive Count, Triangle Count, and Pixel Count. Let's review GPU counters in more detail, as they first appeared only in NVPerfKit 2 and are the most interesting ones.
Using performance counters from applicationsThere are two possible ways to access software and hardware NVIDIA counters from user applications - you can use NVPerfAPI and Performance Data Helper (PDH) interfaces. PDH is a general interface to access performance counters, offered by Microsoft in its operating systems. It's used by PerfMon and some other utilities. Using NVPerfAPINVPerfAPI is a special program interface that offers developers of 3D applications access to performance counters and SimExp, which provide more details about GPU performance nuances. NVPerfKit includes the corresponding NVPerfAPI libraries and sample code. You just have to add several lines of code into a user application. Unlike software counters, which can be called unlimited number of times, there is a certain limit as to how many hardware counters can be read simultaneously. You can get data only from a certain number of them. This number depends on a given video chip. Simplified Experiments (SimExp)One of the new features of NVPerfKit 2 is the ability to run directed experiments on individual units of the GPU and gather performance characteristics, called simplified experiments. For 8 locations in the GPU pipeline SimExp provides a "Speed of Light" (SOL) and a "Bottleneck" value. The first digit shows the time when a certain GPU unit was used. The "value" returned is a count for how many cycles during the experiment the unit was active, and the "cycle" returned gives the amount of time the experiment took to run. Similarly, when running a Bottleneck experiment, the value roughly represents the amount of time this unit was a bottleneck and the cycles is the experiment duration. Using NVPerfSDK features via Performance Data HelperWhen using PDH, you first need to tell the driver and PDH subsystem what counters you are interested in collecting. This is done through the NVIDIA Developers Control Panel (NVDevCPL), which is started from Windows Control Panel. Once it is open, you can select which signals to report while the application is running. 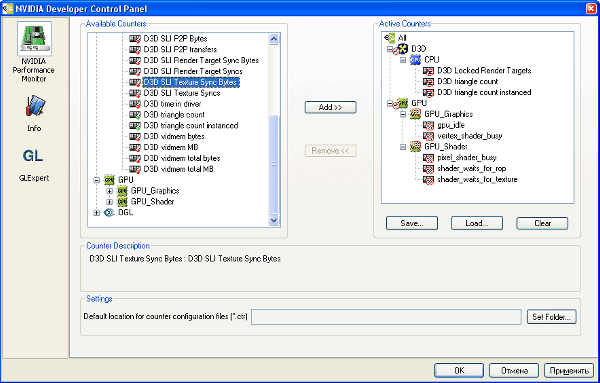 Make sure you have added necessary counters to the list of Active Counters. We have already mentioned that the GPU can sample a pre-set number of counters per clock, and this number can vary from GPU to GPU. A number of software counters running simultaneously is not limited. But each signal reduces performance, so the best solution is to enable only those that you really need at the moment. If you run your application in a window, you can interactively enable/disable GPU counters. This allows you to set your application up to sample all of the counters of interest. Examples of reading performance counters from a user application through PDH are included into NVPerfKit. Using the standard Windows utility - Performance MonitorOne of the simplest ways to see the counters is through the Windows system utility called PerfMon. This helpful utility graphs PDH information over time. Once you have used the NVDevCPL to enable the counters you want to sample, you can add them to the PerfMon graph. You need to select the NVIDIA GPU performance object to add hardware counters and NVIDIA Direct3D Driver or NVIDIA OpenGL Driver to add software counters. That's how a graph looks like. 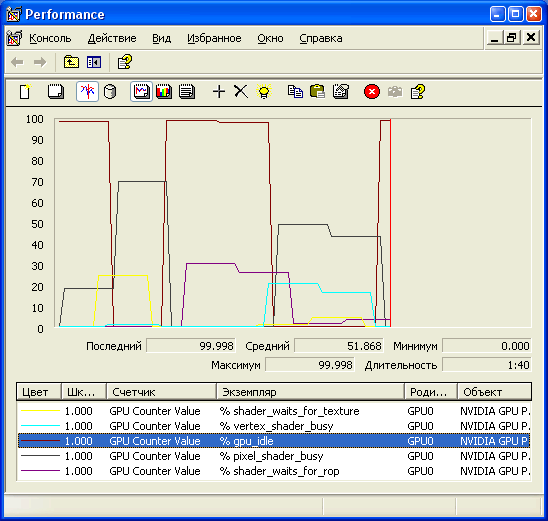 NVPerfKit includes a plug-in that allows you to use all the NVPerfKit performance counters in Microsoft PIX for Windows. This PIX plug-in displays driver and GPU counter data alongside the associated Direct3D calls for additional correlation and performance tuning. The NVPerfKit installer places the PIX plug-in in the appropriate directory of DirectX SDK, where this utility is located. To use these features, don't forget about a mandatory instrumented driver and necessary settings in the NVDevCPL. 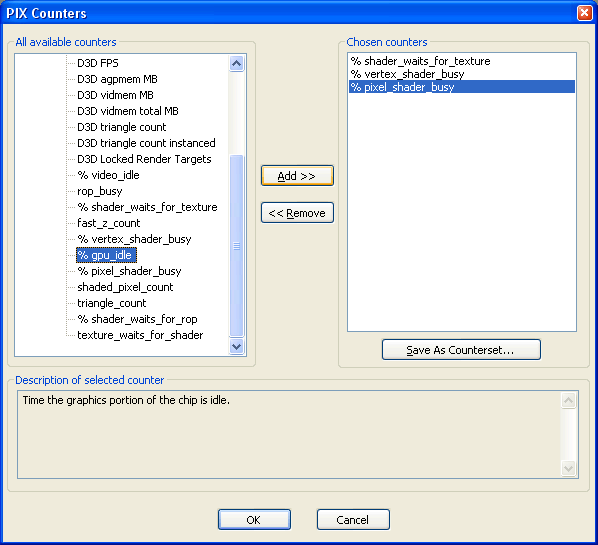 To set up sampling, first remember to enable the counters that you are interested in the NVDevCPL. Once this is done, you are ready to enable the counters in PIX. From the Experiment window in PIX, make sure you choose "More Options", then the action type "Set Per-Frame Counters", and click the Customize button. Then select necessary counters from the Plug-in Counters - NVIDIA Performance Counters list in the dialog "PIX Counters". These will now show up in the data stream that PIX produces. Moreover, if PIX graphing and analytical features are insufficient, you can export the data into CSV format and analyze them in other programs, for example Microsoft Excel. 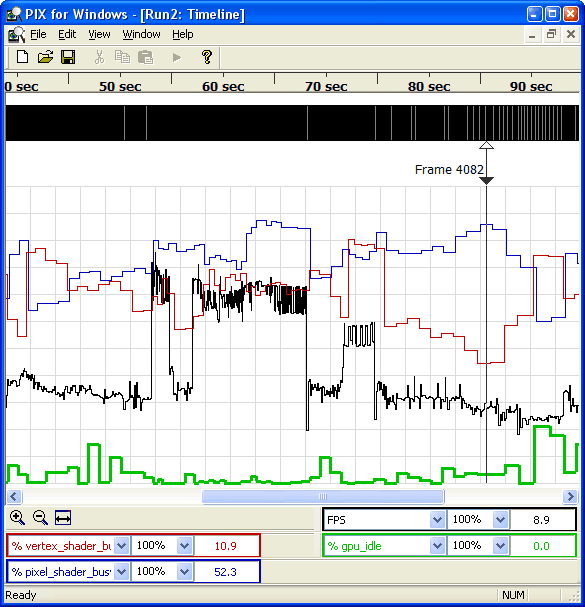 To test hardware counters, we analyzed performance of one of game tests in Futuremark 3DMark 05 using PIX. We sampled several most interesting hardware counters: shader_waits_for_texture, vertex_shader_busy, pixel_shader_busy, shader_waits_for_rop. Then we exported and analyzed the data in Excel. Our tests showed that enabling anisotropic filtering in this application had little effect on the last three counters. That is it has little effect on usage of pixel shaders, vertex shaders, and ROP units. But the average value of the first counter, shader_waits_for_texture (the amount of time that the pixel shader unit is stalled waiting for a texture fetch), grew from 3.0% to 10.2%. The average frame rate dropped by 8%. For comparison - when we forced bilinear filtering, shader_waits_for_texture was 1%. In the same test performed by F.E.A.R. benchmark, the average value of shader_waits_for_texture grew from 7.8% to 15.6% for trilinear and anisotropic filtering correspondingly. That's just one little example of the multitude of tests, which can be performed using the new tools that appeared in this version of NVPerfKit. Improved NVPerfHUD 4.0NVPerfHUD is a convenient utility for profiling and debugging Direct3D 9 applications. It helps solve complex problems with rendering performance and quality by detailed performance monitoring, graphics pipeline inspectors, and displaying debug info. All info is displayed on the heads-up display (HUD), NVPerfHUD interface overlays the application. It contains graphs, text fields, and control elements. NVPerfHUD 4 is the fourth generation of the NVIDIA utility to analyze performance, one of the key components of NVPerfKit 2. The latest version is based on the long-term work on NVPerfHUD. It provides developers with nearly the same tools for detailed analysis and profiling as used by engineers from this company to locate problems with rendering performance and quality. The program collects data from application, driver, API, and GPU. Being started, it works together with an application and displays the data it collects on the foreground of the application. NVPerfHUD uses special code in the driver that collects data from GPU counters as well as intercepts API calls to gather statistics and integrate into the application. That's why there is some performance drop compared to the usual mode, without the special driver and enabled HUD. However, it does not interfere with the operation. This picture shows NVPerfHUD interacting with other software components: 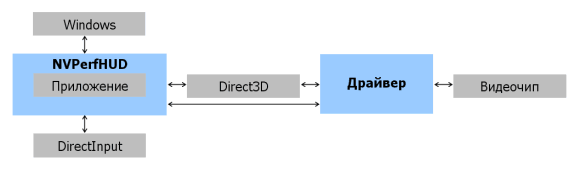 As NVPerfHUD is a powerful tool to analyze 3D applications, NVIDIA implemented protection to restrict the access of third-party users to analysis of applications without developers' consent. In order to use NVPerfHUD, an application should support it - it must have several lines of code in the DirectX initialize subroutine. When an application is started from NVPerfHUD, the driver creates a special NVIDIA NVPerfHUD video adapter and the application must use it. Besides, NVPerfHUD works only with the reference rasterizer. An application will still use hardware features of the GPU, though it selects the NVIDIA NVPerfHUD video adapter. This solution has been used since NVPerfHUD 2.x, so developers can use the new version in their programs without any modifications. Applications that do not support NVPerfHUD in the described way, cannot be analyzed with this utility. In such cases, we cannot use all features of the utility, but the average FPS and a number of triangles in a scene, though we can see the interface. In order to run a Direct3D application together with NVPerfHUD, you should specify the path to an executable file in he command line of the utility or drag the application or its shortcut to NVPerfHUD icon. The interface of a program uses hot keys for fast access to functions, there are also mouse control elements. Activity of the interface switches between a user application and NVPerfHUD with the main hot key, specified in the settings. When the program is started for the first time, it displays a configuration window, where you should specify key settings. 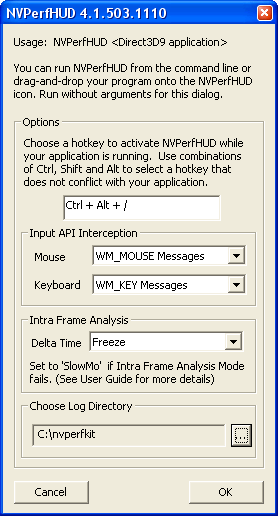 You choose a hot key to call NVPerfHUD, specify the HDD path to store log files, choose a method to intercept mouse and keyboard signals (DirectInput or standard system methods), and change settings for Frame Debugger and Frame Profiler modes. Later on, you can open the configuration window by launching the program without specifying the application name. Display interface modes of NVPerfHUD:
When a Direct3D application is started from NVPerfHUD, it runs in the initial interface mode - Performance Dashboard. It overlays the image rendered by an application that runs under NVPerfHUD. This mode is convenient for initial tests. It provides basic info about the GPU pipe in a user application. Then you should display a scene that you want to analyze more thoroughly. If it demonstrates some rendering errors, it's easier to determine the reasons in Frame Debugger mode, where you can see how a scene is rendered call by call and see a geometry model, textures, shaders, and ROPs for each call. Frame Profiler will help you solve performance problems. It allows advanced profiling that helps determine performance problems. Frame Profiler displays a lot of useful statistics in the form of automatic analysis with full info on all draw calls and the time spent by various GPU units. Let's review the modes of this utility in more detail. Performance DashboardThat's the general mode that we have used since the first versions of this utility. It provides detailed monitoring and analysis of general application performance. It shows statistics on the 3D application and GPU and video card usage in real time. 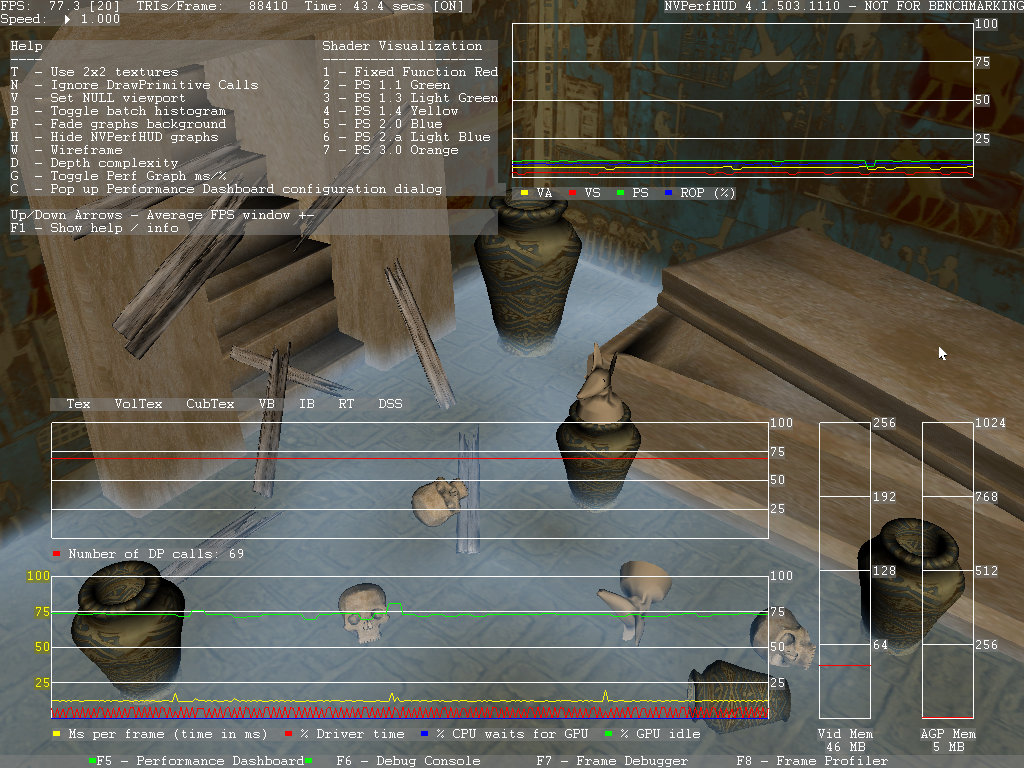 In this mode, NVPerfHUD shows the main performance graphs. The scrolling graph in the top right corner shows the usage of various GPU units. By default, the graph shows the time in milliseconds that each GPU unit spends on rendering a current frame. But you can switch to graphing in percents. This graph can be used to balance the load on various GPU units. The yellow color on the graph shows a vertex setup unit, red - vertex shader unit, green - pixel shader unit, blue - ROP. It's important to note that GPUs, manufactured before GeForce 6, have no internal performance counters that are required to graph GPU usage. Other interface elements in this mode: info bar in the upper part of the screen, resource monitor in the center, and several graphs at the sides. The info bar shows the current frame rate (instant FPS), a number of triangles in a scene, elapsed time, and NVPerfHUD version. Resource monitor is a list of created resources, such as textures and vertex buffers. The other graphs show a number of DrawPrimitive calls, video memory usage - local and remote (AGP/PCI/PCI-Express). Memory usage graphs are the simplest. They show the current amount of local and system memory used by resources. The main graph of this NVPerfHUD mode (in the middle of the bottom) contains four linear graphs that show the total frame render time, the time spent in the driver, GPU idle time, and the time CPU waits for GPU. The graph is situated in the bottom part of the screen. The Draw Primitives graph above shows a number of DrawPrimitive , DrawPrimitiveUP, and DrawIndexedPrimitive calls in the process of rendering a frame. An indicator of created resources is above the latter. It blinks when various Direct3D resources are created dynamically: 2D textures, volumetric textures, cubic maps, vertex and index buffers, etc. This indicator is useful because dynamic creation of resources in Direct3D applications has a negative effect on performance and you should give it up whenever possible. You can also enable Batch Size histogram by pressing the B key after NVPerfHUD is activated. In this case the above mentioned Draw Primitives graph is replaced with a histogram that shows a number of batches depending on geometry volume. The first column of the graph contains a bar that indicates a number of batches with a number of triangles below 100, the second - with 100-200 triangles, etc. Other additional features are also called with hot keys. For example, you can disable selected pixel shaders of various versions. You can disable rendering of each version separately, up to 3.0. Rendering results are replaced with a certain color for each shader version. Similarly, you can enable wireframe and overdraw modes. There is also another interesting feature in Performance Dashboard mode - experiments to determine bottlenecks in a graphics pipe by disabling them, it's useful for old GPUs. This work requires separate analysis of each pipeline stage. Since GeForce 6, new GPUs have corresponding hardware counters that show the load of each unit. In case of old chips, you have to disable some parts of the graphics pipe, which may have similar effect, though it's much less convenient to use. For example, you may force a program to use special 2x2 pixel texture instead of all textures in order to reduce the texturing effect on the overall performance. This option can be used to determine whether texturing is the main limiting factor. The same concerns the other parts of the pipeline. You can reduce the effect of ROP and pixel shader units with the help of a rectangle that cuts off all rasterizing and shading, as well as an opportunity to disable all pipeline stages (ignoring DrawPrimitive and DrawIndexedPrimitive calls) in order to determine whether 3D pipe performance is limited by the code of a user application. Debug ConsoleIt's the simplest NVPerfHUD mode - debug console. Debug Console allows developers to look through a list of diagnostic error messages and warnings of DirectX debug libraries, a list of resource creation events, as well as additional warnings of NVPerfHUD itself, and messages of a user application displayed by the OutputDebugString function. 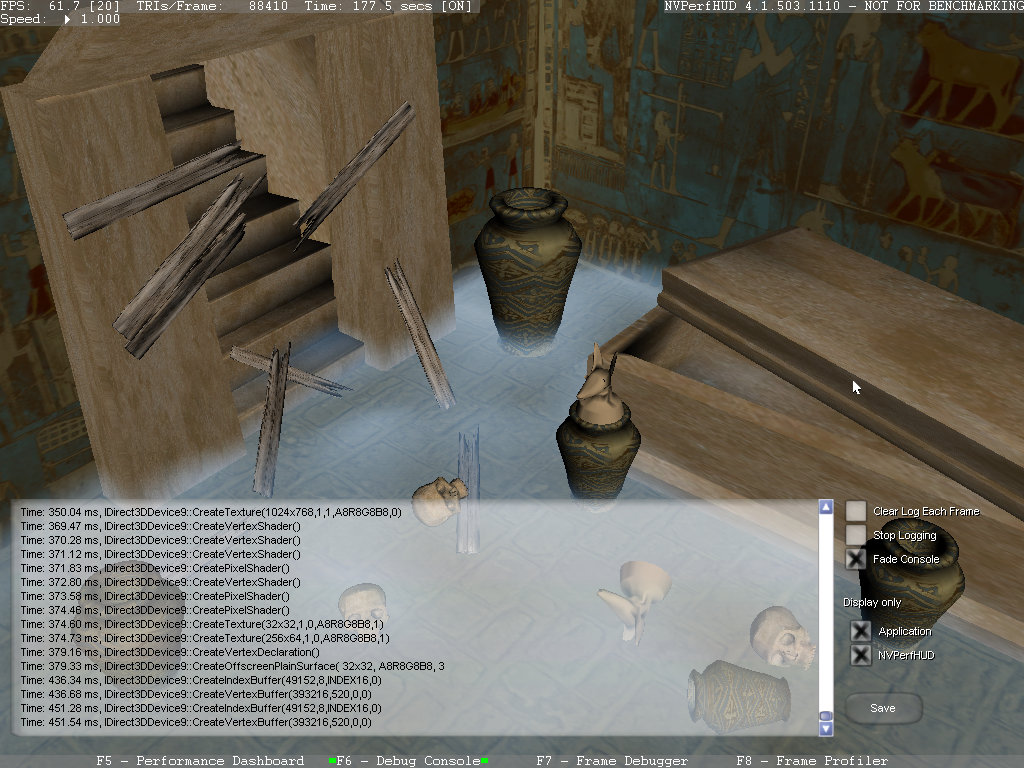 This mode allows to clean the screen after each frame to see messages for the current frame only. It may be useful in case of many errors and warnings. You can also disable gathering data with the Stop Logging option. Frame DebuggerFrame Debugger is one of the most entertaining NVPerfHUD modes, the render process pauses at the current frame and you can watch it being rendered step by step, one DrawPrimitive call at a time. This NVPerfHUD mode helps determine problems with a wrong order of drawing objects. This tool makes it easy to find out why rendering errors appear in the process of rendering a frame. Using the bottom scroll bar, you can go through a frame step-by-step, which is especially useful for complex scenes with lots of draw calls and several render targets. 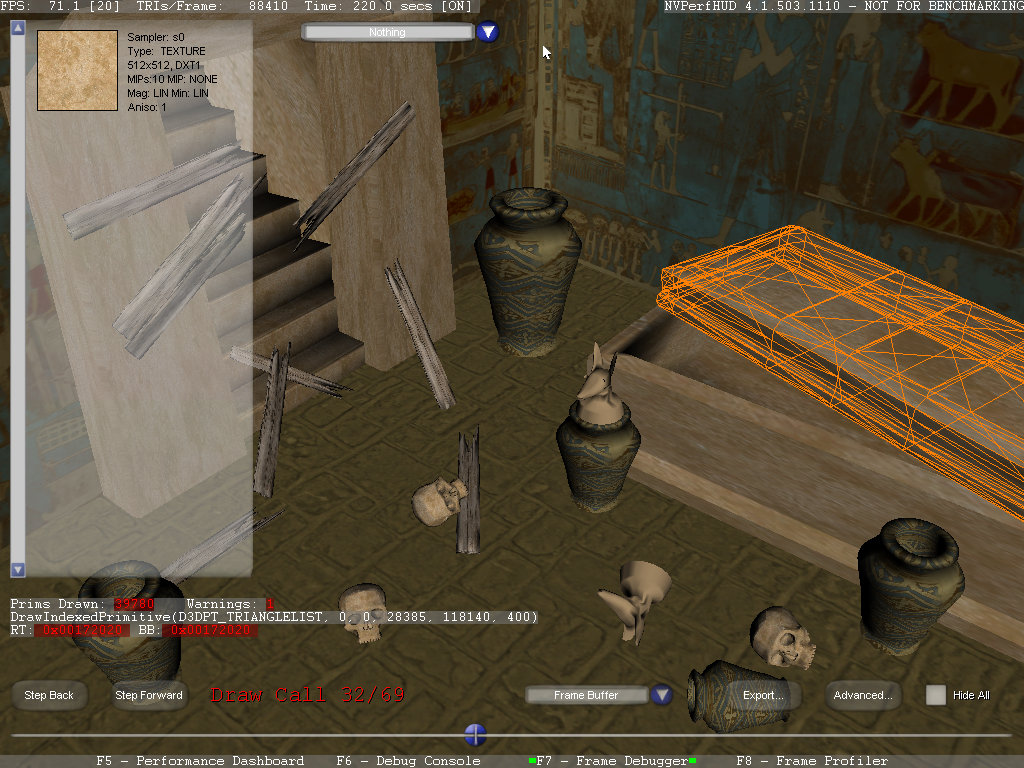 Having detected a frame with render artifacts in Performance Dashboard mode, you should switch to Frame Debugger and check whether a scene is drawn in the right order and correctly. As this mode "freezes" an application, there exist certain limits. For example, Frame Debugger will work correctly, only if an application uses standard system calls QueryPerformanceCounter or timeGetTime. There are also some other limitations, described in detail in NVPerfKit Documentation. When you switch to this mode for the first time, you are shown results of the first draw call. Using the bottom scroll bar or left and right arrow keys on the keyboard, you can browse results of the following draw calls. Geometry data used in the current draw function are highlighted with an orange wireframe. And textures are shown in the right field. Information displayed for textures and render to texture targets includes an image of the texture and its parameters (texture type: 1D, 2D, volumetric, cubic, resolution, filtering method, texture format, a number of mip levels). If a draw call renders to texture targets, its contents is displayed in the center of the screen. With warnings enabled, their list is displayed in the upper part of the screen. When you click any of them, a corresponding DrawPrimitive is called. The Advanced button will take you to the advanced mode, which offers detailed analysis of each draw call using state inspectors. The bottom scroll bar is still available in the advanced mode. The other part of the screen is divided into four parts - by the number of stages in a graphics pipe: Vertex Assembly, Vertex Shader, Pixel Shader, Raster Operations. Corresponding inspectors allow to view geometric models, vertex and pixel shaders, raster operations for a selected draw call. 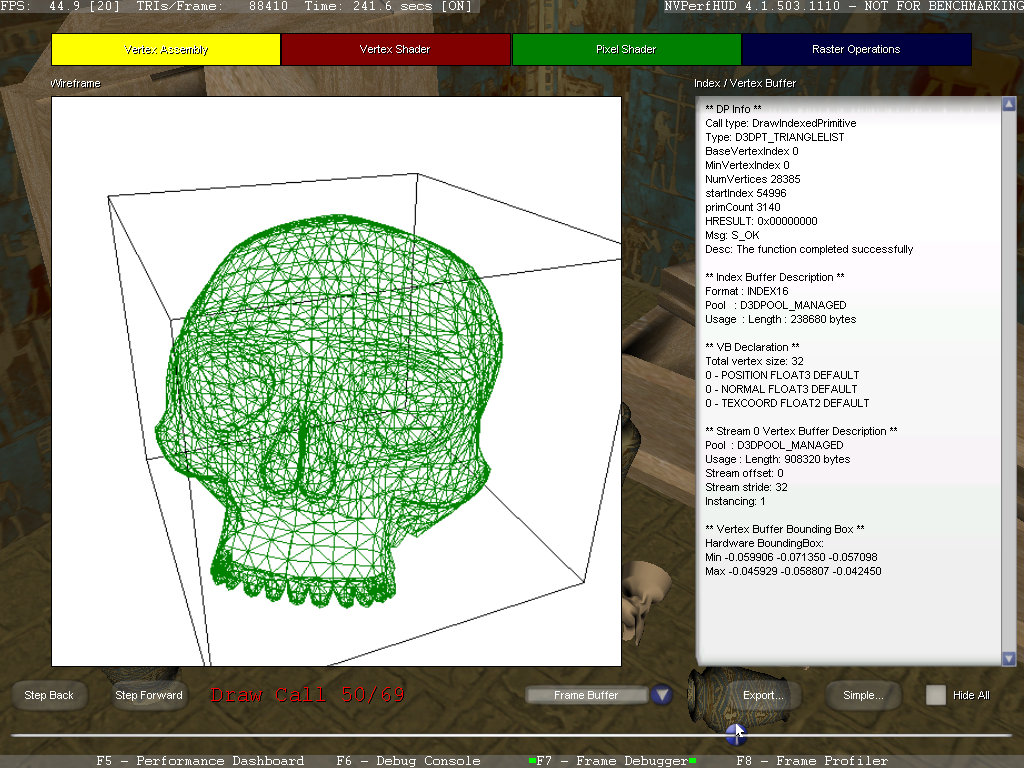 For example, when you choose Vertex Assembly, NVPerfHUD displays information about status of a vertex assembly unit in the current draw call. A center of the screen displays a wireframe of the geometry used in this call. There is also a side field with parameters of the draw call, formats of index and vertex buffers, their sizes, etc. In this mode, you can make sure that all geometry data are sent correctly. Vertex Shader State Inspector and Pixel Shader State Inspector modes display information about the code of the vertex/pixel shader used in this draw call. It shows the vertex/pixel program and its constants and textures. Raster Operations window displays information about ROP operations in the current draw call. It displays a frame buffer format, render state, etc. This inspector will come in handy to check whether alpha-blending works correctly. For example, you can see whether the buffer contains necessary data, if blending does not work correctly. Performance analysis in Frame ProfilerFrame Profiler mode that appeared in NVPerfHUD 4 should help you increase 3D performance. Frame Profiler uses special hardware GPU units and instrumented code of the driver to measure the load of separate GPU units in an application, it helps detect bottlenecks in the graphics pipeline. When you enable this mode, NVPerfHUD runs several tests to analyze performance in a current frame and then displays a detailed report on draw calls. It should be noted that Frame Profiler works only with modern series of NVIDIA video cards because of special hardware support that appeared in GeForce 6 GPUs. Frame Profiler mode is an efficient method to determine problems in some scenes. It displays the most exacting draw calls in a frame as well as provides detailed info on each draw call. It allows to determine those that require your special attention. The mode consists in rendering the current frame several times and measuring GPU resource usage for each draw call separately. Proceeding from this information, draw calls are grouped into state buckets. All calls in a single bucket have similar characteristics, so removing a bottleneck in one of draw calls will increase performance of the other draw calls in this bucket. 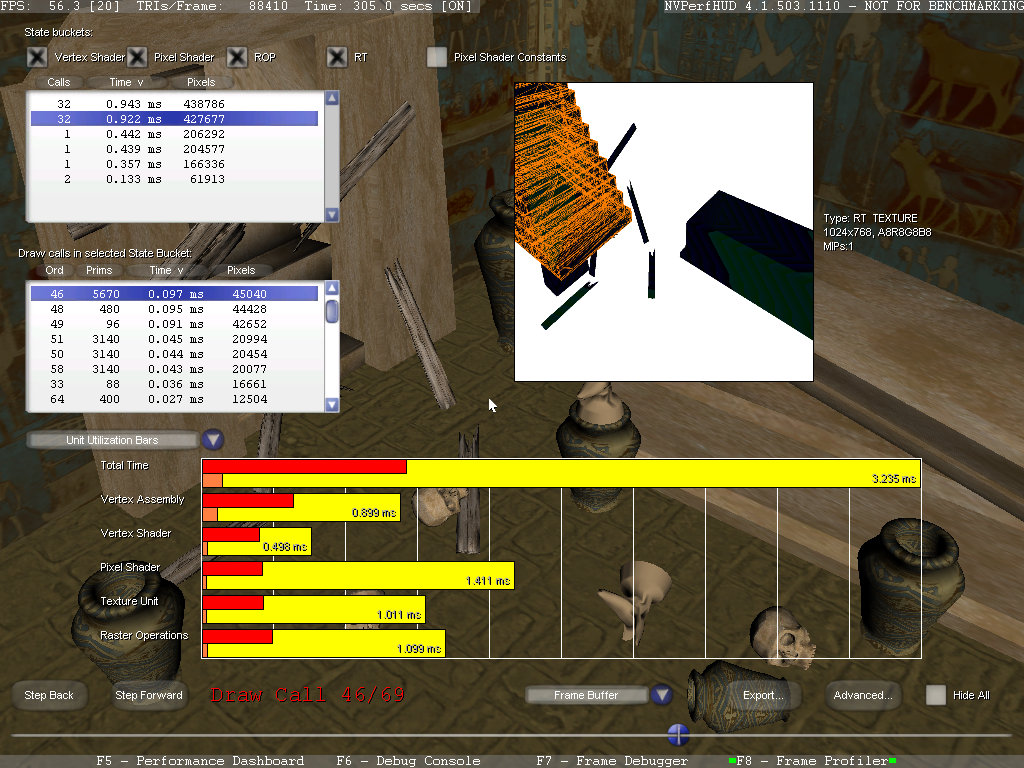 GPU usage diagram is displayed in the bottom by default. The upper bar of the graph shows an entire frame, the bars below show the load of separate GPU units (vertex assembly unit, vertex shader unit, pixel shader unit, texturing unit, and ROP unit) during the current draw call and all calls in a given state bucket. The yellow section of each bar shows the total time of a frame in milliseconds, the red one - the time GPU units are used by all calls of state buckets, the orange one - the time a unit is used in the current draw call. The GPU usage graph resembles the one displayed in Performance Dashboard mode. But the graph in Frame Profiler mode is based on the analysis of a single frame and displays GPU usage for each draw call separately. You can also see the following graphs: draw call durations in milliseconds - the time each draw call lasts in a frame; the time the FastZ unit is used - it shows activity time of this unit in milliseconds and a counter of processed pixels in each draw call. As in the previous mode, Frame Profiler has the second interface view - Advanced, to access state inspectors. This Frame Profiler view allows to see details of a given draw call (geometry data, pixel and vertex shaders used, ROPs) and see the time spent for each draw call in a selected frame. The mode is implemented in the same style as the Advanced mode in Frame Debugger. The color diagram resembles the bars in the GPU usage graphs, described above. 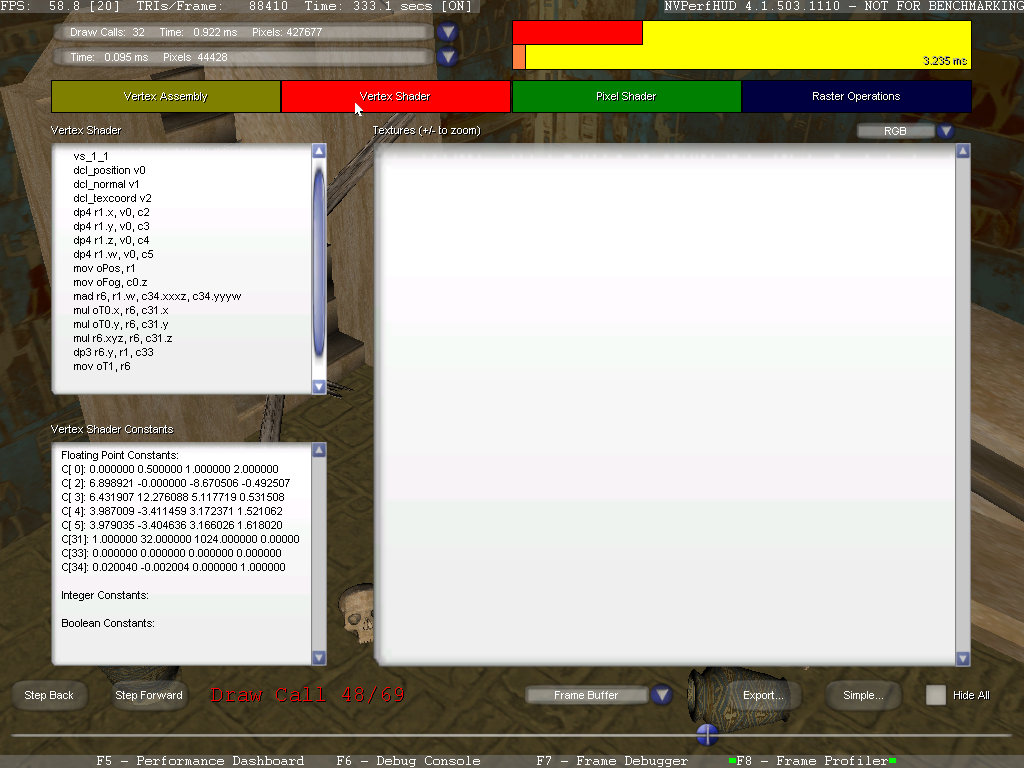 ConclusionsIt's impossible to optimize 3D applications without convenient tools to detect bottlenecks. Optimization consists in performing the following steps in a cycle: determining a reason for low performance, optimizing the code, and returning to Step One, if performance is still insufficient. NVPerfAPI or NVPerfHUD can help you determine the effect of each unit in a graphics pipe on the overall performance. Having spotted a bottleneck, you should reduce the load on this unit and get the desirable performance level. You have to repeat these steps, until the overall render speed becomes acceptable. NVPerfKit 2 features facilitate the search for such bottlenecks, available software and hardware performance counters offer very useful information about NVIDIA GPU performance. They can be used to find out what GPU units are loaded more than the others, where bottlenecks are, and how to raise overall performance. There are plenty ways to read counters, you can use NVPerfAPI calls from your applications as well as analyze the data in PerfMon and PIX. If you need a visual and convenient tool to analyze a Direct3D application, you may use NVPerfHUD, which will provide full information about application and GPU performance in a convenient form right on the screen, when a given application runs. The only thing that I don't quite understand is the reason for not leaving simple monitoring tools in NVPerfHUD for "unauthorized" applications: video memory usage, loads on GPU units, etc. Of course, developers might want to withhold some details (textures, shaders, other draw call details), but why not provide simple info? There would have appeared interesting options, if the first page of Performance Dashboard had been left intact, while Debug Console, Frame Debugger and Frame Profiler had been available only in authorized applications. Journalists and testers would have liked this opportunity. They could have learnt what GPU units were under the heaviest load by a test application, bottlenecks in a given test and even in a scene. If you wish, you can get such data from performance counters in PIX for Windows or PerfMon. But it's less convenient than in NVPerfHUD. Besides, PIX gives an opportunity to capture resources (shaders, textures, etc), which is also blocked in NVPerfHUD for applications that do not support debugging. But all NVPerfHUD features are available to 3D developers, if they properly modify the source code. They used to have only primitive utilities without detailed documentation. And now they have got a powerful tool to profile and debug 3D applications, publicly available and practically identical to the tools used in NVIDIA. NVPerfKit 2 helps solve most development problems: detecting performance bottlenecks, locating rendering errors, using modern GPUs to the full, finding balance between geometrical complexity of a scene and pixel processing complexity, etc. We can establish a fact that NVPerfKit 2 will be very useful for all developers of modern 3D applications that use Direct3D or OpenGL. This kit may also interest testers, journalists, and just enthusiasts, as it provides new features to analyze performance even of third-party applications, though with some limitations. Write a comment below. No registration needed!
|
Platform · Video · Multimedia · Mobile · Other || About us & Privacy policy · Twitter · Facebook Copyright © Byrds Research & Publishing, Ltd., 1997–2011. All rights reserved. |


