RightMark™ Video Analyzer: Testing Video Channels
|

Concept
It's no secret that many cameras have a built-in artificial sharpening procedure for frames, which allows to get good images from a satisfactory matrix. Sharpening also includes sharpening edges by raising the contrast. RightMark™ Video Analyzer (RMVA) allows an objective evaluation of camera's video channel, including its lens, matrix/matrices, ADC, video processor, and a comparison with the "ideal" video channel. Video Analyzer plots a Modulation Transfer Function graph (MTF), the objective in-depth image quality characteristic. MTF graph is a cascading curve, where resolution is plotted on the abscissa and contrast for a given resolution (brightness difference between the lightest and darkest points) – on the ordinate. It's convenient to use this graph to detect faults in large, average, and fine details. MTF also allows to estimate the exact horizontal resolution of a camera (the place on the vertical test wedge, where the lines merge), because the subjective test is very inaccurate. The existing methods for plotting MTF require several programs and a lot of manual operations.
RMVA can also be used to analyze ADC in video capturing devices or any "source-channel-receiver" system. It's small, it does not require installation, and it can process images from any video sources of PAL/SECAM/NTSC standards and 4:3/16:9 formats, including DV/HDV cameras. It has a special mode for testing HDV cameras. The program contains a sample image from an "ideal" camera (see below).
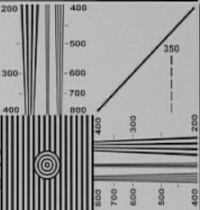
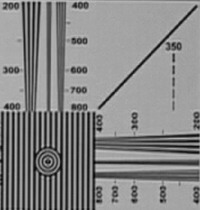
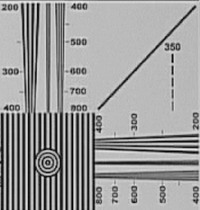
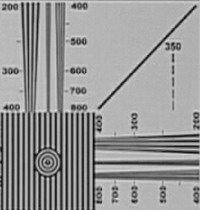
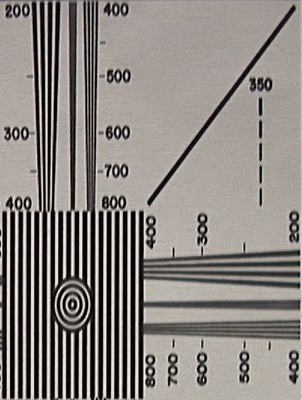
Traditional EIA1956 is used as a test image, because it's the most popular table in Internet and there has been accumulated a wealth of images taken by various cameras. Unfortunately, the table is inconvenient from the point of view of processing results, because it contains three narrow test wedges for the 200-1600 tvl (TV lines) sharpness range instead of one continuous test area composed of bands of increasing spatial frequency. Because of different screen proportions, TV engineers decided to count the bands horizontally only on part of the scan line equal to screen height, that is in a square. That's why wide-screen video (16:9) values will be lower than the values taken for video of the standard proportions (4:3) by 25%.
The white band is taken for 100% brightness (averaging the brightness of the point array on a large white circle in the table center). If a camera uses sharpening, the contrast may exceed 100%. Later on, zero brightness level must be adjusted to plot correct MTF (averaging the brightness of points in the darkest part of the density gradient on the table).
Directions
- Fix the printed EIA1956 table on a wall and provide sufficient and smooth illumination. Place your camera on tripod so that the table fills the entire screen horizontally at average zoom values. If you shoot in wide-screen format, you'd better place the table in the center of the screen. Make sure the table is horizontal. Make sure the camera is absolutely steady and shoot the table for several seconds;
- If illumination and settings allow, use the average iris with disabled gain – it will allow to reach maximum resolution. Remember that autofocus may result in sharpness fluctuations, so it's recommended to disable it after the camera is focused on the table. Pay attention to sharpen/detail level, which is usually specified in the menu;
- One important shooting condition: small white triangles on top and bottom of the table must touch the frame borders, not the limited view finder area. That is you should control the image on an external monitor with 100% visible area or in a video capture program. It will allow to use the entire matrix area and will provide valid results. This factor will be compensated in future program versions, but the compensation cannot be 100% effective.
- Upload the image to a computer and save it in grayscale/24-bit BMP or JPG format (BMP is better).
- Run RMVA;
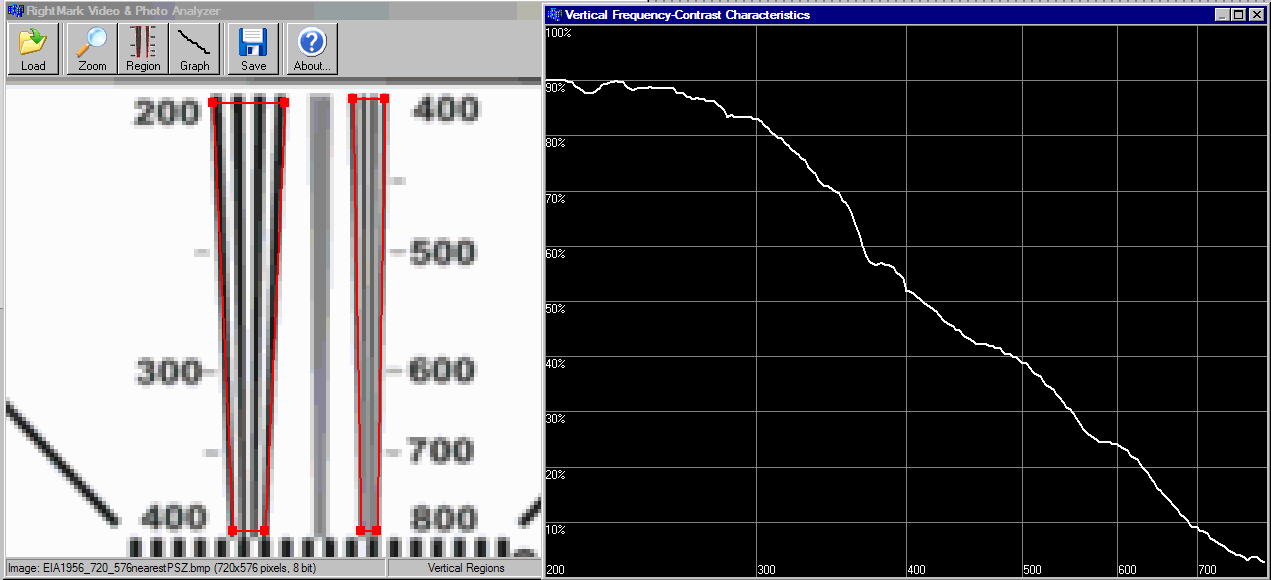
- Click the Load button and load your test image;
- Click the Zoom button to open the zoom menu (1-8x). You can pan the image with a mouse;
- Click Region>Vertical Regions, the program will display two red analysis areas, which should be placed over the left and right vertical wedges. You can move these areas or resize them by dragging their edges. Zoom the image comfortably and place these areas so that they don't go beyond the dark edges of the wedges;
- The Region>White Sample option is used to specify a rectangle for adjusting the white-balance. It must be located within the large white circle in the center of the table, the average brightness of the points inside this rectangle will be accepted as 100%. The HDV mode option is used to test HDV cameras. The analysis areas are swapped, the middle wedge is used, and the resolution is doubled on the MTF graph. The Reset Regions option is used to reset analysis areas to their initial position;
- Click the Graph button to plot the scalable MTF graph: resolution (tvl) – on the X-coordinate, contrast (%) – on the y-coordinate. Determine resolution by 25% contrast drop;
- Click Save to output the results in text form.
Andrey Glazunov, an expert from St Petersburg, created an image from an "ideal" DV PAL camera.
Tests
We'll use the latest models of 3-matrix DV cameras – Sony DCR-HC1000E and DCR-VX2100E, as well as an HDV camcorder Sony HDR-FX1E.
As demonstrated by real test samples, noise and compression artifacts have great impact on spread of results. That's why the data in text format was imported into Excel, where we built a polynomial trend line of the fifth order. Let's see how the MTF graphs correlate with subjective perception of the image.
VX2100, normal sharpness

HC1000, normal sharpness
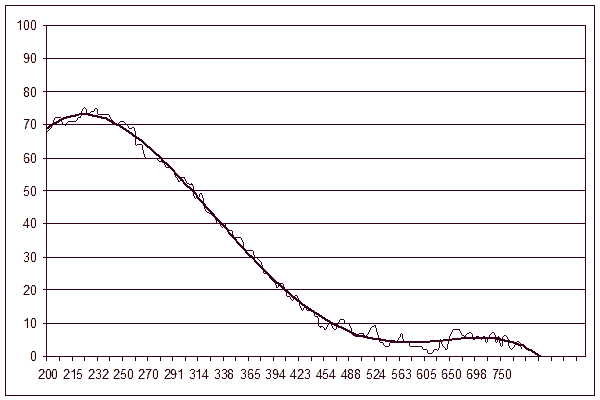
As you can see on the graphs, the image from the semi-professional VX2100 is closer to the image obtained in the "ideal" camera. The graph starts at almost 100% and slowly goes down to 500 tvl, where it holds on at 20-25%, creating an illusion of a sharper image. HC1000 graph has a "hump" at the beginning, rises to 75% and falls down to 450 tvl, where the residual contrast is below 10%.
Now let's set sharpening to maximum and see how well artificial sharpening works.
VX2100, maximum sharpness

HC1000, maximum sharpness

Sharpening worked well in VX2100: it raised contrast to 110% and prolonged the visible resolution to impressive 750 tvl (do not mix it up with theoretical resolution limit for DV PAL standard, which is 540 tvl). Of course, it developed the white edging on dark contours, which irritates some people and leaves the others indifferent. In general, perception of artificial, practically gratuitous at that, depends on upbringing :) Increased sharpness in HC1000 actually provides no visible results, the image remains soft and its contrast does not exceed 80%. Visible resolution is the same modest 450 tvl.
It should be repeated that you can treat the results obtained mostly as preliminary, because RMVA plots the MTF graph, which is incompletely normalized by brightness.
And finally, the firstling HDV 1080i, which we promised to test by the new technique in its review. As the tests demonstrated, Pinnacle Liquid 6 really deinterlaces frames, which are copied from Sony FX1, but it should be no problem to determine the horizontal resolution. We tested the camera with disabled Picture profile, which should presumably set sharpness to 9 (available range: 0-15).
FX1, Picture Profile off (16:9)

Of course, we are a little disappointed with the low resolution, especially as sharpening is used here. The "hump" at 1300-1400 tvl can be explained by the imperfect algorithm. Maximum 800 tvl. However, theoretically in HDV 1080i it can reach 1440/16x9=810 tvl.
Conclusions
Despite the found shortcomings and defects, RightMark™ Video Analyzer can be used to test video cameras to see how MTF depends on the visual analysis of an image. At this stage we used a simplified algorithm for determining the contrast, which consists in determining just a single brightness minimum and maximum at each test wedge cut-off. This results in the spread of values, but additional processing in Excel allows to get adequate results. Brightness normalization of the graph should also be completed. We hope that this program will be actively developed. There has been planned a noise level detection feature.
Reference
- afanas.ru
- normankoren.com (in English)
- bealecorner.com (in English)
- hobbymaker.narod.ru
- zenit.istra.ru
- potrebitel.ru
- prodav.narod.ru
- imatest.com (in English)
Attention: Reference to this description is mandatory when
publishing results obtained in RightMark™ Video Analyzer.
Write a comment below. No registration needed!
|
|
 |
|
|
|