 |
||
|
||
| ||
|
||
|
||
| ||
The main objective for evaluating the quality of power amplifiers is to determine product quality by selected criteria - in absolute scale and in comparison with other products. Success of a power amplifier, as a good product, depends on many factors. We can single out the following factors of major importance to users: exterior design, ergonomics, functionality, and audio quality. The price is also an important factor to consider, when you buy a product. But the comparative price/quality ratio for a given segment is more important. To compare amplifiers with each other, as well as to get a clearer idea of each product, amplifiers should be examined and compared by all key parameters that form the overall score. Direct comparisons with rival products are very useful, when the reference path is used as an absolute standard. Measuring equipmentEquipment for objective measurements must include an audio interface with better parameters than a tested device offers. For example, the E-MU 1616m with the following features:
We perform measurements with our firmware RMAA suite. Other programs can be used for additional tests or to demonstrate results. For example, Adobe Audition can be used to display sound waves. A resistive load consists of resistors. Output capacity of a resistive battery is adjusted individually, it must be higher than the output capacity of an amplifier. 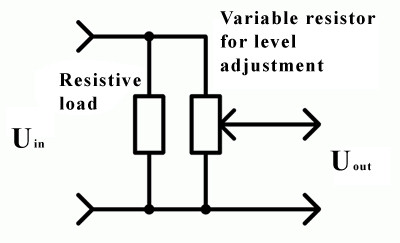 A voltmeter reads Uin and calculates the output power. A result obtained is not absolute. It may have to do with mains voltage deviations - not all amplifiers control and adjust input voltage. To take it into account, we also specify a voltage level in the mains. Interpreting objective measurementsOur analysis is based on objective parameters – the key existing parameters that can be measured. They are frequency response ripple, in-band harmonic distortions depending on the output power level and load, spectrum screenshots at control frequencies. A test report may contain results of the following tests. Frequency response Frequency response characterizes the operating band of a device and timbre flatness. If an amplifier possesses timbre and loudness controls, we show frequency response in the extreme timbre positions. In order to obtain more accurate data, the frequency response characteristic is adjusted with regard to the frequency response error of the audio interface - these results are just subtracted in RMAA. 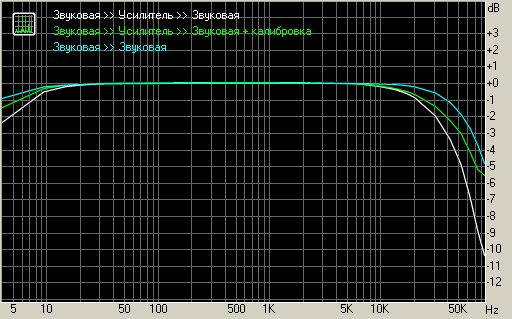 It's normal to have a little drop at the edges of the frequency band. Harmonic distortions level A level of harmonics characterizes the audible component of harmonic distortions. When measurements are taken, a tester should pay attention to spectral distribution and character of distortions. Manufacturers specify maximum power capacity of their devices only in the standard amplifier mode with the standard load. Unfortunately, most testlabs do not always register operation in the standard mode, they prefer to measure the output power level with standard 1 and 10% distortions, or THD depending on the output power level. 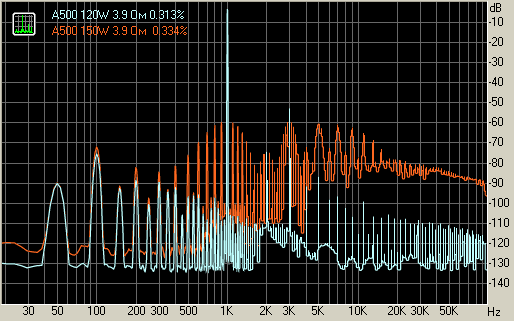 This example shows amplifier spectrums at different output power levels with insignificant differences in THD percentage. Measurements at 1% and 10% are useless in this case. 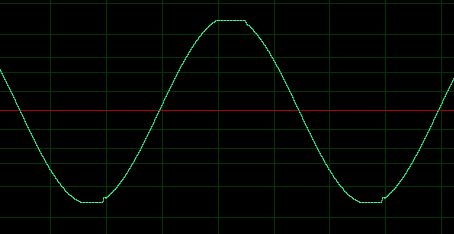 The sine at 0.334% distortions in this case. Spectrums with distortions at control frequencies are published for different output power levels. It helps us determine how distortions depend on the output power capacity. 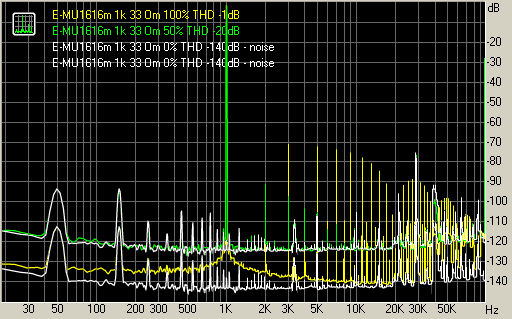 Distortions at the output of the E-MU1616m headphones amplifier with a 33 Ohm load at maximum and average gain. We also show a noise shelf for each measurement. Distortions being distributed identically in the spectrum for all frequencies, we can deduce how a harmonic distortion factor depends on frequency, for a given harmonic or THD + noise to evaluate a level of distortions. 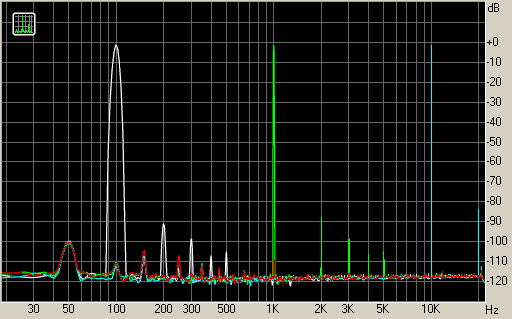 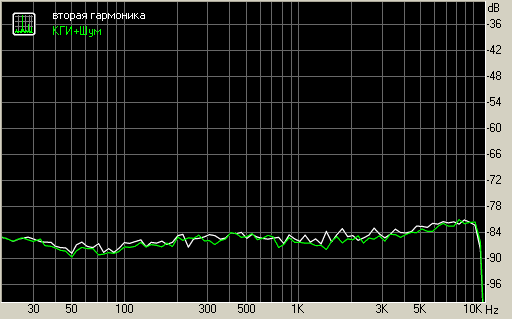 There will be no big difference between "only the second harmonic" and "THD+noise" in some cases, because the second harmonic makes a major contribution. Harmonic distortions in a number of amplifiers depend not only on the output power, but also on gain. 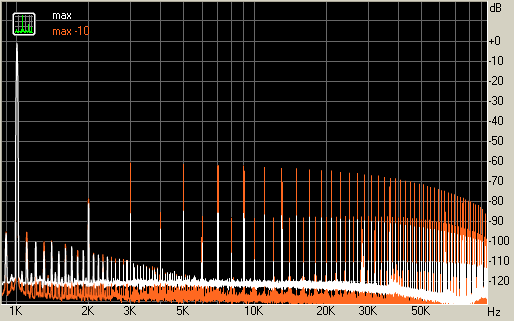 Levels of output harmonic distortions differ at the same output power level but with different gain In this test we determine what mode of a given amplifier provides the highest audio quality. Subjective tests, AES20, requirements to experts and auditionsThis test procedure shares the approach used in the procedure for testing acoustic systems. Only some details are different. When a subjective test is performed, amplifiers are hidden behind an opaque screen. An identical signal is fed to all amplifiers from a multi-channel audio interface or switched through a router. The router can be based on passive or active elements. Passive elements (gang switches or relays) are preferable, because they bring fewer distortions to the signal. An amplified signal from the output of the amplifiers again passes a router and then goes to reference monitors. It makes sense to use reference monitors of the same price segment, or of the price segment the amplifier is designed for (some functions of a given amplifier may raise its price). We may also audition amplifiers with speakers of higher class as an additional test. Audio peculiarities of each model are written down in a report. The overall score comprises the following components:
Roman Kuznetsov (romanrex@ixbt.com)
November 4, 2007 Write a comment below. No registration needed!
|
Platform · Video · Multimedia · Mobile · Other || About us & Privacy policy · Twitter · Facebook Copyright © Byrds Research & Publishing, Ltd., 1997–2011. All rights reserved. |


