|
||
|
||
| ||
|
||
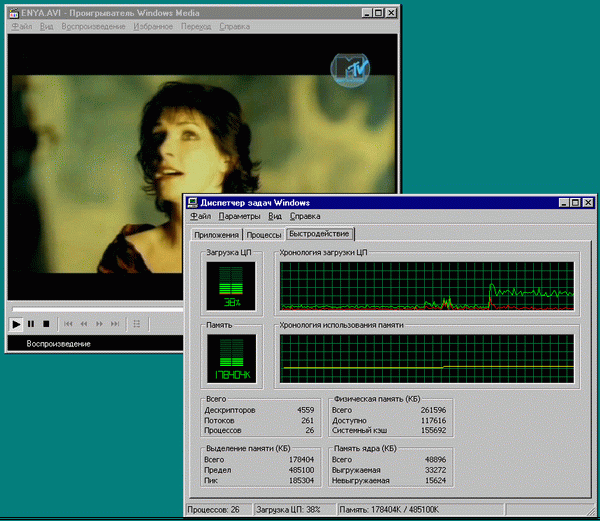
|
||
| ||
...This game has neither rules, nor limitations. Neither winners, no losers. The rapid growth of computational power is made up for by the adequate computational complexity, or software appetite. Performance of a PC bought a year or two ago is not satisfactory, and such dissatisfaction grows with time. IntroductionThis is actually not tuning. It's rather steeplechase. Professionals that optimize systems use complex soft hardware means to feel every signal track. Management of all such stuff can push away even advanced experts. But this is the way brandname PCs are created. However, we have a different purpose - we are going to make it just more or less balanced. Fortunately, modern processors and OS are so smart that they have necessary measurement tools. Configuring via Task ManagerThe Task Manager integrated in Windows NT (Ctrl-Alt-Del to enable) is a powerful monitoring system which is always at hand. (The Windows 9x has the WinTop utility of the Microsoft Resource Kit instead of the Task Manager.) What does the Task Manager do? First of all, it shows the CPU load, dedicated, used and free memory size, swap file usage and many other aspects. You can estimate the overall system situation and define the role of each process started. CPU power estimationMost applications don't need fast processors, and the twice higher CPU clock boosts up performance only by a third. If the CPU load indicator hovers around zero or the load diagram reminds a chain of mountains, your CPU has enough computation power to solve problems it faces! The higher clock speed will make the peak's base narrower, but the overall task time will remain almost the same. Performance grows noticeably in those tasks where the CPU load reaches 100% (for example, search of regular expressions, image processing etc.). But we can't be sure that the Task Managers tells truth. CPU load indicates readiness of all other system processes to give time slices. High CPU load can be caused by a disc subsystem, memory subsystem and other components! It doesn't mean you shouldn't believe the Task Manager - it just means that the CPU clock is not the only cause. A high CPU load indicates a possible performance growth but it doesn't define which components should be replaced for that. Also remember that an incorrectly written application can consume a lot of CPU time even if it does nothing. This is typical of the early versions of the Context dictionary and Socrat translator - it caused nearly 100% CPU load and slowed down the system performance. All Microsoft Word versions (up to XP inclusive) have a very unpleasant defect which makes the load jump up to 92-95%. The increased clock speed doesn't solve this problem and hardly boosts the performance! The only wayout is not to use such applications or use alternative versions. If a stably running system slows down, check in the Task Manager what process takes most time (CPU column). 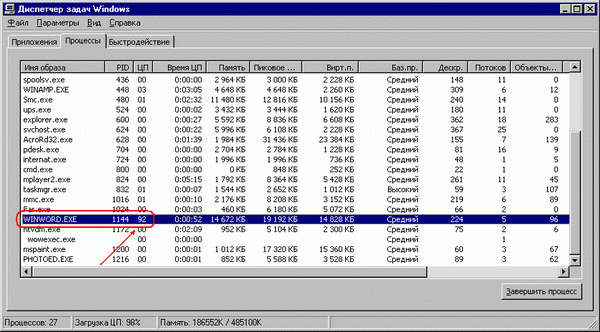
Estimation of RAM neededSystem performance doesn't depend linearly on RAM size. An inconsiderable lack of memory actively enables the swap file and slows down the system performance. Surplus of RAM doesn't help much - although some memory can be used for a disk cache, applications won't adequately speed up. If the system addresses the hard drive when you switch between applications started, it means that it doesn't have enough memory, and you'd better add one more module. To define the size needed check up the current and peak memory for the last session in the Dedicated memory column in the Performance tab in the Task Manager. For efficient operation you should satisfy PC needs of the dedicated memory (check it by enabling all applications you are going to run simultaneously). But most applications have varying appetite, which sometimes grows up so much that the system has to use the swap-file. I don't have any recommendations in this case as applications have different characters and strategies of memory consumption. If you want to save money, check the Memory indicator (Performance tab) and mark its "average maximum" values. In a week it will be clear how much memory your system needs. If time is more precious for you insert a memory module equal to the maximum size of the RAM dedicated during the last sessions (Peak line). There are actually few applications that wholly use the RAM they require. Memory dedication doesn't mean that the memory will be immediately captured, and the physical RAM can be provided only for those pages which are addressed at least once. A programmer can ask to dedicate even 1GB but that won't boost the performance if the memory is not going to be used. The dedicated memory graph shows the memory size reserved but it doesn't indicate where the memory is used or not. The physical memory graph shows the RAM available. The more, the better. It's considered that if 50 or 100 MB is available, the system doesn't need more. But it's not very correct. If you complete some monster resourse hungry application before addressing the Task Manager the memory it took before will be free until you switch to an application partially or fully swapped out to the disc. Look at the picture below: the system has 256 MB memory installed, 235 MB is dedicated, 98 MB is free. But 235 + 98 > 256! That is why you should take into account not the current but minimal physical memory available. Keep your eyes wide open and check operation of other applications in the Task Manager. 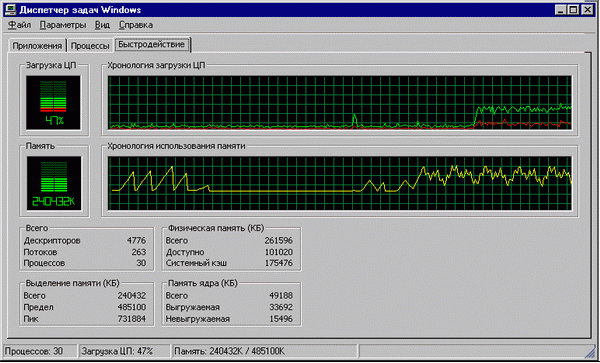
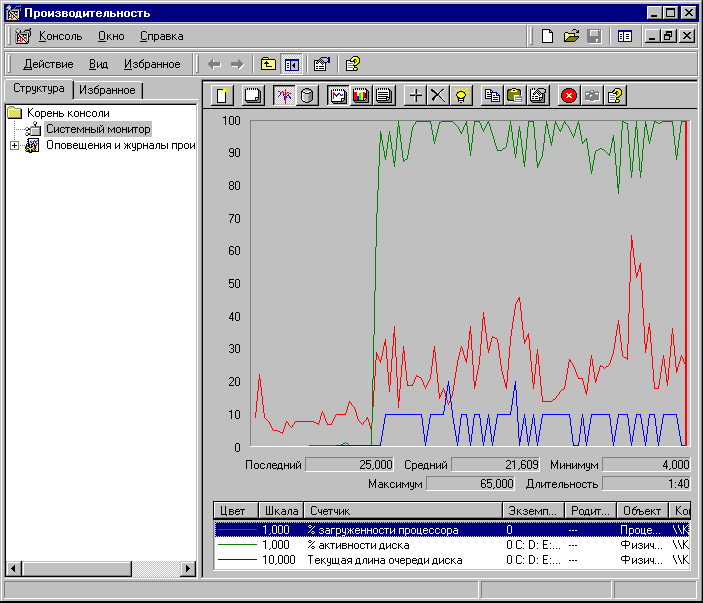
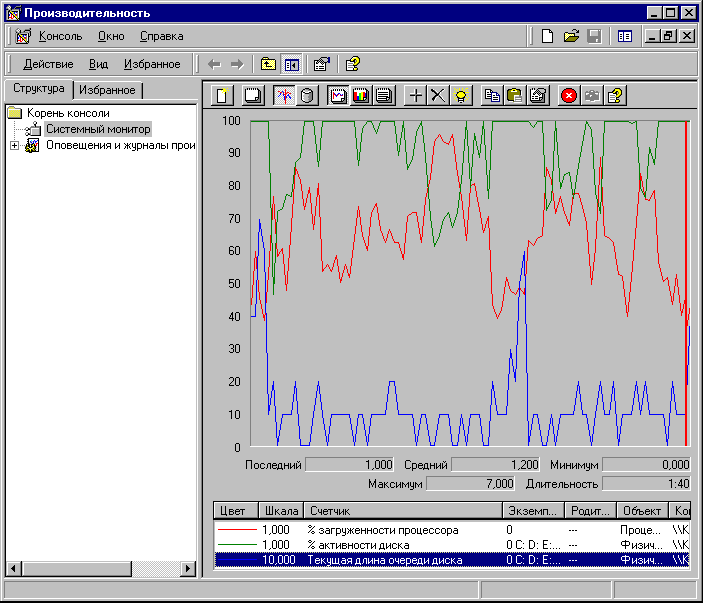
System MonitorThe System Monitor is a mine that leads deep into the OS. It helps to find components and places the most critical to performance. Let's run an antivirus scanner to see which of the PC components is to be replaced to accelerate scanning. The overall scanning time much depends on the hard drive efficiency, while the CPU clock is not that vital. Let's have a direct look at it. Start-> Settings -> Control Panel -> Administrative Tools -> Performance -> System Monitor. (The Windows 9x contains the System Monitor in the service programs.) Now select Add Counters in the context menu in the middle of the console and add three counters: CPU load counter (object: processor), disc counter (object: physical disc) and the current disc queue legth (object the same). Then go back to the main menu of the System Monitor and click Close. The Explanations button will give you information on the current performance counter. The system monitor now will draw three curves on the screen. The green one indicates the disc load, the red one - CPU load, and the blue one shows the request queue length per disc (the colors can be changed manually). The left picture (below) shows a well balanced system. The disc load is pretty high. It means that the time taken for the heuristic analysis of one file (antivirus scanning) is comparable to the time of reading of another. The CPU works at its full potential. The CPU load peaks and the disc usage drops perfectly coincide! You can't boost performance by replacing the disc with a more efficient one because it will just stand idle most part of the time. Have a look at the right diagram obtained after upgrading of the drive. The CPU load increased a lot, the drops of the disc diagram became long and deep. The fast drive turned out to be faster only be half. The linear reading speeded up, but the search time increased as well. There's a high peak in the middle of the blue curve that demonstrates how the disc request queue length grows, - this peak corresponds to the dropdown in the CPU load and to the disc usage maximum! The drive made a lot of noise but it still couldn't process the requests received. So, to increase the system performance we should replace the CPU with
a more efficient one. But it doesn't mean a faster one: we don't know yet
what holds back the system: it can be the cache memory or the clock. In
the Processor Core we will discuss it more thoroughly. Obviously such technique
can be applied not only to antivirus scanning but also to other tasks to
balance the system.
In the processor coreThe Pentium processors have a developed monitoring system and control memory addressing, errors in branch prediction, eviction etc. The processor is no more a solid silicon die! Now with the performance counters we can easily determine which PC components should be replaced. There are two performance counters in all, and they are not available by default from an application level. But there is a great deal of programs which will help you to get them. At Mark Rusinovich's site you can get a utility named CPUMon which weighs only 40 KB. It's quite user-friendly (just remember that you have to have the administrator's rights under the Windows NT). Select the class of events in the Class tab, and select the event in the Counter tab. do it for both counters. Let's solve the following problem: we have an application which works too slowly and we would like to increase its performance but we don't know how to do it. If the hard drive is not that noisy, performance can be affected by the CPU computational power (although it's not the same as the clock speed, but they are very close), or by the L1 and L2 caches, or by the RAM bandwidth/latency, or by all factors at once. So, what should we do? Select Bus in the Class tab of Counter 0, and then select BUS_TRAN_MEN in the Counter tab. This counter will monitor the number of memory requests passed through the bus. Then select Cache for Counter 1 in Class tab and DATA_MEM_REFS in the Counter tab. It will fix the total number of memory requests. 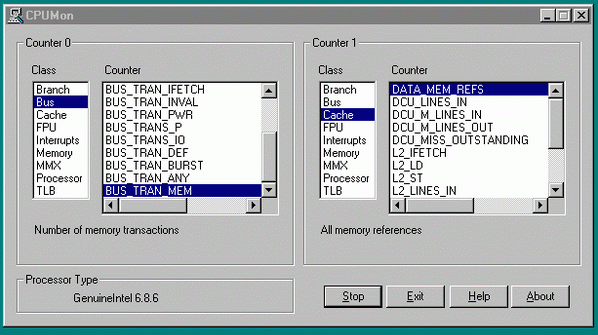 Run the application, click Start and let the counters accumulate some statistics. Then click Stop and look at the pop-up window. 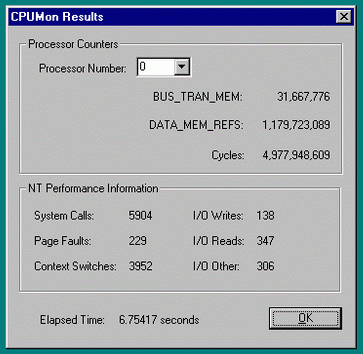
The cache memory is sizeable enough, that is why the bottleneck is the CPU clock. (Attention! We speak about processors of the same architecture, otherwise the analysis can't be considered correct!) Below is an example of a high-clocked system with little L2 cache (internecine battle: Celeron vs Pentium III Coppermine). 290 M memory requests at 8 sec., almost half of them passed though the bus (120 M), and the others were locally processed. Why does the number of requests differ so much per unit of time? Well, RAM is not a cache, and the second system creeps along at a snail's pace. 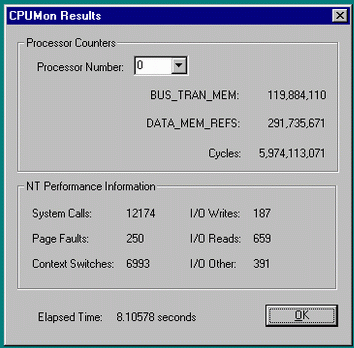 To increase the performance we should replace the CPU with one that has a more capacious cache (this is the best solution) or increase the clock speeds of the FSB and RAM or use a dual-channel chipset (this recommendation doesn't refer directly to processors with the Coppermine core). You can get more information about counters in the Intel Architecture Software Developer's Manual Volume 3: System Programming Guide available at Intel's site free of charge. System tuning with profilerProfiling delivers even better tuning means. VTune from Intel (over 100 MB) is the best profiler. We didn't mention yet that the system performance can be affected by drivers; we also missed a graphics system and its contribution into the overall performance. Before using the profiler you'd better read some useful guides, for example here you can find a good beginners' guide for the VTune. Below are the profiling results of one of the applications. OY axis: time spent by the CPU in each of the system modules; OX: modules. The most part of time is referred to the core (~25%), which is followed by NTDLL.DLL and the application process of the bruteforce password generator PSWD.EXE (~20% and 18% respectively). The graphics system and its G400.DLL library have a very small effect (Matrox Millennium G450 Dual Head) - it makes less than 5% and needs no optimization. The FS driver, NTFS.SYS, took almost no time, and the HDD efficiency is not critical in this case. 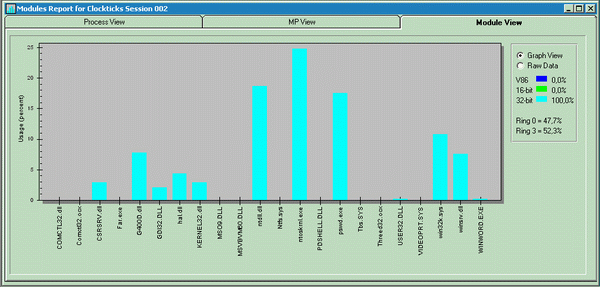 So, the most critical bottleneck is NTOSKRNL.EXE. To find out what to do we should look inside the core! In the VTune you can do it double clicking on the respective bar. The core splits to a chine of mountains with high peaks and deep hollows. The higher the peak, the more CPU clocks it takes. The highest mountains are painted red. Bring the mouse pointer to the Everest to find out the function it refers to, and then click twice this peak with the right button to get inside the disassembler code... Or better don't do it. As a rule, it's better to refer to function names to find out whether they are related with the I/O system, memory or CPU resources (the most Windows system functions can be found at MSDN). In this case the system is affected by the RAM (see the details in the VTune Guide), and the best solution would be to replace memory with a higher-clocked one. The most interesting thing is that the VTune is able to emulate a lot of various processors. For example, your PC is based on Pentium III and you want a Pentium 4. Although the estimation won't be that precise, it still delivers some useful information to be considered. ConclusionIn closing let me tell you one small parable. Once one greedy landowner
came to a sage and started to complain about his poor life... What was the
sage's answer is not important because the landowner wouldn't listen to
him. Money and clock speeds are dangerous. The more you get, the more you
want. That is why it's much better to optimize your needs than your PC.
Chris Caspersky (kk@sendmail.ru)
Write a comment below. No registration needed!
|
Platform · Video · Multimedia · Mobile · Other || About us & Privacy policy · Twitter · Facebook Copyright © Byrds Research & Publishing, Ltd., 1997–2011. All rights reserved. |