 |
||
|
||
| ||
|
||
|
||
| ||
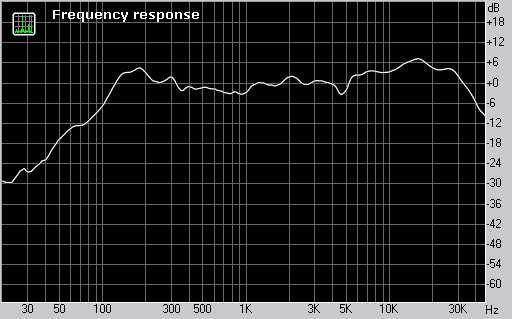
Frequency response curve of the front speaker Microlab AH-500, read at the axis of the HF driver 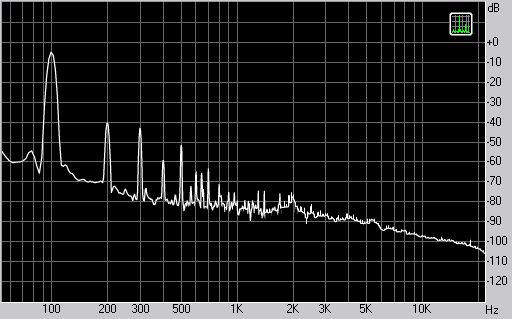
Spectrum of the signal reproduced by the front speaker Microlab AH-500, 100 Hz 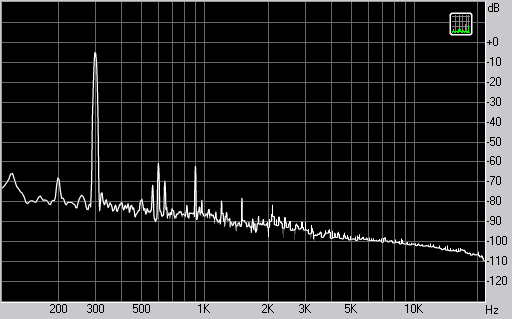
Spectrum of the signal reproduced by the front speaker Microlab AH-500, 300 Hz 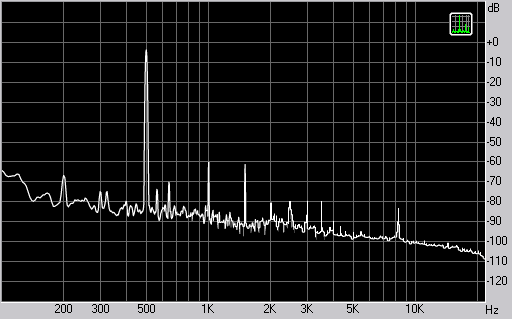
Spectrum of the signal reproduced by the front speaker Microlab AH-500, 500 Hz 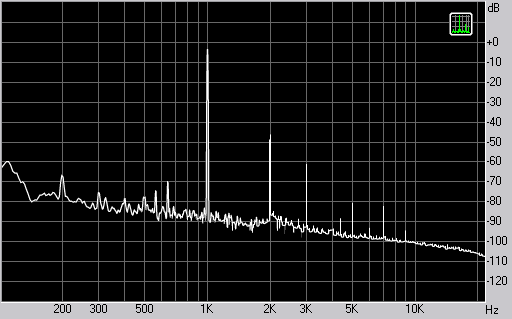
Spectrum of the signal reproduced by the front speaker Microlab AH-500, 1000 Hz 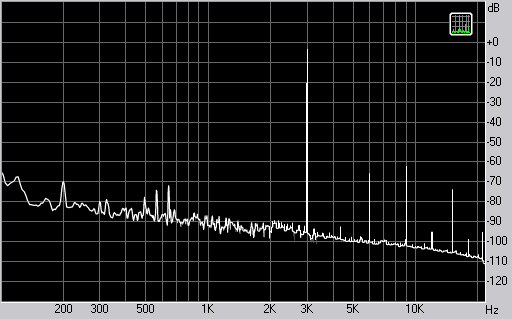
Spectrum of the signal reproduced by the front speaker Microlab AH-500, 3000 Hz 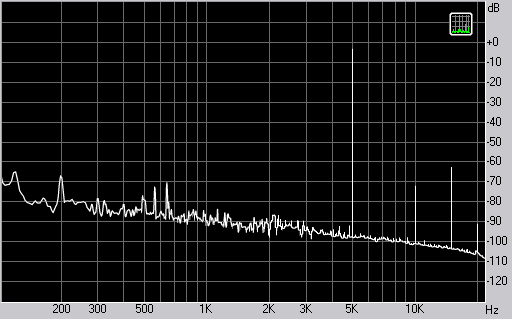
Spectrum of the signal reproduced by the front speaker Microlab AH-500, 5000 Hz 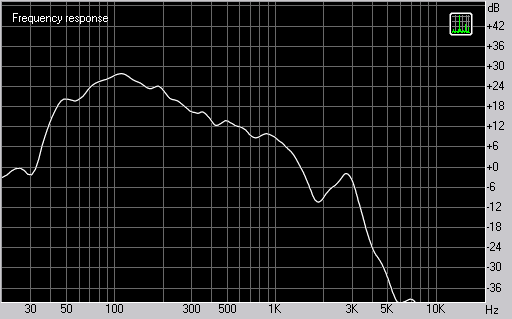
Frequency response of the subwoofer Microlab AH-500, read at the axis of the LF driver 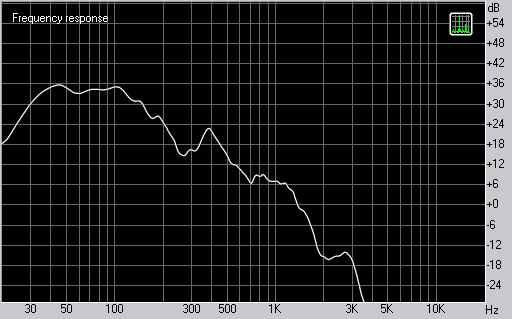
Frequency response of the subwoofer Microlab AH-500, measured in front of the reflex port 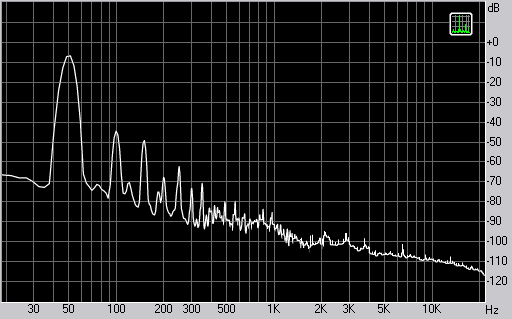
Spectrum of the signal reproduced by the subwoofer Microlab AH-500, 50 Hz 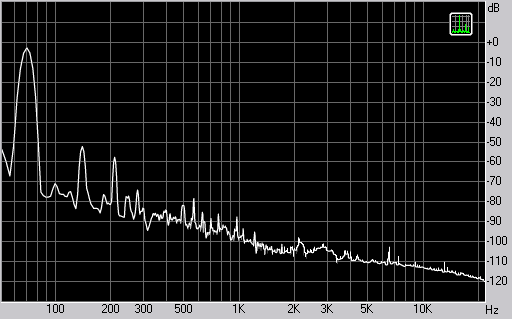
Spectrum of the signal reproduced by the subwoofer Microlab AH-500, 70 Hz 
Spectrum of the signal reproduced by the subwoofer Microlab AH-500, 85 Hz 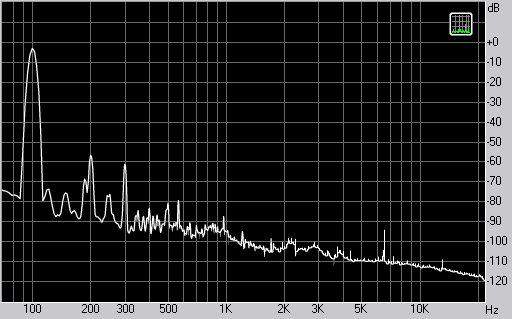
Spectrum of the signal reproduced by the subwoofer Microlab AH-500, 100 Hz 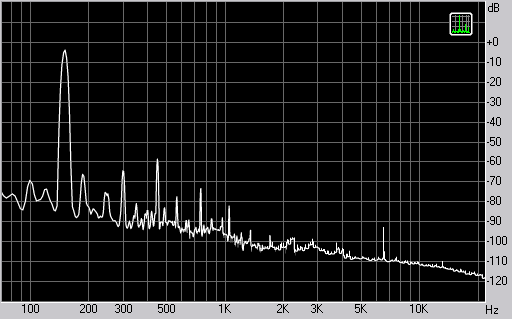
Spectrum of the signal reproduced by the subwoofer Microlab AH-500, 150 Hz Write a comment below. No registration needed!
|
Platform · Video · Multimedia · Mobile · Other || About us & Privacy policy · Twitter · Facebook Copyright © Byrds Research & Publishing, Ltd., 1997–2011. All rights reserved. |


