 |
||
|
||
| ||
|
|||||||||||||||||||||||||||||||
CONTENTSIntroductionRecent time has seen an increasing number of questions on texture filtering realisation in videochips. At first sight, it may seem that capabilities of actual videochips enable an ideal fullfilment of their main function (texture filtering) as manufacturers have been improving it since the very first generation of 3D accelerators. Besides, the current number of transistors (that run into hundreds of millions) seems to ensure an ideal realisation of texture filtering. However, each ideal has its limit when a further approach to a perfect realisation brings less in return. Our colleagues from 3DCenter.org were probably the first to touch upon this aspect. Later, NVIDIA forced the use of an "optimised" trilinear filtering in the whole line of its NV3x videocards. And we have learnt recently that ATI uses a similar "optimisation" in its new chips from RV3x0 to R420. The aim of this article is to demonstrate and analyse the difference between the ways trilinear filtering is realised in ATI and NVIDIA chips. The tests will be conducted on the latest-generation products: R420 - Radeon X800 and NV40 - GeForce 6800. First of all, let us leave no uncertainties about the terms: Trilinear filtering (trilinear MIP mapping)) is a further development of bilinear filtering with MIP mapping. It results in a balanced average value between the results of two bilinear selections from adjacent MIP levels of the texture. The value of either bilinear selections can prevail, depending on the pixel/texel size ratio. Such approach prevents blinking and a sharp change of texture contrast when the camera is moving about the objects. The following articles can provide more detailed information on texture filtering:
I repeat that this article won't deal with the differences between bilinear and anisotropic filtering, it only focuses on the peculiarities of trilinear filtering realisation.
Omitting all insignificant details, we can say that trilinear filtering depends on two values: Rho
from formula (1) and Lambda from formula (2).
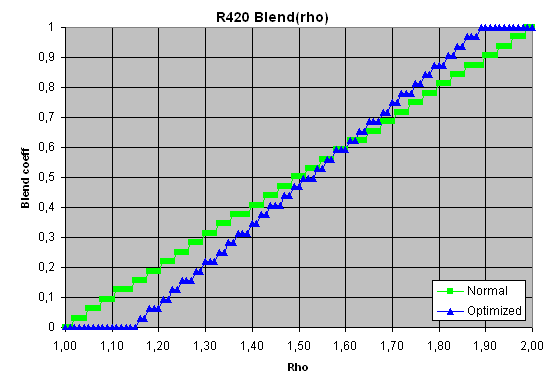
 (1) (2) (3) The formulas above are taken from OpenGL specs. Though it is seen that Lambda is directly depends on Rho, we'll use both values in the article, and the material below will give you the reason why. Rho denotes the scale factor and Lambda stands for the level of detail (LOD). Tau, the final colour value, can be found as a linear interpolation between the colour values selected from two MIP levels, while Lambda's fractional part denotes interpolation factor (Lambda's integer part identifies which MIP levels should be used to select colour values). What we need to know about formula (1) for now is that the resulting value depends on the texture area per one pixel of the final image. Images Our regular readers must have repeatedly seen images like the one above. Such pictures appear when a 3D accelerator renders an infinite cylindrical tunnel which has the walls painted with a specially prepared terxture. The peculiar thing about such texture is that each of its MIP levels is coloured differently from the previous one. When you look at such picture, you can tell the kind and the degree of filtering the 3D accelerator uses at different degrees of increasing/decreasing textures, isotropic/anisotropic texturing. You can also identify how filtering depends on the angle at which the texturing is done. All this could be found from one single image. Well, at least until recent time. The pixels on the circle usually characterise the filtering that will be done if our camera turns by 90 degrees and faces the wall. The "9-o'clock point" on the circle will correspond to the filtering when the camera is turned to the left, the "12-o'clock" point to the filtering with the upward-turned camera, etc. Likewise, the points situated close to the centre of the picture will corrsepond to the filtering that is applied to distant and distorted (prolonged or compressed) textures. The shape of the petals depends on the method that estimates the scale factor (Rho, see formula 1). In the case of trilinear filtering, the colours must smoothly change into one another. We'll show you similar pictures (only with simpler textures) further in the article. All the MIP levels are white except the second most detalised one which is coloured in red. Such texture gives a perfect view of the places where the given MIP level will be used and also enables to see trilinear interpolation between the adjacent MIP levels. All images and results were received using a special iXBT-developed TextureFilteringTester program that allows to examine quality and speed characteristics of texture filtering algorithms executed by 3D accelerators. So, let's look at the pictures that result from high-quality (non-optimised) trilinear filtering on ATI R420 and NVIDIA NV40. Each picture below is a link to a large-size PNG image. How were these images captured? On NVIDIA NV40, we disabled optimisation in the control panel in order to get an image of non-optimised trilinear filtering. ATI now uses a more tricky control technique to enable/disable trilinear filtering optimisation. When the texture is being loaded, the videocard driver analyses the differences between the texture's MIP levels. If it decides that less detalised MIP levels are not minimised copies of the previous ones, then trilinear filtering optimisation is disabled and a standard filtering method is used for this texture. So, in order to get images of optimised trilinear filtering, we deceived the driver with the help of a specially modified texture. Experiments on various textures revealed that ATI switched on trilinear filtering optimisation only for certain texture classes, depending on the way the aplication described them. For example, DirectX only allows three classes: static, dynamic, and managed. And it is only for managed textures that optimised trilinear filtering switches on in the current driver version. What conclusion can we draw basing on the images above considering we only deal with trilinear filtering in this article? When optimised trilinear filtering is switched on, fully white and fully red areas grow to a roughly similar size in both chips. R420 image also features a certain banding while NV40 colour transition is extremely smooth. To make it more complicated, here's an image captured on a RefRast reference rasterizer that is part of DirectX SDK. If you take a closer look at it, you'll see that the image coincides with that captured on R420 with filtering optimisation disabled. Not to sound precarious, I'm giving you a picture (below) that contains pixelwise differences between standard and optimised filtering on R420 and NV40, and it also shows the difference between RefRast and R420 images. For readers' convenience, I united the three pictures into a large one and executed an Auto Levels operation in Photoshop. Now the differences between the filtering types are seen with the naked eye, and besides, you can compare behaviour of different chips. The first conclusion we make is that on each chip, changes in trilinear filtering do not depend on the angle at which the texturing is done. And we can also note that R420 and RefRast filterings are almost identical. That, in fact, brings me to the end of the "picture part" and we're going to numbers. Numbers and graphsThis part will show you the way trilinear filtering is done and also the speed of its execution in the green area of the picture below. This area has LOD and Lambda value changing from 1 to 2 (left to right). It means that only the first MIP level must be used in the extreme left point during filtering and only the second one in the extreme right point. The area between them features their linear combination.  But let's see what happens in reality. Below are four graphs, two for each chip (R420 and NV40). They are build basing on experimental data and show the dependence of trilinear interpolation factor on Rho and Lambda (see the formulas and their description at the beginning). Each graph features two curves, for standard and optimised trilinear filtering.     In addition, here's a graph for DirectX RefRast:  Now we should elucidate why we had to make two graphs for each chip. If you take a closer look at them, you'll see that ATI and NVIDIA chips perform linear interpolation basing on different variables. ATI uses Rho while NVIDIA uses Lambda. It becomes evident once we look at the points where interpolation factors equal 1/2. ATI reaches this factor at Rho = 1.5, NVIDIA at Lambda = 0.5. We can also see that the ATI chip performs non-optimised trilinear interpolation similarly to DirectX RefRast, which is the point I'll come back to later. Now let's examine the graphs.
We can draw the following intermediate conclusions basing on the statements above: (a) the percentage ratio of areas in which ATI and NVIDIA use only bilinear filtering during "optimisation" is practically the same; (b) both in standard and optimised trilinear filtering, ATI images will sometimes be sharper than those of NVIDIA, but in the case of a moving camera, ATI images are more likely to feature moire and dithering that result from under-filtering.
Now let's get back to R420 and RefRast graphs. We can note a stepwise shape of the line and a linear dependence of interpolation factor on Rho, not on Lambda as OpenGL (and DirectX) specs recommend. The stepwise shape is caused by the fact that DirectX only requires a 5-bit precision for the interpolation factor. As was already mentioned, our colleagues from 3DCenter.org were the first to touch upon this issue. And while I personally would like to have a more precise filtering, DirectX specs do not demand it and vendors have the right to stay within the specs. Now let's examine the non-linear dependence of trilinear interpolation factor on Lambda. The thing is, logarithm calculation is an effort-consuming task that requires quite a lot of transistors for the module that executes it. And approximate calculation is used as a yet another optimisation:
if
"x" is integer > 1 Then x can be taken from the Rho exponent, while y is the Rho mantissa. This is the optimisation that both RefRast and ATI use.
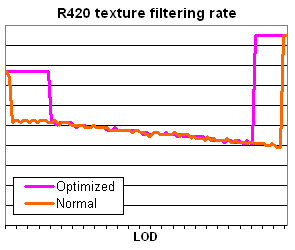
And now the dessert: graphs of trilinear filtering performance changes depending on LOD. Certainly, optimised and standard filtering modes are meant. (Warning: the Y axes have different scales for different chips.) 
 The graphs demonstrate why ATI and NVIDIA had to optimise trilinear filtering. No comment seems to be needed here. ConclusionI won't go much into details of trilinear filtering quality, especially considering that it is a subjective value in this case. But nobody has yet changed the specs that describe optimal algorithms of filtering, and videochip manufacturers can't predict all the ways their products will be used. The more productive videochips get, the more people want to use them not for 3D graphic rendering but as co-processors for calculations. And meeting specs' demands is rather an order than a suggestion here. (You can also visit www.gpgpu.org to see examples.) But let's get back to reality. Considering that most of the given accelerators will be used for 3D games only, we can say the following things:
We're glad to suggest to our readers that they themselves estimate optimisations in R420/RV3xx using our utility:
The right part of the pictures gives a clear view of the difference between standard and optimised trilinear filtering. You can download the program using this link (850K). You can also download a set of (1.2MB) textures and use them instead of the default one: all you need to do for this is to rename them into test.png.
And of course, ATI has the right to change optimisation algorithms, so we can guarantee the corect work of the program only with
CATALYST 4.5 drivers.
Alexey Barkovoy (clootie@ixbt.com)
01.06.2004
Write a comment below. No registration needed!
|
Platform · Video · Multimedia · Mobile · Other || About us & Privacy policy · Twitter · Facebook Copyright © Byrds Research & Publishing, Ltd., 1997–2011. All rights reserved. |