 |
||
|
||
| ||
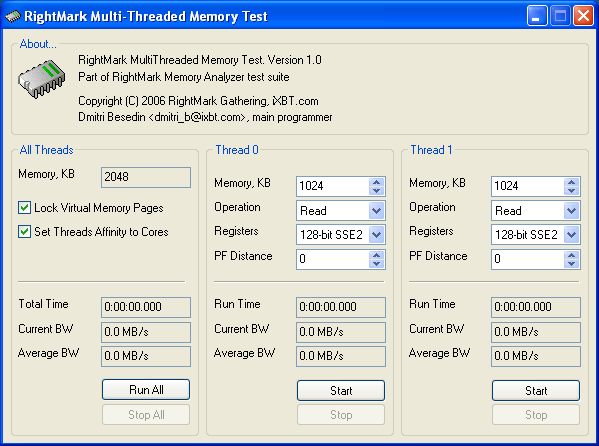
Dual core processors make up a larger half of products, manufactured by the two leading CPU makers these days. From the point of view of memory, these processors differ in its architecture (L2 Cache in particular — dedicated or shared) as well as in its external interface (integrated memory controller (available/not available) and memory type supported by this controller). Detailed analysis of such a memory system evidently requires not only one core, but also both CPU cores to access cache/memory. This mode will help detect certain memory operation aspects that are hidden from the traditional single-core approach. Besides, simultaneous memory access from both cores may contribute to reaching higher real memory bandwidth, that is it may reflect memory characteristics better (as the data exchange rate inside a processor may be a bottleneck). Considering the importance of the above-mentioned issues, we added a small (just 48 KB) utility into the new version of RightMark Memory Analyzer (RMMA) 3.7 - RightMark Multi-Threaded Memory Test (RMMT). It was decided to write a stand-alone application due to the initial "low-level" orientation of the main benchmark - RMMA. It's intended for analyzing microarchitectural details of a CPU core in the first place rather than aspects of multicore interaction to access cache or system memory. At the same time, the idea of an additional utility RMMT differs much from the idea of RMMA. Let's have a look at RightMark Multi-Threaded Memory Test.  You can see that this application offers absolutely no information on a processor and a platform — this info is provided by RMMA. RMMT is interested only in a number of system processors — no matter physical or virtual. RMMT can help analyze memory behavior during single or shared memory access on traditional SMP systems (2 or more physical processors) as well as on Pentium 4 platforms with Hyper-Threading (2 logical processors), and certainly on modern dual-core processors (2 physical cores, each of which can contain 1 or 2 logical processors). Support for combo solutions is not out of the question either — for example, SMP systems with dual-core processors. The application chooses a number of threads to access memory by the number of "system processors". But the current version of this test cannot start more than 8 threads. General info (which has to do with all threads) is displayed in the All Threads section. It shows the total memory size, which is used by all threads (Memory, KB), and offers the following options: Lock Virtual Memory Pages — it locks virtual memory pages allocated by each thread, that is it prevents them from being pushed into a page file by the operating system. Set Threads Affinity to Cores — assigns threads to physical/logical processors. Both options are enabled by default. Information fields are located below: Total Time of a test. A new thread started adds its execution time to the total time. When two threads are started simultaneously, the total time will grow twice as fast. There is nothing strange about it — the same thing happens, when an operating system calculates total CPU time on multiprocessor platforms. Current BW shows the current total bandwidth - the sum of current bandwidth values of all threads. The "current" bandwidth means its "instant" value, this parameter being refreshed in this test each second by default. Average BW shows the total average bandwidth. Like "Current BW", this parameter is the sum of average bandwidth of each thread. The average bandwidth is the total number of bytes divided by the total test time). The test is controlled with the following buttons - Run All and Stop All. Their functions are evident — they start (with a precision of creation time and initiation of each thread) and stop (with a precision of termination and destruction of each thread) all test threads simultaneously. Operations with each thread are performed in sections Thread 0, Thread 1, etc — as we have already mentioned, their number equals the number of processors in your system, but it cannot exceed 8. The following options are available for each thread: Memory, KB — memory block size (from 1 KB to 1 MB). When you start a test, each thread allocates its own memory area. Moreover, when you enable "Set Threads Affinity to Cores", the memory is allocated in "its own" space, which may be useful, for example, for analyzing multiprocessor NUMA platforms. Operation — memory access type. Possible options:
Registers — CPU register type, which is used for reading/writing data. Available options: "64-bit MMX" (MOVQ reg, [mem]; MOVQ [mem], reg, and MOVNTQ [mem], reg) and "128-bit SSE2" (MOVDQA reg, [mem]; MOVDQA [mem], reg, and MOVNTDQ [mem], reg). PF Distance — software prefetch distance, bytes. It can take the following values — from 0 to 4096 bytes at 64 byte steps (prefetch instructions are placed in the reading test with software prefetch at the steps that equal the size of L2 Cache line in modern processors). This settings is relevant only for the "Read w/PF" mode. "Run Time", "Current BW", and "Average BW" indicators in the bottom half of the window are similar to those total parameters we reviewed above, so we are going to skip their descriptions. It's also obvious that the Start and Stop buttons for each thread allow to start and stop a given thread any time. Thus, RMMT allows to analyze single-threaded access to cache or memory (from any core) as well as simultaneous cache/memory access (arbitrary combination) from processor cores of physical or logical processors. Write a comment below. No registration needed!
|
Platform · Video · Multimedia · Mobile · Other || About us & Privacy policy · Twitter · Facebook Copyright © Byrds Research & Publishing, Ltd., 1997–2011. All rights reserved. |