|
||
|
||
| ||
|
||
|
||
| ||
We haven't paid attention to AMD K8 microarchitecture for a long time already, since the first article in this series over three and a half years ago. Strange as it may seem, the reason is very simple - all AMD K8 revisions (starting from new revisions of single-core processors and dual-core processors to the new AM2 platform with DDR2 memory) have had practically the same microarchitectural characteristics. Of course, we couldn't miss the new integrated DDR2 memory controller that replaced the DDR memory controller in dual-core processors (AM2 platform) with Core Revision F. But there has been no cause for a detailed analysis of modern AMD K8 processors up to now... if not for the results of our recent shootout of Athlon 64 X2 Energy Efficient processors and their "regular" counterparts. In this article the 65nm Athlon 64 X2 4800+ processor was significantly outperformed in most tests by its regular counterparts with equal or even lower model numbers. In order to understand what microarchitectural differences of energy efficient processors can provide such results, we decided to run a low-level comparison of a "regular" 90nm Athlon 64 X2 5200+ (Windsor core) and a 65nm Athlon 64 X2 4800+ EE (Brisbane core) in RightMark Memory Analyzer. Testbed configuration
Real Bandwidth of Data Cache/MemoryWe'll start with the tests of real L1/L2 D-Cache and RAM bandwidth. 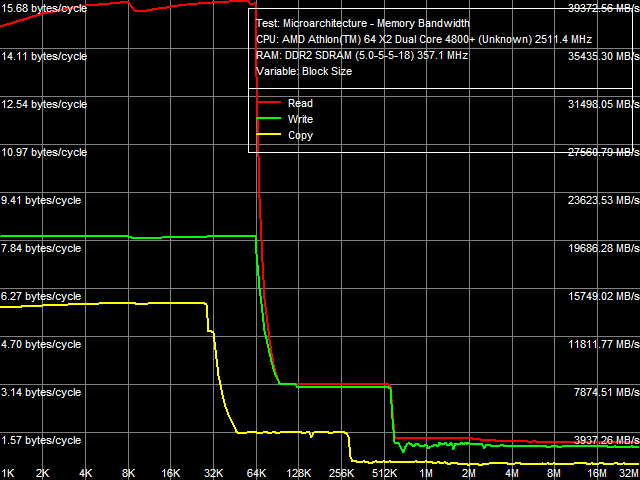 Picture 1. Average real throughput of Data Cache and RAM, Athlon 64 X2 EE Test results of the Athlon 64 X2 EE are shown in Picture 1. On the qualitative level, they are identical to the results of the Athlon 64 X2, except for L2 Cache size (1024 KB in Athlon 64 X2 versus 512 KB in Athlon 64 X2 EE). Table 1
Quantitative characteristics of real D-Cache/RAM bandwidth are published in Table 1. L1 D-Cache characteristics of both processors are identical in all cases (reading and writing data with MMX and SSE2 registers). Differences between the processors begin to appear in L2 Cache - the Athlon 64 X2 EE is outperformed here. It features lower real bandwidth both for reading (3.14 versus 4.10 bytes/cycle) and writing (3.06 versus 3.94 bytes/cycle) - lower by 23% in both cases. Athlon 64 X2 EE is also slower at addressing data in memory. Even if we take into account that the real memory bus frequency of the Athlon 64 X2 5200+ is approximately 371 MHz (theoretical bandwidth is 11.87 GB/s), while it's a tad lower in the Athlon 64 X2 4800+ EE - 357 MHz (theoretical bandwidth - 11.42 GB/s), relative memory bandwidth values of the latter are still lower. It's 27.5% for reading (versus 32.7%) and 24.5% for writing (versus 27.5%), which is 10-15% lower than the Athlon 64 X2 level. Maximum Real Memory BandwidthAs usual, maximum real memory bandwidth is reached owing to software prefetch for reading and non-temporal store for writing. Picture 2 shows results of these tests for the Athlon 64 X2 EE. On the qualitative level, they again match those of the Athlon 64 X2.  Picture 2. Maximum real memory bandwidth, Software Prefetch/Non-Temporal Store, Athlon 64 X2 EE Quantitative characteristics of these tests are published in Table 2. They are again worse in the EE modification of the processor. Relative maximum real memory bandwidth in this processor reaches 51.3% for reading (versus 65.9%) and 47.1% for writing (versus 60.8%), even taking into account the lower theoretical memory bus bandwidth. It's approximately 22% as low as the results obtained by the "regular" Athlon 64 X2. Lower values of maximum real memory bandwidth of the Athlon 64 X2 EE most likely have to do with lower real bandwidth of L2 D-Cache. It's also 23% as low as that of the Athlon 64 X2. Table 2
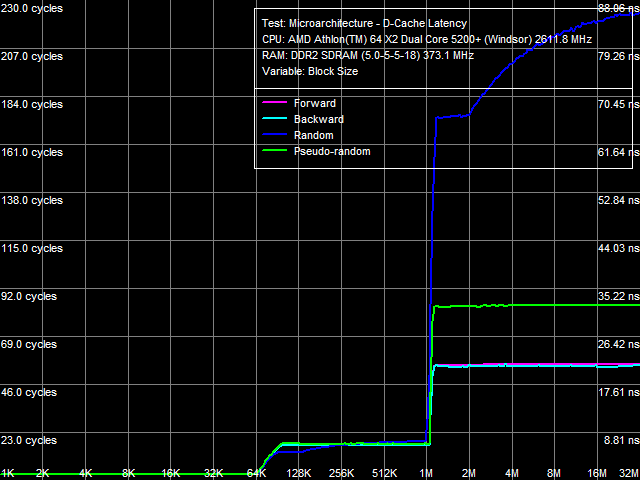
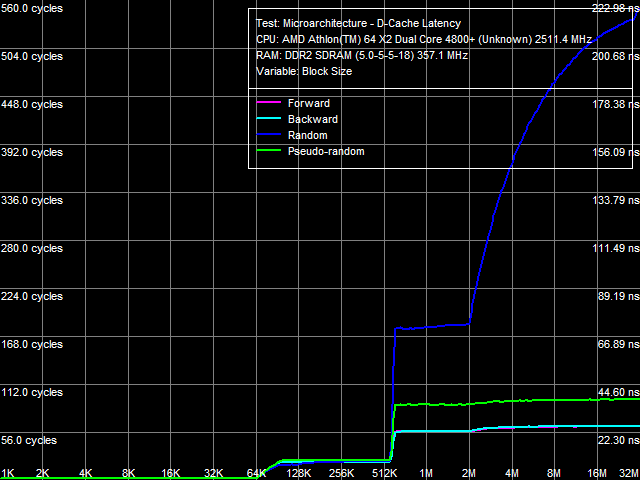
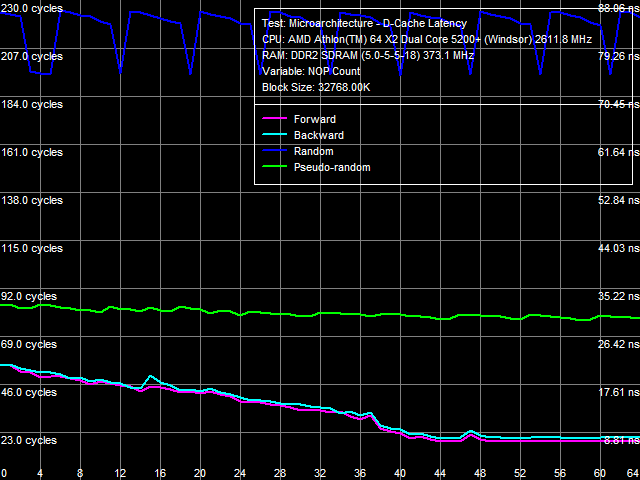
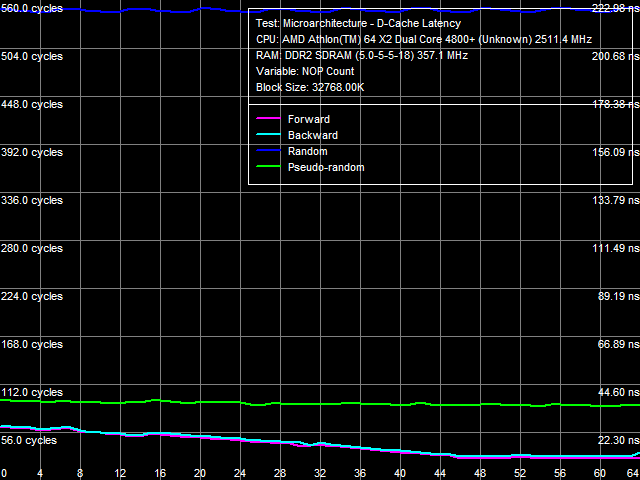
Average Latency of Data Cache/MemoryLet's proceed to L1/L2 D-Cache/RAM latencies, the results are published in Picture 3 (a, b).
a: Athlon 64 X2, b: Athlon 64 X2 EE The most noticeable qualitative difference between these processors is clearly visible in this test - a much steeper curve knee of the random-access latency at about 2 MB, and consequently a much higher random-access memory latency increase in the Athlon 64 X2 EE with data blocks larger than 2 MB. With standard 4 KB memory pages, this area corresponds to 512 memory pages, which matches the size of L2 D-TLB. It means that a D-TLB miss (that is completely depleted L2 size) results in significantly higher latencies in the Athlon 64 X2 EE (we'll also see it in TLB test results). Table 3
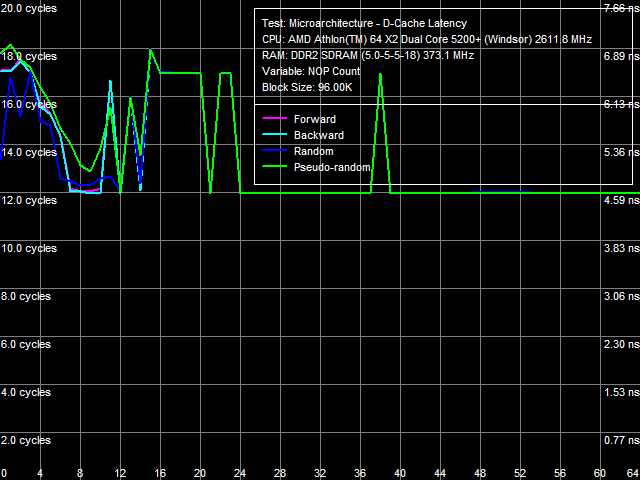
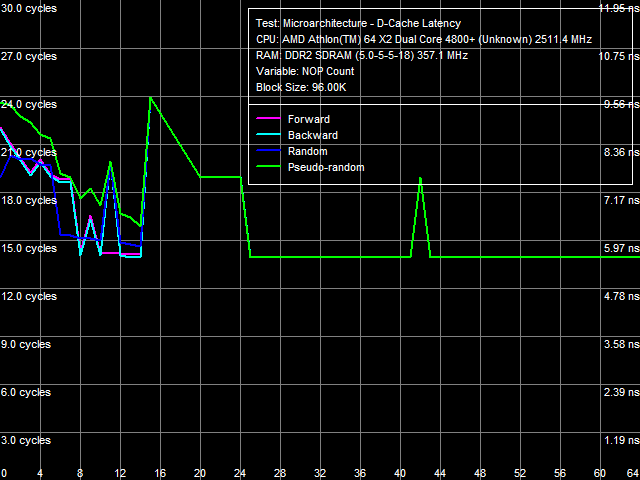
Quantitative latency results are published in Table 3. L1 D-Cache latency in all walk modes (forward, backward, pseudo-random, random) stays at 3 cycles (since the times of the first AMD K8 processors). But average latency of L2 D-Cache in the Athlon 64 X2 EE has grown from 17 cycles to approximately 22 cycles. Memory access latency has also grown, both with hardware prefetch (forward, backward walks) and without it (random walk). It has grown approximately by 18% in both cases, which cannot be explained only with the lower memory bus clock of the Athlon 64 X2 EE (357 MHz versus 371 MHz, that is just 4%). As in case with the real memory bandwidth, it probably has to do with lower efficiency (lower bandwidth and increased latency) of L2 D-Cache. We've already written about a much higher random memory access latency (219.5 ns versus 86.0 ns) - it has to do with significant D-TLB miss penalties. Minimal Latency of L2 D-Cache/MemoryLet's evaluate the minimal possible L2 D-Cache latency, when the L1-L2 bus is offloaded by inserting a variable number of empty operations between neighboring L2 Cache access operations. Results of this test for both processors are published in Picture 4 (a, b).
a: Athlon 64 X2, b: Athlon 64 X2 EE The offload picture obtained with the Athlon 64 X2 (Picture 4a) looks usual for AMD K8. What concerns the energy efficient processor (Picture 4b), it's different. Quantitative values of the minimal L2 Cache latency are also different - they are published in Table 4. It's 12 cycles for the Athlon 64 X2, while the minimal latency of L2 Cache in the Athlon 64 X2 EE is 14 cycles. Minimal memory access latency is evaluated in a similar way, but this test uses a much larger block size (32 MB). Results of this test are shown in Picture 5 (a, b).
a: Athlon 64 X2, b: Athlon 64 X2 EE On the qualitative level, the result of the Athlon 64 X2 EE (Picture 5b) differs the most from that of the Athlon 64 X2 (Picture 5a) - it has a much higher random access latency (we've already seen it above), and L2-RAM bus offloading does not reduce it much - the corresponding curve remains practically even. Table 4
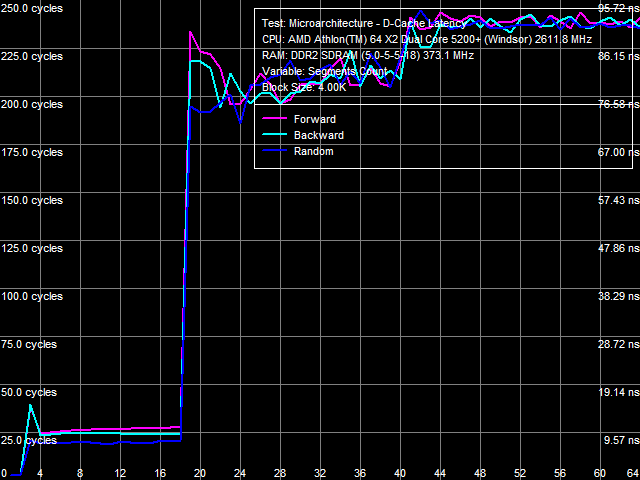
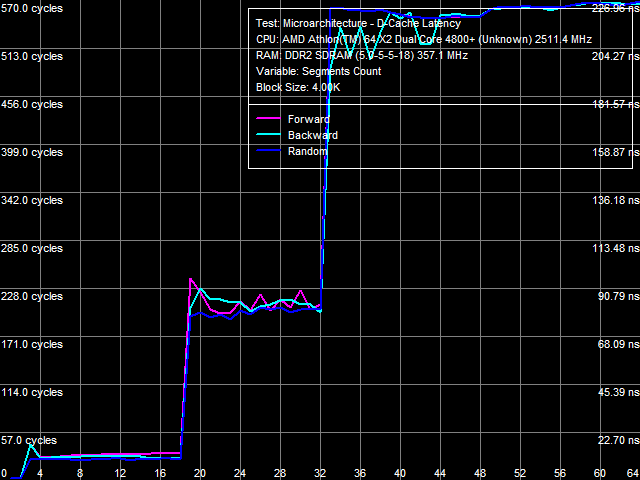
Numeric test results are published in Table 4. Just like the average memory latency, minimal RAM latency of the Athlon 64 X2 EE is higher than that of the Athlon 64 X2 in all modes. Data Cache Associativity
a: Athlon 64 X2, b: Athlon 64 X2 EE Curves obtained in the D-Cache associativity test of the Athlon 64 X2 (Picture 6a) and Athlon 64 X2 EE (Picture 6b) are different. In both cases the curves show bends at 2 and 18 cache segments, which correspond to L1 D-Cache associativity and common associativity of exclusive L1/L2 D-Caches (2+16). At the same time, the Athlon 64 X2 EE also has a significant bend at 32 segments, which we cannot explain. Real L1-L2 Cache Bus BandwidthL1-L2 D-Cache real bandwidth test results of the Athlon 64 X2 EE are published in Picture 7. They resemble those of the Athlon 64 X2.  Picture 7. Real L1-L2 Cache bus bandwidth, Athlon 64 X2 EE Numeric results of this test are published in Table 5. Considering lower L2 Cache performance characteristics of the Athlon 64 X2 EE obtained in the previous tests (lower bandwidth, higher latency), the real bandwidth of the L1-L2 bus in this processor is naturally lower than in its "regular" 90nm counterpart. In relative terms, it's approximately 21-25% as low, which agrees well with the above test results. Table 5 contains test results in bytes/cycle as well as in GB/s for a reason - these values show well the bottleneck of the processor, which we detected in our tests of the integrated DDR2 memory controller. Indeed, the bottleneck is in the L1-L2 D-Cache bus, which bandwidth is just 12 GB/s even with the "regular" Athlon 64 X2 5200+. This is already smaller than the theoretical memory bandwidth of dual-channel DDR2-800 (12.8 GB/s). Athlon 64 X2 4800+ EE has even lower bandwidth of the L1-L2 bus - approximately 9 GB/s, which is lower even than the bandwidth of dual-channel DDR2-667 (10.6 GB/s). Table 5
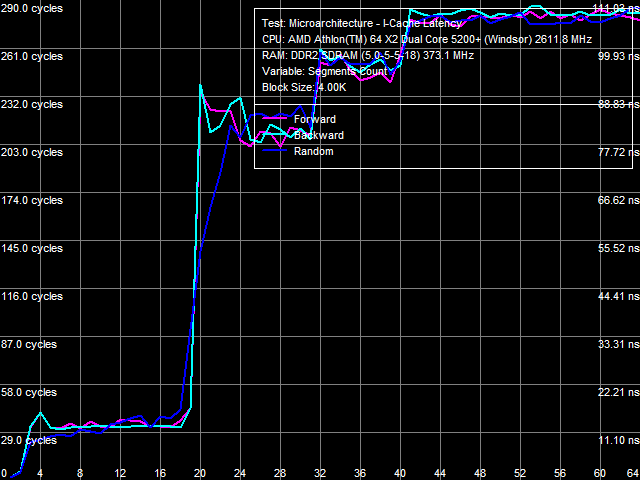
We've also run the data arrival test for the L1-L2 bus. Results are shown in Picture 8. It looks similar to the test results of various AMD K8 processors, meaning that organization of the L1-L2 D-Cache bus hasn't changed in the Athlon 64 X2 EE - it's still a 64 bit bidirectional data bus. 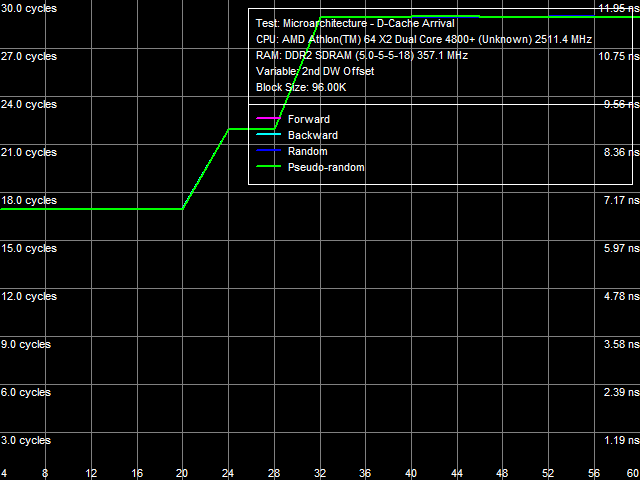 Picture 8. Data arrival test on L1-L2 Cache bus, Athlon 64 X2 EE I-Cache, Decode/Execute EfficiencyPicture 9 shows results of testing I-Cache size and efficiency of decoding/executing 6-byte instructions like cmp eax, 00000000h on the Athlon 64 X2 EE. Quantitative characteristics of decoding/executing other instructions from L1 I-Cache and Shared L2 Cache are published in Table 6. 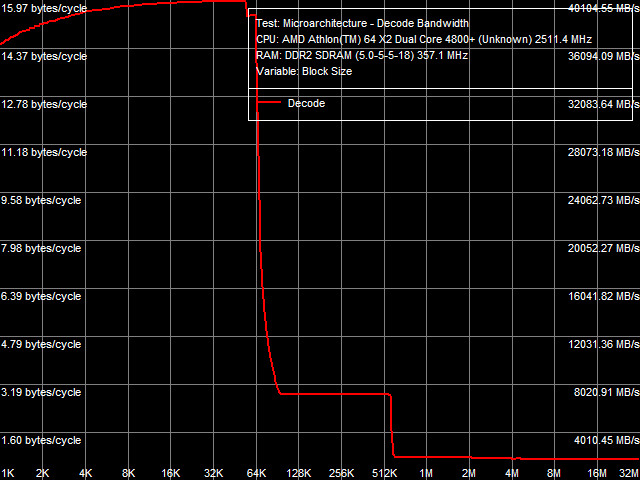 Picture 9. Decode/execute efficiency of 6-byte CMP instructions, Athlon 64 X2 EE Table 6
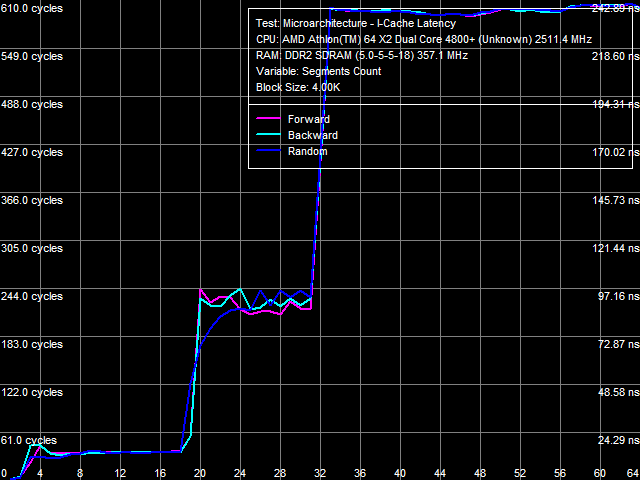
Efficiency of decoding/executing various simple ALUs from L1 I-Cache hasn't changed in the energy efficient processor. It means that its execution units are the same (at least, integer ones). This is also confirmed by results of various synthetic tests, which are practically insensitive to the size and performance of L2 Cache and memory. At the same time, efficiency of executing code in L2 Cache of the Athlon 64 X2 EE is lower already with 1-byte NOP instructions. It's limited to approximately 2.90 bytes/cycle (versus 3.28 bytes/cycle in the Athlon 64 X2) in all cases. That's another proof of reduced speed characteristics of L2 Cache. I-Cache AssociativityResults of the I-Cache associativity test of the Athlon 64 X2 (Picture 10a) and Athlon 64 X2 EE (Picture 10b) match those of D-Cache associativity test. L1 I-Cache associativity is 2. Shared L2 Cache - 16 (there is a bend at 18 segments, which corresponds to the total associativity of L1 and L2 Caches); Athlon 64 X2 EE curves (Picture 10b) also demonstrate an additional bend at 32 cache segments.
a: Athlon 64 X2, b: Athlon 64 X2 EE TLB CharacteristicsAnd finally, we are going to evaluate characteristics of buffers that translate physical addresses into virtual ones, D-TLB (for data) and I-TLB (for instructions).
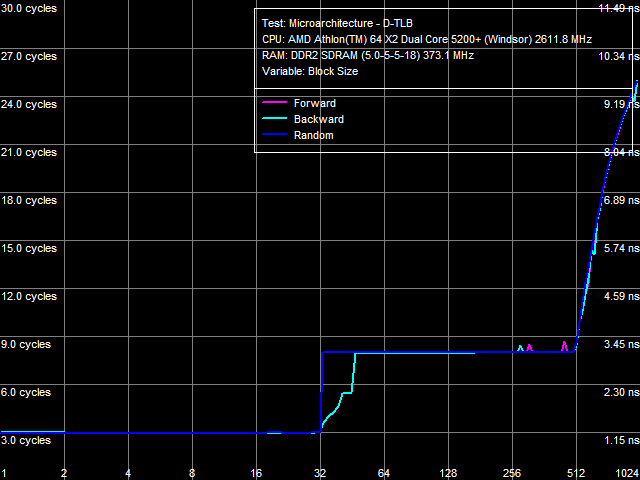
a: Athlon 64 X2, b: Athlon 64 X2 EE Picture 11(a, b) shows D-TLB size test results of the Athlon 64 X2 and Athlon 64 X2 EE. D-TLB sizes match in both cases (32 pages for L1 D-TLB and 512 pages for L2 D-TLB), L1 D-TLB miss penalty is five cycles. Principal differences between the processors are demonstrated when L2 D-TLB misses. The penalty for such a miss is approximately 17 cycles for the Athlon 64 X2, and it's over 270 cycles for the Athlon 64 X2 EE. 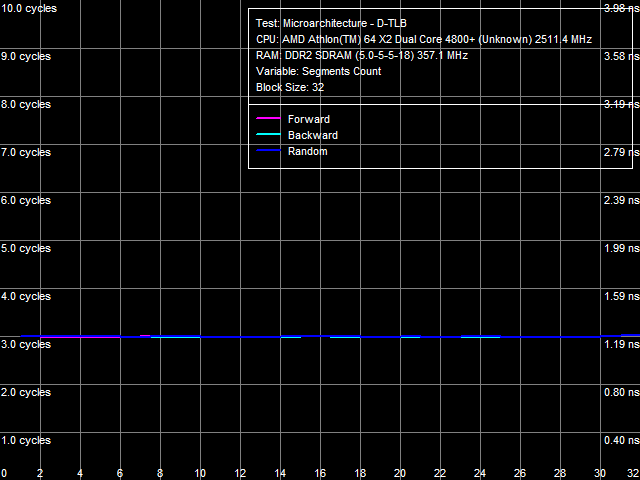 Picture 12. L1 D-TLB Associativity, Athlon 64 X2 EE 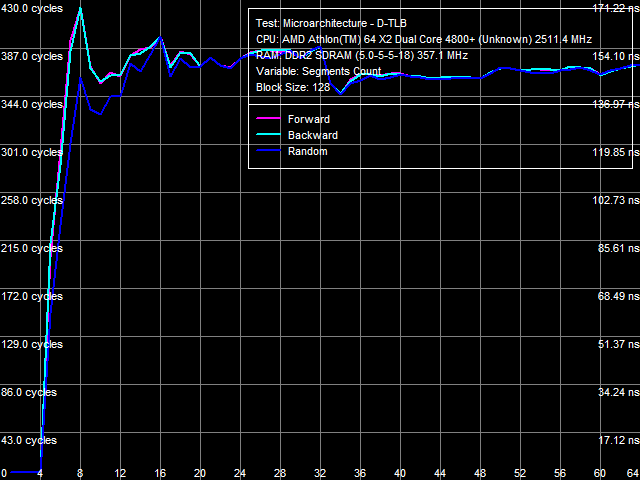 Picture 13. L2 D-TLB Associativity, Athlon 64 X2 EE L1 and L2 D-TLB associativity tests of the Athlon 64 X2 EE are published in Pictures 12 and 13. L1 D-TLB has full associativity. Associativity of L2 D-TLB equals 4. An L2 D-TLB miss penalty is 350-380 cycles - as expensive as its size miss.
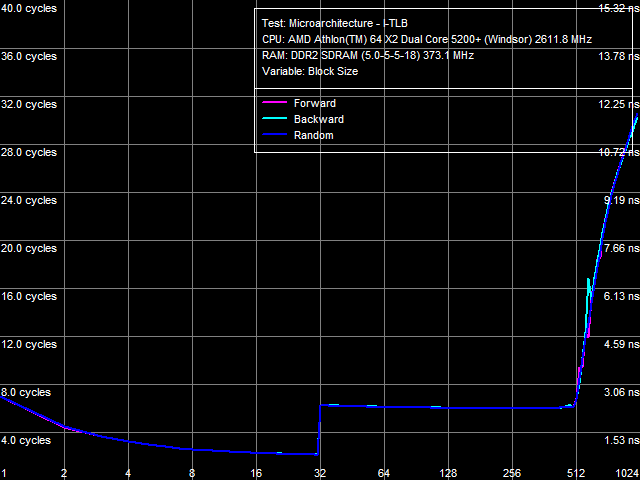
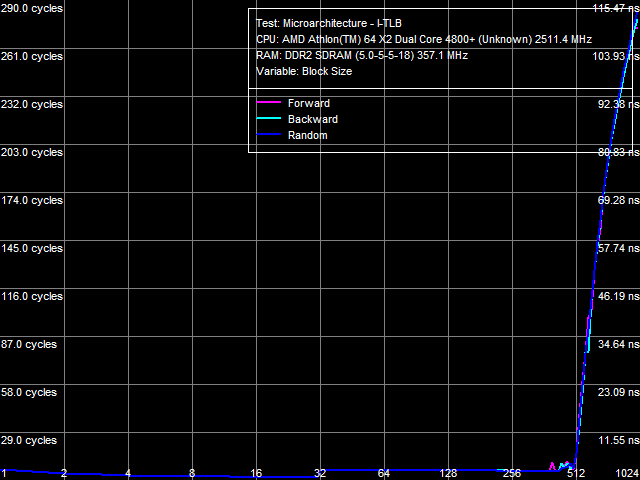
a: Athlon 64 X2, b: Athlon 64 X2 EE I-TLB size test results are shown in Picture 14(a, b). They don't reveal differences between L1 and L2 I-TLB sizes of our processors (32 and 512 pages correspondingly), as well as between L1 I-TLB miss penalties (4 cycles). However, they again show significant differences in L2 I-TLB miss penalties - approximately 24 cycles for the Athlon 64 X2 and over 270 cycles for the Athlon 64 X2 EE. 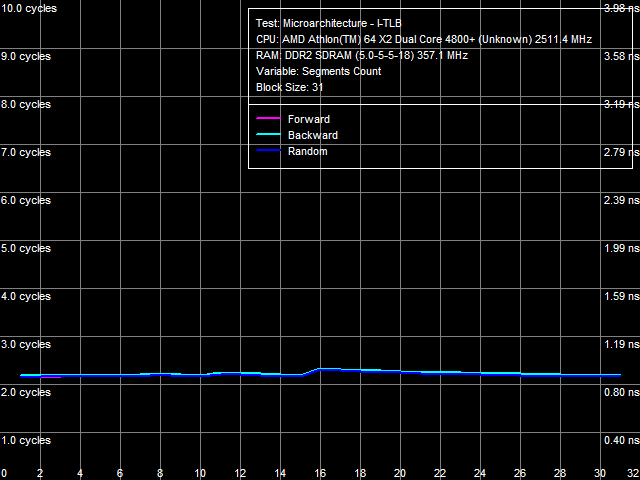 Picture 15. L1 I-TLB Associativity, Athlon 64 X2 EE 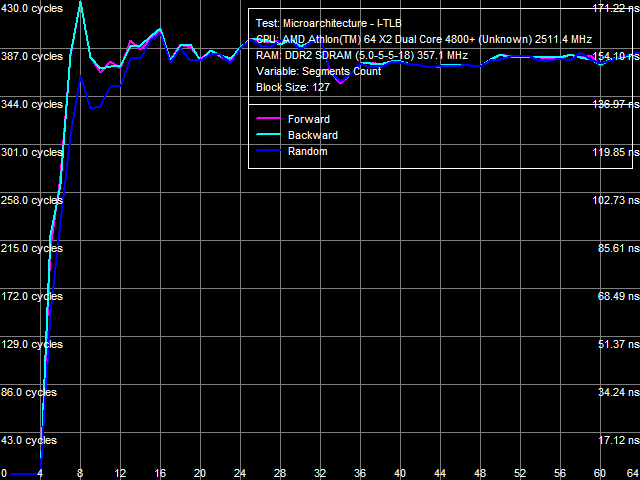 Picture 16. L2 I-TLB Associativity, Athlon 64 X2 EE Results of the L1/L2 I-TLB associativity tests of the Athlon 64 X2 EE (Pictures 15 and 16) are also similar to results of the corresponding D-TLB tests. L1 I-TLB has full associativity. Associativity of L2 I-TLB equals 4. L2 I-TLB associativity miss costs 350-380 cycles. ConclusionResults of our low-level comparative analysis of a "regular" AMD AM2 processor (Athlon 64 X2 5200+) and its Energy Efficient modification (Athlon 64 X2 4800+ EE) show that microarchitectural differences between these processors really exist. The 65nm Athlon 64 X2 EE processors are the first products from AMD that are really different on the core level from all previous AMD K8 solutions. Our tests revealed only two major differences between the new energy efficient processors and their regular counterparts. But these differences are so great that the new processors are easily outperformed in real applications by the old ones. The first difference is speed characteristics of L2 Cache (L2 Cache bandwidth for data access and execution, L1-L2 D-Cache bus bandwidth, L2 Cache latency) - they are approximately 25% as low as characteristics of L2 Cache in the Athlon 64 X2. If we also take into account that L1-L2 D-Cache bus in the AMD AM2 platform is still a bottleneck for accessing data from memory, you'll understand why these energy efficient processors feature a similar decrease in memory performance, while retaining characteristics of the integrated memory controller. The second difference consists in expensive miss penalties of L2 D-TLB and L2 I-TLB. First of all, it leads to significantly increased random memory access latencies (from usual 70-80 ns to over 200 ns). It especially affects performance of applications that work with lots of data in random order (for example, databases). Thus, AMD and these energy efficient processors just prove that you cannot get something from nothing. That is you cannot reduce power consumption and retain performance on the same level as far as the same microarchitecture is concerned. Our analysis shows that the company decided to sacrifice L2 Cache performance to reduce power consumption (this element takes up a considerable part of the die). This solution looks reasonable. At least, it's much simpler and more practical than, for example, overhauling execution units of a processor. Dmitri Besedin (dmitri_b@ixbt.com) October 15, 2007 Write a comment below. No registration needed!
|
| ||||||||||||||||||||||||||||||||||||||||||||||||||||||||||||||||||||||||||||||||||||||||||||||||||||||||||||||||||||||||||||||||
Platform · Video · Multimedia · Mobile · Other || About us & Privacy policy · Twitter · Facebook
Copyright © Byrds Research & Publishing, Ltd., 1997–2011. All rights reserved.