Main Prerequisites
CPU test procedure is evidently intended to evaluate performance of modern x86(-64) CPUs and to draw certain conclusions from the obtained results. In this case, it's based on the following assumptions:
- Mean performance of the above mentioned processors can be determined experimentally
- It can be determined, if performance of these processors is measured in identical conditions with the same set of tests
- It's a geometric mean of all test results obtained with the same weight numbers.
- it's computed using only results of those tests that were carried out according to this test procedure. Thus, it's an objective (based on objective test results) and subjective value at the same time (based on results of selected tests).
The English of this is as follows:
- Our procedure for testing performance of x86(-64) processors is based on tests that were selected by us for our test procedure. Thus, we make it impossible to compare our results and conclusions with those based on other test procedures.
- Our test procedure is based on the principle that any result obtained in a test is equipollent to any other result. There are no weight numbers — all results, no matter how many, are equipollent.
- Ideally, test conditions should be absolutely identical. If it's not the case, they must be as identical as possible. It's up to our testlab to find out how possible it really is and what variant is maximum close to the ideal case.
Common Part
Software
- Windows XP Professional x64 edition SP1
- All patches and updates to this operating system available on January 1, 2007
- Hardware drivers released by January 1, 2007 (if available at this moment, otherwise we use the first releases)
- BIOS versions released by January 1, 2007 (if available at this moment, otherwise we use the first releases)
- Program and benchmark versions are specified below.
Hardware
Invariable (for desktop procedure):
- Hard drive: Samsung SP1614C
- SATA controller: Promise SATAII150 TX2plus
- DDR-400 memory: Corsair CMX1024-3500LLPRO
- DDR2-800 memory: Corsair CM2X1024-6400
- Video card: Gigabyte GeForce 7800GTX 256 MB
- AC power adapter: Chieftec GPS-550AB A
Variable (for desktop procedure):
- Motherboard: the best choice for a CPU under review
- Cooler: bundled (preferably), or recommended (certified) by manufacturer, or our choice (if the first or the second options are not available).
Notes about Using this Test Procedure
for Non-Desktop Computers
Of course, this test procedure may also be used for devices, which do not allow to use "invariable" components (for example, notebooks or ready systems). Results obtained can even be used for comparisons to some degree. But out of doubt, scores obtained in this way cannot be used for comparative tests of processors. They will be just comparisons of ready-made systems, more or less suited for CPU performance analysis.
Tests
3D Modeling and Rendering

Software class: professional.
Test conditions: desktop resolution — 1280×1024×32@75, Direct 3D API.
Benchmark description: it's a script that imitates user operations in this program.
Results: separate scores for interactive operation and rendering speed.
Load type: mostly processor, 3D accelerator, to a lesser extent — memory.
SMP optimization: only rendering, judging by test results.

Software class: professional.
Test conditions: desktop resolution — 1280×1024×32@75, OpenGL API.
Benchmark description: it's a script that imitates user operations in this program.
Additional benchmark: rendering a static scene.
Results: GFX, I/O, CPU scores, total score, rendering time.
Load type: mostly processor, 3D accelerator, to a lesser extent — memory.
SMP optimization: only rendering, judging by test results.

Software class: professional.
Test conditions: desktop resolution — 1280×1024×32@75.
Benchmark description: rendering a static scene.
Results: rendering time.
Load type: mostly processor.
SMP optimization: only rendering, judging by test results.
CAD/CAE
Main software: MATLAB R2006a (7.2.0.232) x64 edition
Benchmark: built-in

Software class: professional.
Test conditions: desktop resolution — 1280×1024×32@75.
Benchmark description: computing various functions: LU, FFT, ODE, Sparse, 2D, 3D.
Results: execution time of each function (see above).
Load type: mostly processor.
SMP optimization: not detected.

Software class: professional.
Test conditions: desktop resolution — 1280×1024×32@75, OpenGL API.
Benchmark description: it's a script that imitates user operations in this program.
Results: multiple, we take only the total score into account.
Load type: processor, 3D accelerator, memory, hard drive (a little).
SMP optimization: not detected.

Software class: professional.
Test conditions: desktop resolution — 1280×1024×32@75, OpenGL API.
Benchmark description: it's a script that imitates user operations in this program.
Results: multiple, we take only the total score into account.
Load type: processor, 3D accelerator, memory, hard drive (a little).
SMP optimization: not detected.
Bitmap Graphics

Software class: professional, sometimes used by amateurs.
Test conditions: desktop resolution — 1280×1024×32@75.
Benchmark description: it's a script that uses the most frequent operations and lots of filters.
Results: execution time of commands by groups, total execution time.
Load type: processor, memory, hard drive (a little).
SMP optimization: some parts (some operations, some filters).
Compile

Software class: professional, sometimes used by amateurs.
Test conditions: desktop resolution — 1280×1024×32@75.
Benchmark description: compiling a large project (final build).
Results: compilation time.
Load type: processor, memory, hard drive (a little).
SMP optimization: available (according to the developer).
Web server
Main software: Apache HTTP Server 2.2.4 for Windows
Benchmark: built-in benchmark + 3 load files

Software class: professional, sometimes used by amateurs.
Test conditions: desktop resolution — 1280×1024×32@75.
Benchmark description: generating a specified server load type.
Results: a number of processed queries per second (small, average, large file).
Load type: processor, memory.
SMP optimization: excellent.
Synthetic and semi-synthetic benchmarks
Main software: CPU RightMark 2005 Lite (1.3) x64 edition
Benchmark: built-in

Software class: specially developed for benchmarking.
Test conditions: desktop resolution — 1280×1024×32@75.
Benchmark description: computing a physical model and rendering it in real time.
Results: frames per second — computed, rendered, total.
Load type: processor.
SMP optimization: excellent.
Archiving
Main software: WinRAR 3.62
Benchmark: archiving a set of files (BMP+DBF+DLL+DOC+PDF+TXT)

Software class: universal.
Test conditions: desktop resolution — 1280×1024×32@75.
Benchmark description: archiving files of popular formats.
Results: archiving time.
Load type: processor, memory (almost in equal parts).
SMP optimization: available.
Main software: 7-Zip 4.42 x64 edition
Benchmark: archiving a set of files (BMP+DBF+DLL+DOC+PDF+TXT)

Software class: universal.
Test conditions: desktop resolution — 1280×1024×32@75.
Benchmark description: archiving files of popular formats.
Results: archiving time.
Load type: processor, memory (almost in equal parts).
SMP optimization: available.
OCR

Software class: amateur, office.
Test conditions: desktop resolution — 1280×1024×32@75.
Benchmark description: converting a multi-page PDF document into plain text.
Results: conversion time.
Load type: processor, memory.
SMP optimization: the program has it, but it's not used in this mode.
Audio Encoding
Main software: LAME 3.97, Monkey Audio 4.01, OGG Encoder 2.83,
Windows Media Encoder 9 x64 edition
Benchmark: encoding a WAV image of the Jacques Loussier Trio disc
"The Best of Play Bach"

Software class: amateur
Test conditions: desktop resolution — 1280×1024×32@75.
Benchmark description: encoding a WAV source with the above mentioned codecs.
Results: encoding time for each codec.
Load type: processor (mostly), memory (to a lesser degree).
SMP optimization: only in Windows Media Encoder 9.
Video Encoding

Software class: semi-professional and amateur.
Test conditions: desktop resolution — 1280×1024×32@75.
Benchmark description: encoding files with the above mentioned codecs into MPEG2 and MPEG4.
Results: encoding time for each codec.
Load type: processor (mostly), memory (to a lesser degree).
SMP optimization: not available in XviD, the best in Canopus ProCoder.
3D Games
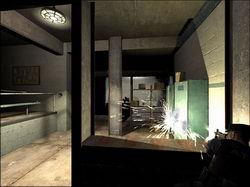


Software class: amateur.
Test conditions: full screen resolutions from 800×600(×32@75) to 1280×1024+AA.
Benchmark description: imitating the real gaming process (with some reservations).
Results: mean fps.
Load type: 3D accelerator (mostly), processor and memory (to a lesser degree).
SMP optimization: in HL-2 and F.E.A.R. — not available.
Measurements that have nothing to do with performance
Evaluating Approximate Power Consumption of a Processor

Test conditions: fully loaded and completely idle.
Benchmark description: measuring power consumption of a processor.
Results: power consumption of a CPU under maximum load and in idle mode.
Load type: processor.
As such tests are new for our testlab, we decided to include a detailed description of the procedure. In this case, our power consumption measurement is based on Ohm's law, namely I=dU/R (1). In our case, strength of current (I), necessary to calculate power consumption, is obtained by measuring a voltage drop (dU) at the instrument shunt with the (R) 0.025 Ohm resistance. Then, the obtained value is inserted into formula (1) to get the strength of current in amperes. After that, we use one of the oldest formulas of electrical engineering, namely P=UI, to get power consumption at ATX12V. In our case, a voltage drop at the shunt (dU) is measured with a multimeter on the right of the photo, and the effective voltage in the circuit (U) – with a multimeter on the left. Voltages are measured with digital TRMS multimeters UT60E.
An evident shortcoming of this procedure is that it measures not CPU power consumption, but power consumption of VRM that powers CPU. Initially, we proceed from the reasonable, but not proved assumption that VRM is powered by ATX12V only. In its turn, ATX12V is used to power only VRM of a processor (it can be proved only by the schematic diagram of a motherboard under review, which is impossible in most cases). We decided to give this method a try and to accumulate statistics (which may become an empiric proof whether our assumptions are right or wrong), even though we are not sure it's 100% correct in all cases. But our readers should not forget what was mentioned above: we can call results obtained by this test procedure "approximate power consumption of a processor" only with a lot of reservations.
Summary table of tests grouped by load types
| |
processor |
memory |
video card |
HDD |
| 3ds Max |
+ |
~ |
+ |
- |
| Maya |
+ |
~ |
+ |
- |
| Lightwave |
+ |
- |
- |
- |
| MATLAB |
+ |
- |
- |
- |
| Pro/ENGINEER |
+ |
+ |
+ |
~ |
| SolidWorks |
+ |
+ |
+ |
~ |
| Photoshop |
+ |
+ |
- |
~ |
| Visual Studio |
+ |
+ |
- |
~ |
| Apache |
+ |
+ |
- |
- |
| CPU RightMark |
+ |
- |
- |
- |
| WinRAR |
+ |
+ |
- |
- |
| 7-Zip |
+ |
+ |
- |
- |
| FineReader |
+ |
+ |
- |
- |
| Audio encoding |
+ |
- |
- |
- |
| Video encoding |
+ |
~ |
- |
- |
| Games |
+ |
~ |
+ |
- |
Calculating Total Scores
and Cumulative Scores
Scores (published in the diagrams) are calculated by the following rules:
- Any result, which is the smaller the better, is converted into the-more-the-better format by the formula 1/X, where X is our result
- A result equivalent to 100 points for each test is the result of testing Intel Core 2 Duo 4300 in predefined conditions
- All test results are expressed in points, directly proportionally to the result of Intel Core 2 Duo 4300
- All results of tests, which belong to a subgroup, are "geo meaned" into a common score (N-fold root of the product of N results)
- Conventional "professional" score is given to test results in the following applications and application groups: 3ds Max, Maya, Lightwave, MATLAB, Pro/ENGINEER, SolidWorks, Photoshop, Visual Studio, Apache, CPU RightMark
- Conventional "amateur" score is given to test results in the following applications and application groups: WinRAR, 7-Zip, FineReader, Audio encoding, Video Encoding, Games
- Conventional "common" score is given to test results in all applications and application groups.
Drawing Common Conclusions
From Test Results
The scores obtained will be used to draw conclusions as to what processor is faster and what model is slower according to our test procedure. We guarantee within the above conclusions that...
- All tests were carried out in accord with the above conditions (additional options omitted here are not a secret, you can get them at your request)
- You can get similar results (to within measurement error) with the same software and hardware, with all options mentioned above
- All conventional scores were calculated by the above mentioned rules, they are correct and can be reproduced by other people (in case of identical source data).
Proceeding from the above said, we reserve the right to take any legal measures against those who discredit our results and conclusions, unless these actions are well reasoned. That is if you don't like this test procedure, criticize it. But if you don't like the results, it's your problem.
Write a comment below. No registration needed!

