 |
||
|
||
| ||
IntroductionHistorically, desktop computers have been the primary application for hard disc storage devices. However the market for disc drives in consumer electronic devices is growing rapidly. This paper pre-sents a method for estimating drive reliability in desktop computers and consumer electronics devices, using the results of Seagate's standard laboratory tests. DefinitionsSeagate estimates the mean time between failures (MTBF) for a drive as the number of power-on hours (POH) per year divided by the first-year annualized failure rate (AFR). This is a suitable approximation for small failure rates, and we intend it to represent a "first year" MTBF. The annualized failure rate for a drive is derived from time-to-fail data collected during a reliability-demonstration test (RDT). Factory reliability-demonstration tests (FRDT) are similar, but are performed on drives pulled from the volume production line. For the purposes of this paper, we assume that any concept that applies to an RDT also applies to an FRDT. Seagate reliability testsAt Seagate Personal Storage Group in Longmont, Colorado, desktop disc drive reliability tests are normally conducted in ovens at 42 C ambient temperature to provide accelerated failure rates. In addition, the drives are operated at the highest possible duty cycle (a drive's duty cycle is defined by the number of seeks, reads, and writes it performs over a specific time period). We do this to discover as many failure modes as possible during the product development cycle. By fixing any problems we may see at this stage, we can make sure that our customers won't see the same problems. Estimating Weibull parametersLet's assume we have an RDT with 500 drives, all run for 672 hours at 42 C ambient temperature. During this test, further assume that we observe three failures (at 12, 133 and 232 hours). This means that, of the 500 drives tested, 497 ran the entire test without failing. To analyze and extrapolate from the test results, we perform Weibull modeling using SuperSmith software from Fulton Findings(*1). Specifically, we use the Maximum Likelihood method to estimate the Weibull-distribution parameters Beta (a shape parameter) and Eta (a scale parameter). (A priory it is assumed that failures are distributed according to Weibull. Here is the probability density formula for this distribution: 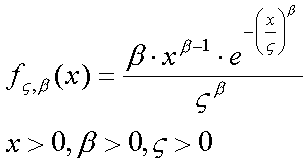 The tests are intended for estimation of distribution parameters. It is assumed that with the given Beta Eta is equal to time (in hours) when 90% of tested drives fall out of action. (Discussion of this mathematical model requires deep knowledge of mathematical statistics and is beyond this article, that is why we suggest to take it as a fact) - the editor's note). In tests with five or fewer failures, the Beta parameter cannot be not well defined by the test data. Since such cases are common in drive testing, we analyze the data using a WeiBayes(*2) approach. This approach requires that we estimate the Beta parameter using historical data. In the desktop-products lab, we are currently assuming that Beta = 0.55. This value is based on the manufacturing data shown in the following table, which includes all desktop products tested prior to March 1999.
The graph below shows the results of both the Weibull and WeiBayes analysis. The solid line in the figure below shows Weibull Beta and Eta parameters (Beta = 0.443, Eta = 69331860) estimated using the Maximum Likelihood(*3) (MLE) approach on only 3 failures out of 500 drives. As mentioned before, these results are considered less accurate than those of the WeiBayes method for small failure rates. The results of the WeiBayes method (with Beta = 0.55) are shown as a dashed line in the figure below. Since 672 test hours at 42 C should be a sufficiently long run time for an RDT, we use our internal "test exit confidence level"(*4) of 63.2% for the WeiBayes analysis. The WeiBayes calculations indicate that, at 42 C, given a historical Beta = 0.55, a reasonable value for Eta is 3,787,073 hours. 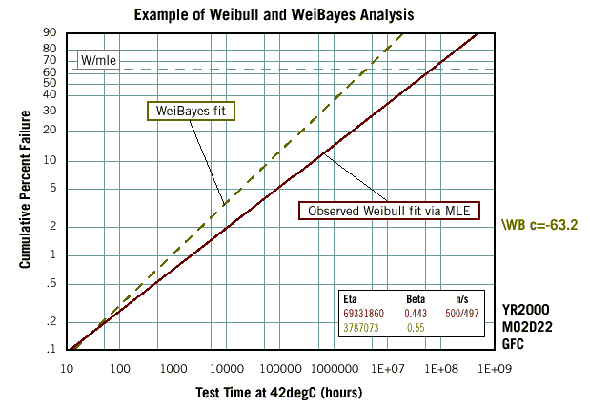 Legend to the firure "Example of Weibull and WeiBayes Analyses" W/mle = test exit confidence level
The next step in the analysis is to convert the value for Eta that was based on tests at 42 C to a value that reflects our specified operational temperature (25 C). Using the Arrhenius Model(*5), an acceleration factor of 2.2208 can be used to account for this difference in temperature. Therefore, the value for Eta at 25 C (Eta25) is assumed to be equal to the value for Eta at 42 C (Eta42) times 2.2208, or 8,410,332 hours. Applying the estimated Weibull parameters to estimate first-year MTBFUsing the temperature-adjusted estimated values of the Weibull Beta and Eta parameters, we can calculate the cumulative-percent-failure rate at any time. By subtracting the cumulative-percent-failure rates for two different times (t1 and t2), and using appropriate values for Beta and Eta25, we can estimate the percent of drives that are likely to fail at 25 C during any time interval t1 to t2. To estimate the AFR for the first year of drive operation in a desktop computer setting, we assume that the drive is used at a rate of 2,400 power-on-hours (POH) per customer year. In addition, we assume that drives are subjected to a 24-POH integration period by the device manufacturer. Since any drives that fail during this period are returned to Seagate and are not shipped to the end-user, they are not counted in the first year AFR and MTBF. Based on these assumptions (100% duty cycle, Eta25 = 8,410,332 hours, Beta = 0.55, and 2,400 POH/year) the percent failure rate in the first customer year can be calculated as the percent failure rate between 24 hours (t1) and 2,424 hours (t2). The results of this calculation are shown in the table below, which derives a first year MTBF from the RDT data.
(P(failures) are calculated on the basis of the Weibull distribution - see figure. Further it is clear: First-year MTBF = POH/year / first-year AFR - editor's note). Accounting for actual user conditionsThe calculations above suggest that if a customer were to use our drive at 25 C and 2,400 POH/yr, the expected customer MTBF in the first year would be 232,140. However, these conditions may not always apply to the consumer electronics environment. For example, in some consumer devices, the drive may be powered on almost 100% of the time and yearly usage rates may be much higher than 2,400 POH. In other devices, such as video game players, the POH/yr might be relatively low. The following section describes how we can adjust the calculated MTBF so that it applies to various usage levels, duty cycles and ambient temperatures. Usage levelsTo account for variation in MTBF due to different levels of usage, we may use the MTBF adjustment curve. 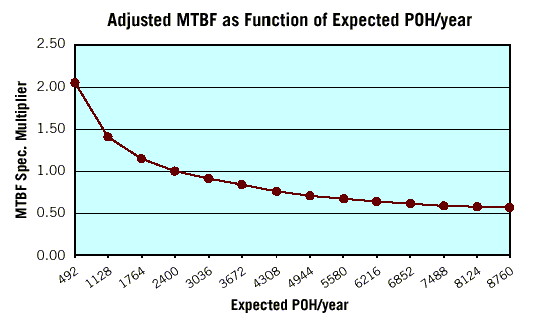 For example, to adjust an MTBF from 2,400 POH/yr to a maximum usage rate of 8,760 POH/yr, the MTBF would be reduced by about half. Conversely, for low usage environments, as in some video games, the MTBF might be increased by as much as a factor of two. TemperatureNext let's look at the effects of elevated operating temperature. The same Arrhenius Model that we used to develop an acceleration factor may also be used to generate an MTBF temperature derating-factor (DF) curve. The following table shows the decrease in first-year MTBF (at 100% duty cycle) as ambient temperature increases above 25 C.
From the table above, it is clear that as the ambient temperature rises, the derating factor and the adjusted MTBF become significantly smaller. For example, at 42 C, we find the 2.2208 acceleration factor referred to previously in this analysis. Its reciprocal, 0.45, is the DF value, which indicates that the MTBF at 42 C is less than half as long as the MTBF at 25 C. Duty cycleMost disc drives in PCs are operated at duty cycles of 20% to 30%. However, consumer electronics devices may have lower or higher duty cycles. Seagate has measured average daily data transfer rates on existing consumer electronics devices and found duty cycles as low as 2.5%. To compare the effect of a 2.5% duty cycle with that of a 100% duty cycle (used in RTD testing), we can examine the effect of duty-cycle-dependent components in the drive relative to other components. The number of duty-cycle-dependent components in a hard disc drive is proportional to the number of discs in the drive. The relationship between disc count and AFR is shown in the following figure. In this graph, the area below the dotted line indicates the "base" or nonduty-cycle-dependent failure rate for a hypothetical drive with no discs (or a drive that is not reading, writing or seeking). The solid line indicates estimated failure rates as a function of the number of discs present. 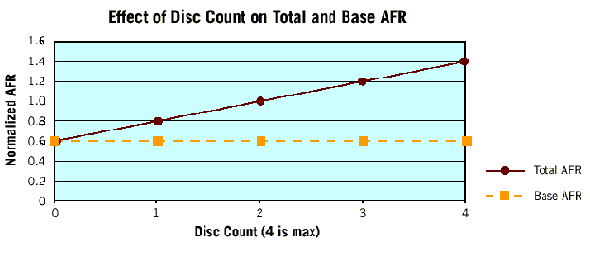 From the previous graph it is clear that reducing a drive's duty cycle reduces only the duty-cycle-dependent failures (those between the dotted and solid line). Using the ratio between duty-cycle-dependent and total failures, we can estimate the effect of duty cycle on AFR. For example, consider a four-disc drive with an total AFR of 1.4% and a base AFR of 0.6%. Reducing the duty cycle would reduce the failures by the factor [(1.4 - .6)/1.4] = 57%. In accounting for reduced duty cycle on a four-disc drive, therefore, we can only reduce 57% of the failures; the remainder are treated as independent of duty cycle. The resulting MTBF multipliers for drives with different numbers of discs are shown in the following figure. 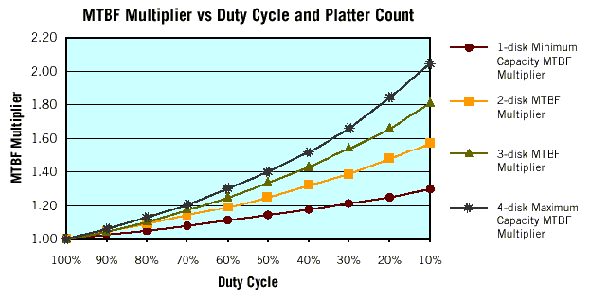 Combining multiple factorsTo continue the analysis, we combine a range of duty cycles and temperature derating factors (DF) for several different drives. The figure on the left shows MTBF multipliers at a variety of duty cycles and temperatures for a high-capacity, 4-disc drive. The figure on the right shows the same multipliers as applied to a drive with only one disc. As shown in these figures, depending on the duty cycle and the ambient temperature of the drive in the customer's PC, the first-year effective MTBF may be greater than, equal to, or less than the MTBF that we estimate based on in-house testing. For the one-disc drive, the effects of varying duty cycles are less significant and the MTBF multipliers tend to be significantly smaller. 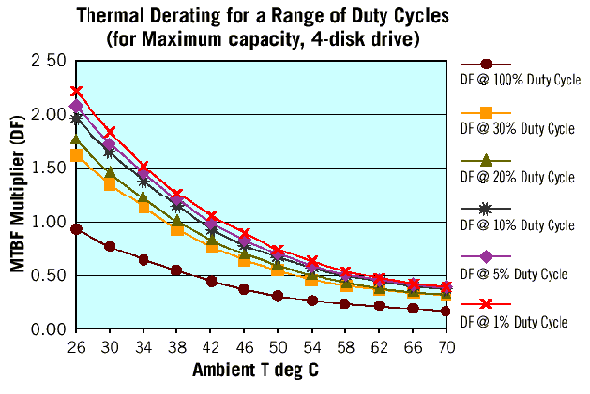 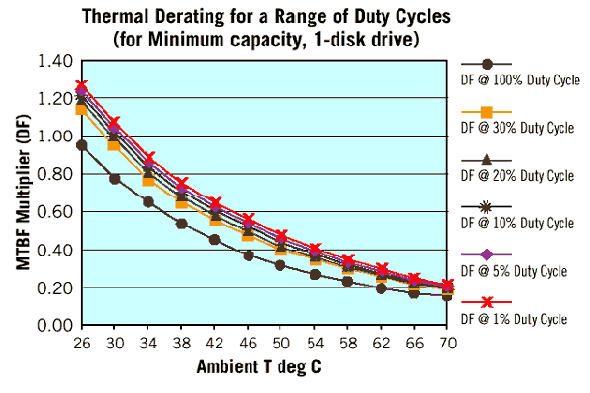 Reliability after the first yearThe Weibull distribution of time-to-failure, with a Beta less than one, is a distribution of decreasing failure probability over time. Because of this, MTBF values for a drive's first year in the field are likely to be higher than for subsequent years. What would the failure rate or MTBF look like if averaged over the entire useful life-time of the drive? Three possible methods for estimating reliability over a drive lifetime are listed below:
These models are compared in the table below.
To further illustrate the differences between these models, let's look at the cumulative percent failure rates for the three different models, each assuming a 200,000-hour first-year MTBF: 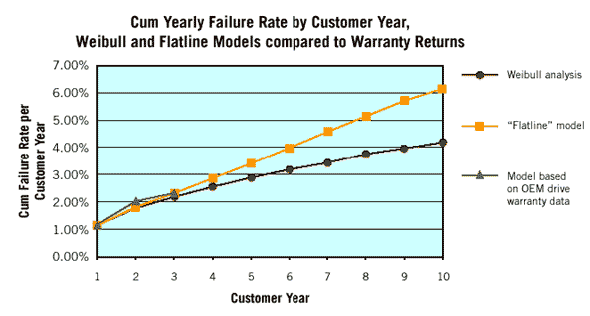 As the graph above shows, the "flatline" model is less aggressive than the pure Weibull model, and comes close to the model based on Seagate warranty returns in the first three years. For simplicity, and to provide a conservative estimate, we have chosen to use the flatline model for our calculations. Using the flatline model, the results of lifetime-averaged
MTBF versus first-year MTBF may be summarized as follows:
These calculations indicate that we would multiply the first year MTBF (at the appropriate duty cycle and ambient temperature) by 1.56 to estimate the averaged MTBF over a three-year drive lifetime. Similarly, to estimate the average MTBF over a drive lifetime of five or ten years, we would multiply the first year MTBF by 1.76 or 1.95, respectively. Putting it All TogetherBy combining the multipliers and derating factors described above, we can convert the Seagate-specified MTBF (first year, at 25 C ambient temperature, 2,400 POH/yr, and 100% duty cycle) into an MTBF that applies to a drive in a customer's device at an appropriate ambient temperature and duty cycle. We can then estimate the average MTBF over the drive's lifetime. The following example demonstrates the calculation of first-year and drive-lifetime MTBF for a drive operated at 2,400 POH/yr at an ambient operating temperature of 38 C, a duty cycle of 30% and a five-year useful life.
As a final example, consider the case of a 1-disc Seagate drive with a specified first-year MTBF of 444,000 hours, which is being operated in a consumer electronics device for a usage rate of 2,920 POH/yr (eight hours a day, seven days a week), an ambient temperature of 42 C, and a duty cycle of 5%.
ConclusionThe method outlined above allows us to use Seagate laboratory test data to estimate the reliability of drives in desktop computers and consumer electronic devices in "real-world" settings. The method can be summarized as follows:
In conclusion, this method provides a mathematically reasonable method for using Seagate test results to estimate drive reliability in consumer electronics. * * * *1 SuperSmith, Fulton Findings, WinSMITH and WinSMITH Weibull are trademarks of Fulton Findings, 1251 W. Sepulveda Blvd., #800, Torrance, CA 90502, USA *2 Abernethy, Dr. Robert B., The New Weibull handbook, Second Edition, published by the author, 1996, Chapter 5. *3 Abernethy, Dr. Robert B., The New Weibull handbook, Second Edition, published by the author, 1996, Appendix D. *4 Earlier in the RDT, a larger confidence level would be used to reflect the uncertainty in Weibull parameter estimation due to the limited run time. *5 Nelson, Wayne, Applied Life Data Analysis, John Wiley & Sons, 1982. Write a comment below. No registration needed!
|
Platform · Video · Multimedia · Mobile · Other || About us & Privacy policy · Twitter · Facebook Copyright © Byrds Research & Publishing, Ltd., 1997–2011. All rights reserved. | ||||||||||||||||||||||||||||||||||||||||||||||||||||||||||||||||||||||||||||||||||||||||||||||||||||||||||||||||||||||||||||||||||||||||||||||||||||||||||||||||||||||||||||||||||||||||||||||||||||||||||||||||||||||||||||||||||||||||||||||||||||||||||||||||||||||||||||||||||||||||||||||||