Traditionally SCSI disks were
considered to be intended for the class High-End however recently some
fall in value and the high level of tasks fulfilled on usual PCs increase
interest to them. The development of multimedia, digital video and DVD
has required from drives not only large capacity (for example MPEG2 of
high quality on usual CDROM will be only 20 minutes and the source film
occupies up to 200 GBytes) but also increased speeds - one stream of source
digital video requires approximately 20 MBytes/sec. Certainly today IDE
hard disks have appeared and they are not a match by speed for SCSI and
even IDE RAID controllers. It has mined positions SCSI (even AMI and Adaptec
have released their IDE controllers!). But we shouldn't forget that SCSI
today provides speed up to 160 MBytes/sec and capacity more than 1000
GBytes on one channel. IDE won't catch up with it by these parameters
soon. Thus for systems with necessity of such speeds and capacities there
is no alternative. Just don't forget to keep a lot of money.
As for speed where one of main metrics is a rotation speed,
first SCSI disk with RPM 7200 was represented in 1992 then in 1996 Seagate
presented revolutionary 10K RPM Cheetah. And then in 4 years the first
disk with RPM 15K Cheetah X15 was announced. And all this progress at
first came to the market of SCSI disks. Even the first ATA model with
RPM 7200 appeared only in 1997 later than SCSI Cheetah.
The development of interface SCSI also didn't lag behind.
We have already written about its last versions - Ultra2 SCSI and Ultra160.
The standard Ultra3 (ANSI SPI-3) covers some innovations. The manufacturers
first used a little bit capsule version called Ultra160 MBytes/sec SCSI
and it used three innovations from five provided ones: 160 MBytes/sec
transfer rate and double transition clocking (data transmission on both
fronts of clock signal), check CRC and domain validation (supervision
of environment). The modern disks (Quantum, IBM) already use a complete
variant which includes Packetization and Quick arbitration select (QAS)
except three ones named above. These technologies are directed to optimisation
of control SCSI bus, lessen delays at command passing and protocol overhead.
Let's note that there is also some mix-up in titles - SCSI-3, Ultra3,
Ulta160/m, Ultra160 however it is not so terrible as all implementations
SCSI-3 are compatible by definition. More problems can be caused by selection
of SCSI controller as it is unknown what exactly is realised for example
in Adaptec 29160, a manufacturer has only a mention about 160 MBytes/sec
speed and domain validation. So it seems that controllers lag behind hard
disks and for complete usage Ultra160 it is necessary to wait their second
generations. Besides Ultra/160 is completely inversily compatible with
Ultra2 and provides in this mode operation with speed up to 80 MBytes/sec.
You can read about Ultra160 in detail on http://www.ultra160-scsi.com/.
In the tables you can see master data of hard disks which
are fighted for. Except high-speed metrics they are: physical size of
the disk - height, noise level, power consumption and stability to external
mechanical effects. The data are indicated only for models with traditional
SCSI interfaces. For released variants with Fibre Channel buffer and power
consumption are usually more. Let's note that as the procedures of parameters
measurement can differ for different companies, then the matching of disks
by this data is not absolutely correct. It even happens that for the same
model different figures can be resulted in different documents. Therefore
we have made testing some models of hard disks in the programs Winbench
99 and Adaptec ThreadMark 2.0. In spite of the fact that the testing was
effected on the controller which maximum data transfer rate by SCSI bus
reaches only 40 MBytes/s (more exactly Ultra2 the controller was used
in UltraWide mode), none of tested disks reached read rate from surface
up to this rod (except one represented the last. You can read about it
in detail below. For reliability we have compared operation of fast disks
in UW and Ultra2 modes, thus the difference in the tests Winbench 99 has
not exceeded 2%. Certainly at usage more than one disk on the channel
usage Ultra2 is more appreciable and justified. As for the configuration
of PC it is the last tests which are done on UWSCSI controller and processor
Celeron (SuperMicro P6DBU, Celeron 450, 64 MBytes RAM). Faster controller
and processor Pentium III will be used in the following testing. For the
latest models of disks it was necessary to change the parameter of the
test Winbench 99 Disk Inspection CPU Utilization Test Transfer Rate from
usual 4000 thousand byte per second up to 20000. Also some tests on new
disks simply did not work. Besides some results seemed to be strange -
for example speed 68300 MBytes/sec in the test FrontPage can seem but
we shall keep it on conscience of the developers of the tests and we shall
look for the new one.
Quantum
Quantum for the series SCSI
disks already for a long time uses a title Atlas and probably is not going
to change it. Such conservatism simplifies a finding of particular model
as against Seagate and IBM which name the disks using 2-3 titles at the
same time. Production of Quantum is often advanced both by possibilities
and on speed (though the first 10000 RPM disk was released by Seagate).
As for subjective impressions there are no claims to production Quantum
either on speed or on reliability. The disks work silently enough and
are not heated strongly. But certainly Atlas 10k needs to be extra cooled.
The proposed maximum operating temperature is 50-55 degrees. It is pleased
that the figures indicated in the description are well matched with measurements
(especially Sustained Throughput). Tested Atlas 10k also was distinguished
by absence of defects on a surface (Adaptec SCSI Explorer 32 was tested),
though it is just alternative implementation of distribution the defect
list instruction. Despite of existent technology S.M.A.R.T., each manufacturer
invents its own solution. For Quantum it is Data Protection System (DPS)
which together with Quantum Shock Protection System and temperature control
increase common reliability of systems.

|
Atlas IV
|
Atlas V
|
Atlas 10k
|
Atlas 10k II
|
| Capacities |
9.1/18.2/36.4 GBytes |
9.1/18.3/36.7 GBytes |
9.1/18.2/36.4 GBytes |
9.2/18.4/36.7/73.4 |
| RPM |
7200 |
7200 |
10000 |
10000 |
Seek Time Average
Track-to Track (ms) |
6.9/6.9/7.5
0.8 |
6.3
0.8 |
5.0/5.0/5.5
0.8 |
4.7/4.7/4.7/5.2
0.6 |
| Average Latency (ms) |
4.17 |
4.17 |
3.0 |
3.0 |
| Internal Data Rate (MBytes/sec) |
151-257 |
194-340 |
215-315 |
280-478 |
| Sustained Throughput (MBytes/sec) |
13.5-21.5 |
17-29 |
18-26 |
24-40 |
| Buffer Size (MBytes) |
2 |
4 |
2 |
8 |
| Interface |
Ultra160/m |
Ultra160 |
Ultra160/m |
Ultra160 |
| Height (inches) |
1.00/1.00/1.6 |
1.00/1.00/1.00 |
1.00/1.00/1.6 |
1.00/1.00/1.64 |
| Sound Power (Bels, Idle) |
3.6/3.6/4.0 |
3.2/3.3/3.5 |
4.0 4.0 4.2 |
3.7/3.7/3.8/4.2 |
| Non-Operating Shock (G, 2 ms, 1/2 sine) |
200/200/150 |
300/300/280 |
200/200/200 |
250/250/250/200 |
| Typical Power Draw (W, Idle) |
6.5/7.9/10.8 |
7.5/8.7/9.9 |
8/10/15.5 |
9.7/9.7/10.0/14.3 |
Results of the tests: Atlas IV 9
GBytes (KN09L011), Atlas V 9 GBytes (XC09L011),
Atlas V 18 GBytes (XC18L011), Atlas
10k 9 GBytes (TN09L011) and Atlas 10k II
9 GBytes (TY09L011).
Seagate
The company Seagate has a little
bit more range of models. However it is possible to note that for example
the model Barracuda 36 is similar by parameters to the series Barracuda
18LP and as a matter of fact is 36.4 GBytes version of this set. Traditionally
disks with RPM 7200 are released under the brand Barracuda and faster
ones under the brand Cheetah. Unfortunately it was not possible to find
out what features of SCSI-3 are really used in implementation Ultra160
disks interface. Seagate does not give these data. But the latest model
- Cheetah X15 with RPM 15000 has pleased us with its speed, it is the
really first disk for which interface UltraWide SCSI is already not enough.
Read rate at the beginning of the disk really reaches 41.3 MBytes/sec!
Seagate very attentively concerns not only to high-speed parameters of
the disks but also to reliability. Having conducted mass probing the company
has developed even special container for packing disks which appreciably
reduced the number of faults connected with incorrect transportation.
|
|
Barracuda 18LP
|
Barracuda 36
|
Barracuda 50
|
Barracuda 18XL
|
| Capacities |
9.1/18.2 GBytes |
36.4 GBytes |
50.1 GBytes |
9.2/18.4 GBytes |
| RPM |
7200 |
7200 |
7200 |
7200 |
Seek Time Average
Track-to Track (ms) |
6.9
0.8 |
7.4
0.8 |
7.4
0.9 |
5.9
0.6 |
| Average Latency (ms) |
4.17 |
4.17 |
4.17 |
4.17 |
| Internal Data Rate (MBytes/sec) |
137-240 |
137-240 |
153-264 |
183-316 |
| Sustained Throughput (MBytes/sec) |
12.9-25.5 |
12.9-22.5 |
14.9-25.7 |
17.2-29.6 |
| Buffer Size (MBytes) |
1(optional 4) |
1(optional 4) |
1 |
2 |
| Interface |
Ultra2 |
Ultra2 |
Ultra2 SCSI |
Ultra160 |
| Height (inches) |
1.0 |
1.62 |
1.62 |
1.0 |
| Idle Acoustics (Bels) |
4.1 |
4.2 |
4.0 |
3.4 |
| Non-Operating Shock (G, 2 ms, 1/2 sine) |
150 |
135 |
150 |
250 |
| Typical Power Draw (W, Idle) |
9.75 |
13.35 |
11.87 |
6.5/6.8 |
|
|
Cheetah 18LP
|
Cheetah 36
|
Cheetah 18XL
|
Cheetah 36LP
|
Cheetah 73
|
Cheetah X15
|
| Capacities |
9.1/18.2 GBytes |
36.4 GBytes |
9.2/18.4 GBytes |
36.7 |
73.4 |
9.2/18.4 |
| RPM |
10000 |
10000 |
10000 |
10000 |
10000 |
15000 |
Seek Time Average
Track-to Track (ms) |
5.2
0.6 |
5.7
0.6 |
5.2
0.6 |
5.2
0.6 |
5.6
0.6 |
3.9
0.5 |
| Average Latency (ms) |
2.99 |
2.99 |
2.99 |
2.99 |
2.99 |
2.0 |
| Internal Data Rate (MBytesytes/sec) |
193-308 |
193-308 |
284-424 |
280-427 |
280-427 |
395-492 |
| Sustained Throughput (MBytes/sec) |
18.3-28.0 |
18.3-28.0 |
26.6-40.5 |
26.7-40.2 |
26.7-40.2 |
38.0-47.4 |
| Buffer Size (MBytes) |
1 (optional 4) |
1 |
4 |
4 |
4 |
4 |
| Interface |
Ultra160 |
Ultra160 |
Ultra160 |
Ultra160 |
Ultra160 |
Ultra160 |
| Height (inches) |
1.0 |
1.6 |
1.0 |
1.0 |
1.6 |
1.0 |
| Idle Acoustics (Bels) |
4.3 |
4.7 |
3.8 |
3.9 |
4.2 |
3.9 |
| Non-Operating Shock (G, 2 ms, 1/2 sine) |
200 |
175 |
250 |
200 |
180 |
250 |
| Typical Power Draw (W, Idle) |
11.0 |
15.7 |
8/9 |
11.0 |
15.7 |
11.0 |
Results of the tests: Barracuda
18XL (ST39236LW), Cheetah 18LP (ST39133LWV),
Cheetah 18XL (ST39204LW).
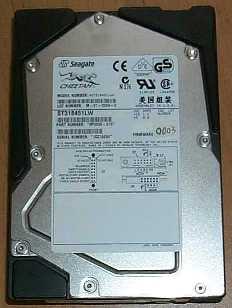
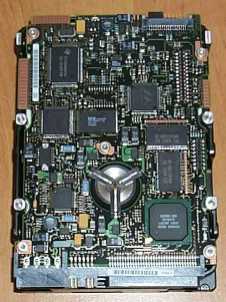
Seagate Cheetah X15
As Cheetah X15 undoubtedly
is the remarkable product and we shall tell about it in detail.
At first some descriptor data:
- RPM: 15000
- Seek Time Average: 3.9 ms
- Sustained Throughput: 38.0-47.4 MBytes/sec
- Buffer Size: 4 MBytes
- Interface: Ultra160
And photos:
As you remember Seagate was the first to present the disk
with 10000 RPM. Then the first generation Cheetah was in comparison with
remaining disks not only faster but also noisier and besides the first
forced cooling was required for. Today Cheetah X15 does not differ much
from 10000 RPM disks by the last two parameters. By noise it is quite
comparable with Cheetax 18XL and Ultrastar 36LZX. And as for temperature
all disks at the tests were cooled by one 80mm ventilator with the large
rotation rate. In these conditions on Cheetah X15 it was possible to note
small heating of tank and the rest of disks were just of room temperature.
Now about measurement technique and problems connected with
it. Firstly as this disk's read rate from the first tracks exceeds 40
MBytes/sec, this disk was measured already on Ultra2 the controller. Actually
UW tail with active terminator was changed on Ultra2 tail and the appropriate
terminator.
Secondly the test Winbench 99 represented at the end of
1998 does not cope any more with the task - the results of some tests
are obviously erratic - even if to consider that the data is taken from
disk cache, it is impossible to reach 68 MBytes/sec by 40 MBytes/sec bus.
Hang-up of the program also was marked at the attempt to measure percent
of processor loading during the tests for Windows NT. As for results for
one part (Access Time, Transfer Rate, CPU Utilisation) the spread in several
measurements of one disk did not exceed 2%, therefore these tests repeated
only 3-5 times. But the results Business and High-End Disk WinMark 99
could differ in 3-7%! For reliability these two tests were conducted 10-12
times and the average was sampled. Most likely there is unambiguous dependence
the results of these tests from the first ones but the process of measurement
gives the random corrections connected with the large speeds and insufficient
period of measurement, so that while we should take the obtained results
carefully.
At choice UltraWide or Ultra2 interface having compared
for example Seagate Cheetah 18XL and IBM Ultrastar 36LZX in these modes
we have got a difference in results no more than 2%, so that it is possible
to say that in our case the choice of UW SCSI has not resulted to significant
losses of productivity. For Cheetah X15 the difference was already more
appreciable, the losses for UW in Business and High-End Disk WinMark 99
were 4.2% and 7.6% accordingly to say nothing about the decrease of transfer
in the beginning of the disk from 41 up to 35 MBytes/sec. It is all correctly
only for the case of one disk on the channel. The advantages Ultra2 in
RAID systems are unconditionally higher. But the replacement of the processor
for the faster one (P3-600E) will for certain be reflected in results
of all disks - for example for Cheetax X15 increase has made 8.2% and
7.9% in the tests Business and High-End Disk WinMark 99.
Well and at last results of the tests in the configuration
similar (except interface - here Ultra2) remaining disks for matching:
Cheetah X15 (ST318451LW).
IBM
IBM set of SCSI disks is released
under the brand Ultrastar. Except the set the hard disks IBM have also
a four-letter title of model. Under Ultra160 we understand the implementation
only of three items SCSI-3 but under Ultra160 + of all five ones As well
as each large manufacturer IBM offers also unique technologies reliability
of systems operating its disks. In particular "Drive-TIP" serves
for the temperature control but " Predictive Failure Analysis "
as it is clear from the title notifies the users about potential problems
in disk system.
Nowadays IBM offered disks:
|
IBM Ultrastar
|
72ZX (DDHS)
|
36LZX (DDYS)
|
36LP (DPSS)
|
36XP (DRHS)
|
18LZX/36ZX (DMVS)
|
9LZX/18ZX (DRVS)
|
18ES (DNES)
|
| Capacities |
73.4 |
9.1 / 18.3 / 36.7 GBytes |
9.1 / 18.3 / 36.9 GBytes |
36.4 GBytes |
9.1 / 18.3 / 36.7 GBytes |
9.1 / 18.2 GBytes |
9.1 / 18.3 GBytes |
| RPM |
10000 |
10000 |
7200 |
7200 |
10000 |
10000 |
7200 |
Seek Time Average
Track-to Track (ms) |
5.3
0.6 |
4.9
0.5 |
6.8
0.6 |
7.5
0.3 |
4.9/4.9/5.4
0.3 |
5.3/6.5
0.7 |
7.0
0.8 |
| Average Latency (ms) |
2.99 |
2.99 |
4.17 |
4.17 |
3.0 |
2.99 |
4.17 |
| Internal Data Rate (MBytes/sec) |
280-473 |
280-452 |
248-400 |
143-231 |
187-354 |
187-243 |
159-244 |
| Sustained Throughput (MBytes/sec) |
22.1-37.4 |
21.5-36.1 |
19.5-31.9 |
11.7-19.9 |
15.2-29.5 |
17.5-23.3 |
12.7-20.2 |
| Buffer Size (MBytes) |
16 |
4 |
4 |
4 |
2 (optional 8) |
4 |
2 |
| Interface |
Ultra160+ |
Ultra160+ |
Ultra160 |
Ultra2 |
Ultra160 |
Ultra2 |
Ultra2 |
| Height (inches) |
1.6 |
1.0 |
1.0 |
1.6 |
1.0/1.6 |
1.0/1.6 |
1.0 |
| Non-Operating Shock (G, 2 ms) |
250 |
250 |
225 |
140 |
175 |
150/140 |
175 |
| Typical Power Draw (W, Idle) |
16.9 |
8.5/9.7/12.9 |
7.2/7.9/8.9 |
13.1 |
10.0/11.5/17.4 |
12.2/16.3 |
5.3/6.9 |
Results of the tests: Ultrastar
36LZX (DDYS-T36950)
Fujitsu
Having presented in November,1998
series MAE and MAG Fujitsu a year later refreshed its bar of SCSI. Usage
of the fifth generation GMR heads and increase bit density up to 9.1 GBytes
on the disk has allowed to increase productivity on 30%. For new models
interface Ultra160 (160 MBytes/s data transfers, domain validation and
CRC) is used. Unfortunately SCSI production Fujitsu is aimed mainly to
the corporate American market and in another areas the new models have
not appeared yet.
|
|
MAE3xxx
|
MAD3364
|
MAG3xxx
|
MAF3364
|
MAH3xxx
|
MAJ3xxx
|
| Capacities |
9.1/18.2 GBytes |
36.4 GBytes |
9.1/18.2 GBytes |
36.4 GBytes |
9.1/18.2 GBytes |
9.1/18.2/36.4 GBytes |
| RPM |
7200 |
7200 |
10025 |
10025 |
7200 |
10025 |
Seek Time Average
Track-to Track (ms) |
7.0
0.7 |
5.5
0.7 |
5.0
0.7 |
5.5
0.7 |
6.8
0.6 |
4.7
0.6 |
| Average Latency (ms) |
4.17 |
4.17 |
2.99 |
2.99 |
4.17 |
2.99 |
| Data Transfer Rate to/from media (MBytes/sec) |
21.7-32.8 |
21.4-35.1 |
29.5-45.0 |
30.3-45.0 |
40.0-49.5 |
41.8-62.5 |
| Buffer Size (MBytes) |
2 |
2 |
2 |
2 |
4 |
4 |
| Interface |
Ultra2 |
Ultra2 |
Ultra2 |
Ultra2 |
Ultra160 |
Ultra160 |
| Height (inches) |
1.0 |
1.6 |
1.0 |
1.6 |
1.0 |
1.0 |
| Sound Power (dBA, Idle) |
40 |
40 |
40 |
42 |
40 |
39 |
| Non-Operating Shock (G, 2 ms) |
200 |
200 |
200 |
200 |
200 |
200 |
| Typical Power Draw (W, Idle) |
8.0 |
9.5 |
10.5 |
14.5 |
6 |
8.0/9.0/11.0 |
Results
Quantum Atlas 10k
|
|
Windows 98
|
Windows NT
|
| WinBench 99 |
| Business Disk WinMark 99 (TB/S) |
4885
32.81% |
5057
29.36% |
| High-End Disk WinMark 99 (TB/S) |
16300
25.17% |
15533
17.99% |
| Disk Transfer Rate:Beginning (TB/S) |
25900
6.38% |
25900
3.04% |
| Disk Transfer Rate:End (TB/S) |
18400 |
18400 |
| Disk Access Time (Milliseconds) |
8.86
1.14% |
8.68
0.79% |
| Disk CPU Utilization (Percent Used) |
4.37 |
1.597 |
| High-End |
| Disk Playback/HE:AVS/Express 3.4
(TB/S) |
11125 |
20767 |
| Disk Playback/HE:FrontPage 98 (TB/S) |
68425 |
40533 |
| Disk Playback/HE:MicroStation SE (TB/S) |
14050 |
18133 |
| Disk Playback/HE:Photoshop 4.0 (TB/S) |
10800 |
8470 |
| Disk Playback/HE:Premiere 4.2 (TB/S) |
14325 |
12900 |
| Disk Playback/HE:Sound Forge 4.0 (TB/S) |
27550 |
18533 |
| Disk Playback/HE:Visual C++ 5.0 (TB/S) |
18600 |
13867 |
Adaptec ThreadMark
Data Transfer Rate/Average CPU Utilization |
18.37MB/s
44.33% |
18.66MB/s
21.40% |
(*) Winbench 99 Disk Inspection CPU Utilization Test Transfer Rate
- 20000 tb/s
Quantum Atlas 10k II
|
|
Windows 98
|
Windows NT
|
Windows 2000
|
| WinBench 99 |
| Business Disk WinMark 99 (TB/S) |
6232
42.21% |
6174
35.71% |
5754
37.99% |
| High-End Disk WinMark 99 (TB/S) |
22850
33.29% |
20000
23.00% |
18890
26.09% |
| Disk Transfer Rate:Beginning (TB/S) |
41833
10.56% |
41700
4.35% |
41000
6.18% |
| Disk Transfer Rate:End (TB/S) |
29200 |
29200 |
28133 |
| Disk Access Time (Milliseconds) |
7.34
1.64% |
7.26
1.19% |
7.28
1.42% |
| Disk CPU Utilization (Percent Used) |
4.75 |
7.61 (*) |
11.57 (*) |
| High-End |
| Disk Playback/HE:AVS/Express 3.4
(TB/S) |
18020 |
27150 |
23230 |
| Disk Playback/HE:FrontPage 98 (TB/S) |
72250 |
48310 |
60980 |
| Disk Playback/HE:MicroStation SE (TB/S) |
19330 |
20640 |
22810 |
| Disk Playback/HE:Photoshop 4.0 (TB/S) |
15090 |
11300 |
13160 |
| Disk Playback/HE:Premiere 4.2 (TB/S) |
19760 |
17330
|
13200 |
| Disk Playback/HE:Sound Forge 4.0 (TB/S) |
37880 |
25740 |
19090 |
| Disk Playback/HE:Visual C++ 5.0 (TB/S) |
23800 |
17140 |
15990 |
Adaptec ThreadMark
Data Transfer Rate/Average CPU Utilization |
29.77MB/s
65.72% |
-
- |
-
- |
(*) Winbench 99 Disk Inspection CPU Utilization Test Transfer Rate
- 20000 tb/s
Quantum Atlas IV
|
|
Windows 98
|
Windows NT
|
| WinBench 99 |
| Business Disk WinMark 99 (TB/S) |
3845
25.69% |
4008
23.39% |
| High-End Disk WinMark 99 (TB/S) |
13350
19.9% |
11725
13.9% |
| Disk Transfer Rate:Beginning (TB/S) |
21700
5.27% |
21700
2.35% |
| Disk Transfer Rate:End (TB/S) |
13775 |
13800 |
| Disk Access Time (Milliseconds) |
11.425
0.66% |
11.2
0.58% |
| Disk CPU Utilization (Percent Used) |
4.38 |
1.56 |
| High-End |
| Disk Playback/HE:AVS/Express 3.4
(TB/S) |
9208 |
15600 |
| Disk Playback/HE:FrontPage 98 (TB/S) |
65700 |
37975 |
| Disk Playback/HE:MicroStation SE (TB/S) |
11050 |
14325 |
| Disk Playback/HE:Photoshop 4.0 (TB/S) |
8393 |
6488 |
| Disk Playback/HE:Premiere 4.2 (TB/S) |
12075 |
8753 |
| Disk Playback/HE:Sound Forge 4.0 (TB/S) |
22800 |
13350 |
| Disk Playback/HE:Visual C++ 5.0 (TB/S) |
15575 |
10825 |
Adaptec ThreadMark
Data Transfer Rate/Average CPU Utilization |
15.54MB/s
37.52% |
14.80MB/s
16.24% |
(*) Winbench 99 Disk Inspection CPU Utilization Test Transfer Rate
- 20000 tb/s
Quantum Atlas V
|
|
18 GB Windows 98
|
18 GB Windows NT
|
9 GB Windows 98
|
9GB Windows NT
|
| WinBench 99 |
| Business Disk WinMark 99 (TB/S) |
4810
31.72% |
3985
23.6% |
4550
30.44% |
4190
24.85% |
| High-End Disk WinMark 99 (TB/S) |
16225
24.77% |
13925
18.08% |
15700
24.26% |
14200
16.81% |
| Disk Transfer Rate:Beginning (TB/S) |
29800
6.91% |
29700
3.11% |
29700
7% |
29675
3.14% |
| Disk Transfer Rate:End (TB/S) |
17900 |
17900 |
17900 |
17900 |
| Disk Access Time (Milliseconds) |
11.475
0.75% |
12.1
0.73% |
10.55
0.88% |
10.6
0.64% |
| Disk CPU Utilization (Percent Used) |
4.35 |
1.58 |
4.55 |
1.58 |
| High-End |
| Disk Playback/HE:AVS/Express 3.4
(TB/S) |
10775 |
18050 |
10325 |
17650 |
| Disk Playback/HE:FrontPage 98 (TB/S) |
68300 |
35850 |
68300 |
38650 |
| Disk Playback/HE:MicroStation SE (TB/S) |
12925 |
15275 |
12875 |
15225 |
| Disk Playback/HE:Photoshop 4.0 (TB/S) |
10725 |
7925 |
10600 |
7840 |
| Disk Playback/HE:Premiere 4.2 (TB/S) |
15000 |
10975 |
14400 |
12050 |
| Disk Playback/HE:Sound Forge 4.0 (TB/S) |
29350 |
18225 |
26300 |
18325 |
| Disk Playback/HE:Visual C++ 5.0 (TB/S) |
18975 |
12175 |
18225 |
12750 |
Adaptec ThreadMark
Data Transfer Rate/Average CPU Utilization |
21.55MB/s
54.64% |
15.28MB/s
17.76% |
21.67MB/s
49.35% |
19.41%
21.88% |
(*) Winbench 99 Disk Inspection CPU Utilization Test Transfer Rate
- 20000 tb/s
Atlas V 9GB (Winbench 99):
Atlas V 18GB (Winbench 99):
Seagate Barracuda 18XL
|
|
Windows 98
|
Windows NT
|
| WinBench 99 |
| Business Disk WinMark 99 (TB/S) |
4025
27.28% |
4138
24.31%
|
| High-End Disk WinMark 99 (TB/S) |
13850
22.05% |
12425
14.71% |
| Disk Transfer Rate:Beginning (TB/S) |
26900
6.58% |
27100
2.83% |
| Disk Transfer Rate:End (TB/S) |
16500 |
16500 |
| Disk Access Time (Milliseconds) |
12.2
0.81% |
12
0.60% |
| Disk CPU Utilization (Percent Used) |
4.67 |
1.55 |
| High-End |
| Disk Playback/HE:AVS/Express 3.4
(TB/S) |
7730 |
14150 |
| Disk Playback/HE:FrontPage 98 (TB/S) |
62375 |
37500 |
| Disk Playback/HE:MicroStation SE (TB/S) |
12775 |
17000 |
| Disk Playback/HE:Photoshop 4.0 (TB/S) |
10625 |
7300 |
| Disk Playback/HE:Premiere 4.2 (TB/S) |
14250 |
9848 |
| Disk Playback/HE:Sound Forge 4.0 (TB/S) |
18425 |
11340 |
| Disk Playback/HE:Visual C++ 5.0 (TB/S) |
16100 |
12675 |
Adaptec ThreadMark
Data Transfer Rate/Average CPU Utilization |
14.95MB/s
37.78% |
14.89MB/s
16.42% |
(*) Winbench 99 Disk Inspection CPU Utilization Test Transfer Rate
- 20000 tb/s
Seagate Cheetah 18LP
|
|
Windows 98
|
Windows NT
|
| WinBench 99 |
| Business Disk WinMark 99 (TB/S) |
4593
31.57% |
4663
28.67% |
| High-End Disk WinMark 99 (TB/S) |
15725
24.35% |
13775
16.26 |
| Disk Transfer Rate:Beginning (TB/S) |
27300
6.57% |
27500
2.87% |
| Disk Transfer Rate:End (TB/S) |
18100 |
18100 |
| Disk Access Time (Milliseconds) |
9.27
1.18% |
8.865
0.89% |
| Disk CPU Utilization (Percent Used) |
4.58 |
1.56 |
| High-End |
| Disk Playback/HE:AVS/Express 3.4
(TB/S) |
10023 |
17000 |
| Disk Playback/HE:FrontPage 98 (TB/S) |
65275 |
44100 |
| Disk Playback/HE:MicroStation SE (TB/S) |
14975 |
19950 |
| Disk Playback/HE:Photoshop 4.0 (TB/S) |
11150 |
7860 |
| Disk Playback/HE:Premiere 4.2 (TB/S) |
15100 |
10118 |
| Disk Playback/HE:Sound Forge 4.0 (TB/S) |
21125 |
13000 |
| Disk Playback/HE:Visual C++ 5.0 (TB/S) |
16700 |
13775 |
Adaptec ThreadMark
Data Transfer Rate/Average CPU Utilization |
14.53MB/s
35.55% |
13.88MB/s
16.33% |
(*) Winbench 99 Disk Inspection CPU Utilization Test Transfer Rate
- 20000 tb/s
Seagate Cheetah 18XL
|
|
Windows 98
|
Windows NT
|
Windows 2000
|
| WinBench 99 |
| Business Disk WinMark 99 (TB/S) |
5070
34.33% |
4726
- |
4947
31,58% |
| High-End Disk WinMark 99 (TB/S) |
17920
28.17% |
16275
- |
16575
24,21% |
| Disk Transfer Rate:Beginning (TB/S) |
34040
8.63% |
33250
- |
33550
6,64% |
| Disk Transfer Rate:End (TB/S) |
24880 |
24900 |
24900 |
| Disk Access Time (Milliseconds) |
9.226
1.15% |
8.82
- |
9,04
1,09% |
| Disk CPU Utilization (Percent Used) |
4.56 |
7.75 (*) |
14,36 (*) |
| High-End |
| Disk Playback/HE:AVS/Express 3.4
(TB/S) |
10480 |
21325 |
18250 |
| Disk Playback/HE:FrontPage 98 (TB/S) |
65500 |
43675 |
56208 |
| Disk Playback/HE:MicroStation SE (TB/S) |
16360 |
22287 |
22717 |
| Disk Playback/HE:Photoshop 4.0 (TB/S) |
14040 |
9892 |
12367 |
| Disk Playback/HE:Premiere 4.2 (TB/S) |
18060 |
12650 |
12108 |
| Disk Playback/HE:Sound Forge 4.0 (TB/S) |
25300 |
15500 |
12958 |
| Disk Playback/HE:Visual C++ 5.0 (TB/S) |
19100 |
14212 |
15425 |
Adaptec ThreadMark
Data Transfer Rate/Average CPU Utilization |
18.95MB/s
40.24% |
-
- |
-
- |
(*) Winbench 99 Disk Inspection CPU Utilization Test Transfer Rate
- 20000 tb/s
Seagate Cheetah X15
|
|
Windows 98
|
Windows NT
|
Windows 2000
|
| WinBench 99 |
| Business Disk WinMark 99 (TB/S) |
6186
42.00% |
5768
- |
5828
38.57% |
| High-End Disk WinMark 99 (TB/S) |
22250
33.46% |
19580
- |
19642
26.46% |
| Disk Transfer Rate:Beginning (TB/S) |
41300
9.79% |
41467
4.49% |
41500
6.74% |
| Disk Transfer Rate:End (TB/S) |
32367 |
32400 |
32400 |
| Disk Access Time (Milliseconds) |
6.9
1.15% |
6.77
1.2% |
6.80
1.59% |
| Disk CPU Utilization (Percent Used) |
4.25 |
7.58 |
11.96 |
| High-End |
| Disk Playback/HE:AVS/Express 3.4
(TB/S) |
14142 |
26070 |
23183 |
| Disk Playback/HE:FrontPage 98 (TB/S) |
68100 |
49910 |
61408 |
| Disk Playback/HE:MicroStation SE (TB/S) |
20433 |
25940 |
28283 |
| Disk Playback/HE:Photoshop 4.0 (TB/S) |
16758 |
12160 |
13975 |
| Disk Playback/HE:Premiere 4.2 (TB/S) |
22767 |
14820 |
14092 |
| Disk Playback/HE:Sound Forge 4.0 (TB/S) |
31058 |
20290 |
16633 |
| Disk Playback/HE:Visual C++ 5.0 (TB/S) |
22592
|
16440 |
17008 |
Adaptec ThreadMark
Data Transfer Rate/Average CPU Utilization |
24.39MB/s
49.17% |
-
- |
-
- |
(*) Winbench 99 Disk Inspection CPU Utilization Test Transfer Rate
- 20000 tb/s
IBM Ultrastar 36LZX
|
|
Windows 98
|
Windows NT
|
Windows 2000
|
| WinBench 99 |
| Business Disk WinMark 99 (TB/S) |
5486
36.83% |
5805
- |
5190
34.52% |
| High-End Disk WinMark 99 (TB/S) |
18000
29.49% |
18317
- |
17020
23.61% |
| Disk Transfer Rate:Beginning (TB/S) |
33160
7.53% |
35100
- |
35000
5.16% |
| Disk Transfer Rate:End (TB/S) |
22900 |
22900 |
22900 |
| Disk Access Time (Milliseconds) |
8.79
0.76% |
8.67
- |
8.67
0.98% |
| Disk CPU Utilization (Percent Used) |
4.27 |
7.68 (*) |
11.3 (*) |
| High-End |
| Disk Playback/HE:AVS/Express 3.4
(TB/S) |
8950 |
20533 |
18180 |
| Disk Playback/HE:FrontPage 98 (TB/S) |
69400 |
53583 |
59620 |
| Disk Playback/HE:MicroStation SE (TB/S) |
17720 |
22633 |
24660 |
| Disk Playback/HE:Photoshop 4.0 (TB/S) |
14480 |
12433 |
12120 |
| Disk Playback/HE:Premiere 4.2 (TB/S) |
19620 |
14233 |
12040 |
| Disk Playback/HE:Sound Forge 4.0 (TB/S) |
26520 |
17000 |
14040
|
| Disk Playback/HE:Visual C++ 5.0 (TB/S) |
20600 |
16600 |
16200 |
Adaptec ThreadMark
Data Transfer Rate/Average CPU Utilization |
14.74MB/s
33.46% |
-
- |
-
- |
(*) Winbench 99 Disk Inspection CPU Utilization Test Transfer Rate
- 20000 tb/s
Write a comment below. No registration needed!