 |
||
|
||
| ||
|
||
|
||
| ||
DirectX 8.1 SDK - limiting testsTo test different chip's limiting characteristics we used examples from the prerelease of the last version of the DirectX SDK which were modified to be more convenient in operation and in control. Due to some changes we had to rewrite several examples as the old code and the compiled examples from the SDK 8.0 are not compatible with the DirectX and DirectX SDK 8.1. But do not worry: the most of other examples compiled for the DirectX 8.0 can be processed at the 8.1 without any problems. We are focusing on this compatibility because of the disputes over a nonoperation of the EMBM examples of BumpLens and BumpWaves and of the RTPatch one on the new GeForce3 drivers. So, while the former two do not work through their own fault, and when compiled in the SDK 8.1 they begin operate excellently, the RTPatch is in a different situation. The NVIDIA drivers do not support this hardware feature of the card anymore for some reason. Well, let's turn to our tests: Optimized MeshThe test helps to determine the practical limit of the accelerator throughput as far as triangles are concerned. Thus, it uses several models displayed in a small window, each consisting of 50,000 triangles. There is no lighting or texturing. The dimensions of the models are minimal: each triangle does not exceed one pixel. It should be noted that the results of this test can't be achieved in real applications where triangles are quite large, and textures and lighting is provided. The results are given for three modes: Optimized model (for an optimal output speed, with regard to the chip's internal cache), Unoptimized model and Strip (a model displayed in the form of one Triangle Strip): 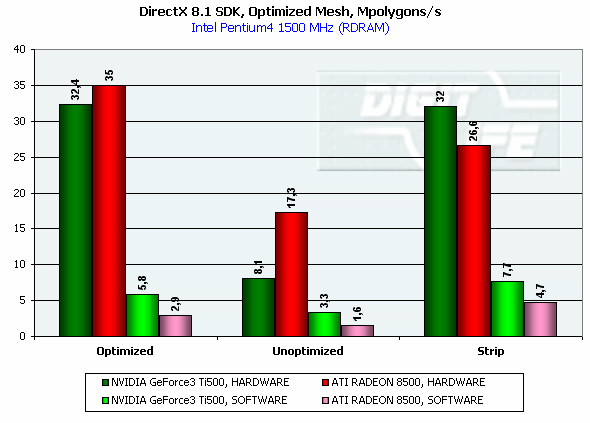 In the Optimized Model mode both accelerators perform impressively - more than 30M polygons per second, with the advantage of the RADEON 8500 being less than expected due to a frequency difference. The RADEON copes excellently also with an unoptimized model, being twice better than its competitor. Probably, it is large vertex caches that helped it to win. It is interesting that the unoptimized Strip model didn't allow the RADEON to outscore its contender. For the GeForce 3 Ti 500, however, the Strip is almost equal to the Optimized. Besides, the GeForce 3 shines in a forced activation of the program geometry calculation thanks to the FastWrites mechanism which makes possible to transfer geometrical data from the processor directly to the accelerator passing by the system memory. Vertex shader block performanceHere we can estimate the limiting performance of a vertex shader block. The shader is quite complicated: it implements both specific transformations and geometrical functions. The test is carried out in the lowest resolution in order to minimize the rasterizing effect. The Z-buffer was disabled, and the HSR, therefore, couldn't affect the results: 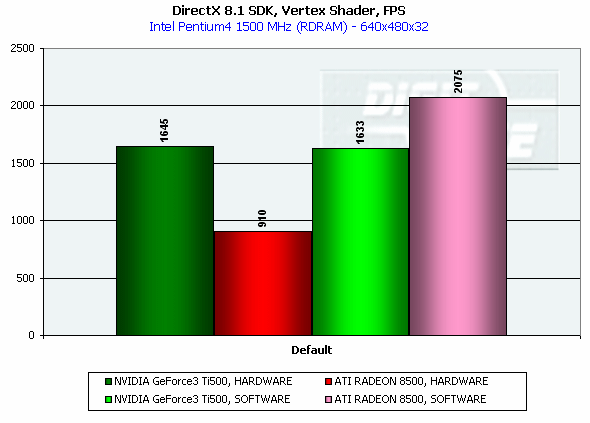 In the event of a hardware utilization of the vertex shaders the Ti 500 almost twice outscores the RADEON. Moreover, the GeForce3 performs better than half a year ago. The results of software and hardware implementation of shaders on the GeForce 3 amazingly coincide. What if all shaders are processed only on the software level? To check it we decreased the clock speed of the Pentium4 to 1000 MHz. This time the software results fell down to ~1200, while the hardware ones remained almost the same. It means that the new revision of the NV20 chip (A05) and/or new drivers boosted up the performance of the vertex shaders almost twice (in comare with our old NV20 results). Vertex matrix blendingThis feature of the T&L is used for plausible animation and skinning of models. We tested the blending using two matrices both on a hardware level and with a vertex shader which implements the same function. Besides, we obtained the results in the T&L software emulation mode: 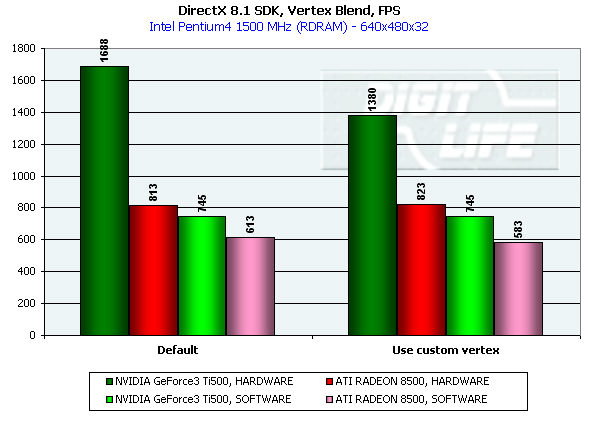 The Ti 500 takes a lead here, especially in case of a full hardware realization of blending. Moreover, the hardware implementation outshines the vertex shader and software one. The total performance of different GeForce 3 blocks is higher again. But will it help the GF3 to excel in real applications where it is important to have not only highly efficient separate blocks but a correct organization of their interaction as well? Later we will find it out. Pixel shader performanceWe use again a modified example of the MFCPixelShader and measure a performance of the cards at a high resolution during implementation of 5 shaders of different complexity for bilinear filtered textures: ATI nudges out its competitor in case of the simplest shader which doesn't use any textures. Falling a bit behind with two textures, the RADEON is smashed to bits with 4 ones! The problem is caused not by complexity of the shader but by the number of textures it uses! The card implements shaders of v.1.4. One of the demo-programs supplied with the RADEON 8500 allows you to notice a difference between the PS1.1 and PS1.4 realizations (the 1.1 is on the top, the 1.4 is on the bottom)   The performance of the v.1.4 is adequate to that of the previous versions at similar tasks. The 1.4 shaders are more flexible as far as sampling of texture values is concerned, and there is a wide range of effects which either are simpler to realize with them or are not realizable without them at all. But NVIDIA does not plan on a support of the 1.4 shaders, and the next ATI's product will be compatible with the DirectX 9 and, therefore, with 2.0 pixel shaders.   EMBM reliefHere we measure the performance drop when Environment mapping and EMBM (Environment Mapped Bump Mapping) get enabled. The test was conducted at 1280x1024x32 as the difference between the cards and texturing modes are the most lucid: 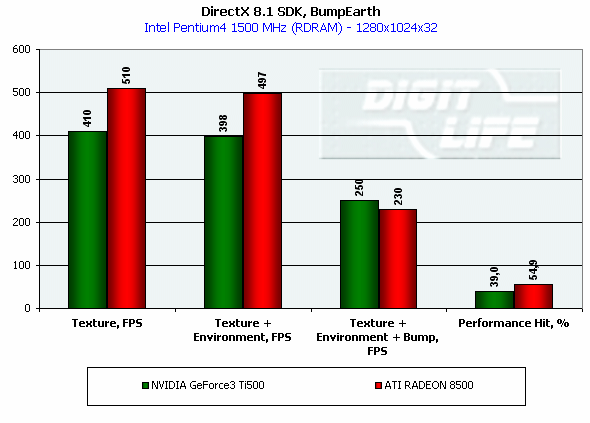 In the basic "Environment + Bump (EMBM)" test you can witness that the RADEON 8500 loses despite its superiority in a usual texturing and in environmental mapping. It looks like that the last EMBM stage - perturbation - is implemented not very confidently as the performance drops quite significantly. Hardware realization of N-PatchesAs there are no applications which can check how the performance of hardware realization of N-Patches depends on a detailing level, we asked the developer of the RADEON Screen Saver Philip Gerasimov to modify the program so that we can change detailing levels. On the photos below you can see what we have obtained: without N-Patches (on the top) and with the Truform enabled (on the bottom):   Here is the the graph: 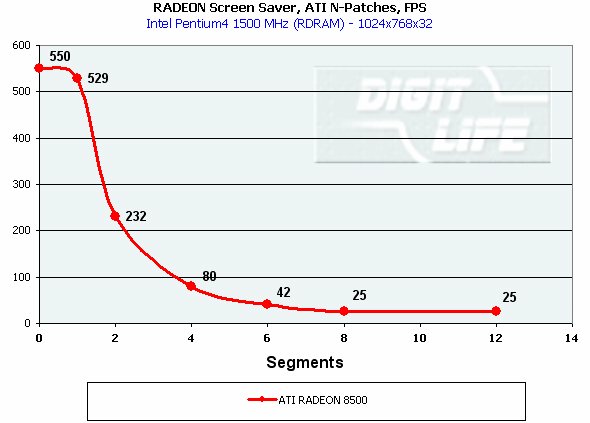 N-Patches can be used with the partition number equal to 2 or less. If it is 1 (a triangle turns into 4) this possibility doesn't affect the efficiency, but in case of 2 (into 16 triangles) the performance drops twice. At higher levels the speed falls down almost ten times. But this test is some kind of synthetic as in real applications N-Patches are, in fact, used only with models, while the surrounding scene is displayed a usual way. The technology can help the developers draw 3D objects very close to human beings:   This face consists of a great deal of polygons (after the TruForm processed it):  Let's summarize the limiting tests. Separate blocks of the GeForce3 outshined the RADEON 8500 several times. But the RADEON also trumped the GeForce 3 several times. I think it doesn't make sense to mark out a leader at this stage. Stay tuned and you will find out who is who in the tests in real applications. HSR effectivenessTo estimate the HSR effectiveness we used the test with a high OverDraw level - VillageMark v.1.17. Here are the results of both cards with enabled and disabled HSR: 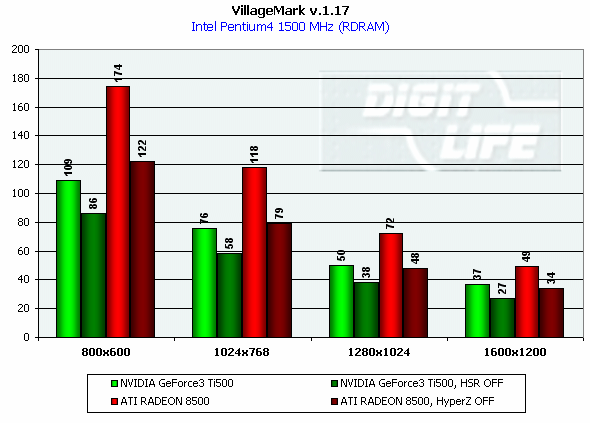 The RADEON has a better HSR realization, but benefit from the HyperZ II falls down faster than in case of the Ti 500 Z Cull as the resolution grows. 3D Mark 2001 - synthetic testsShading speedThis parameter was measured only for a 32bit color. I'm sure a 16bit frame buffer won't be supported in one-two next generations of accelerators. 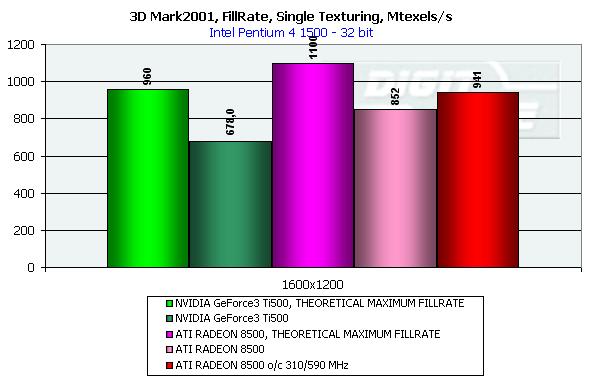 The results are obtained only for the resolution of 1600*1200 to minimize the dependence on other aspects. The highest result is achieved at the maximum resolution. The theoritical limits for this test are 960M pixel/sec for the Ti 500 and 1100 for the RADEON 8500. The latter is closer to its limit, thus, showing an excellent organization of caching and of memory operation, as well as a well-balanced architecture. 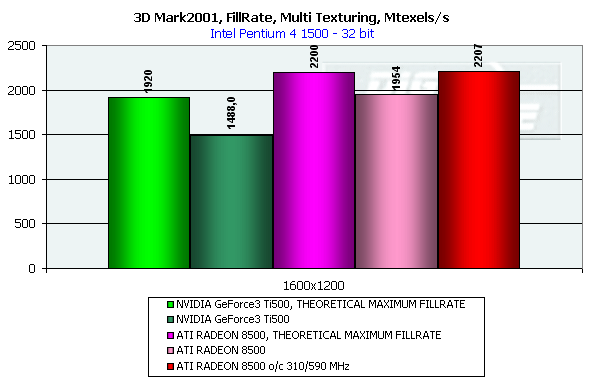 At the maximum multitexturing level (4 textures for the Ti 500 and 6 for the RADEON 8500) the situation is the same. The theoretical limits are 1920 for the Ti 500 and 2200 for the RADEON 8500. Nobody would doubt that the RADEON has a more perfect architecture. A scene with a great number of polygonsThis test was carried out at a low resolution to prevent an influence of shading on the results. 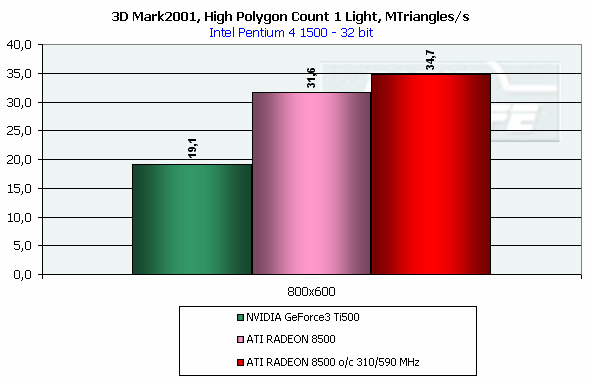 With one light source the RADEON becomes an absolute leader. Its result is even very close to the throughput limit for triangles obtained earlier with the Optimized Mesh from the DX8.1 SDK. The GeForce 3, on the contrary, has fallen drastically in this real test. 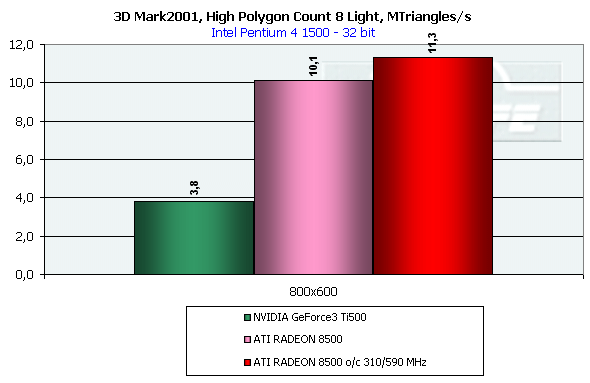 In case of 8 light sources the performance of the RADEON falls down three times. For the Ti 500 the drop is even worse. It is possible that in future games hardware light sources will be used intensively. Exactly in such applications the RADEON will be able to demonstrate its advantages over the GeForce3. Relief texturingThis test was carried out in the resolution of 1024*768 as the most popular for modern game applications. A too low resolution can result in severe dependency on the geometrical performance of the card, while a too high one - on the memory bus bandwidth.  The Ti 500 which is slower in shading coped with this test much better even than an overclocked RADEON. This is exactly what the test of the EMBM performance from the DirectX SDK promised. Now comes the DOT3 relief: 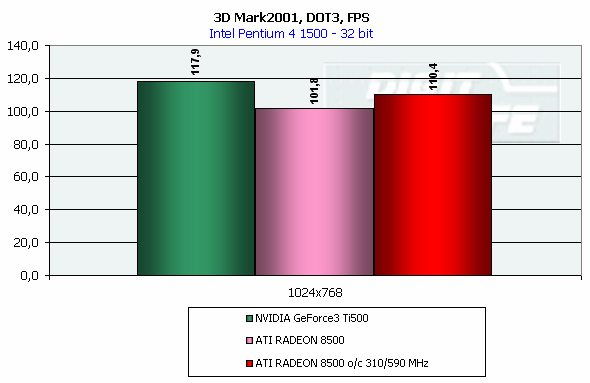 The GeForce3 shines here as well. But these two tests become not so popular as pixel shaders can help realize many various methods of relief texturing, including the one with a per-pixel calculation of illumination. Vertex shadersWe are giving the results in several resolutions: 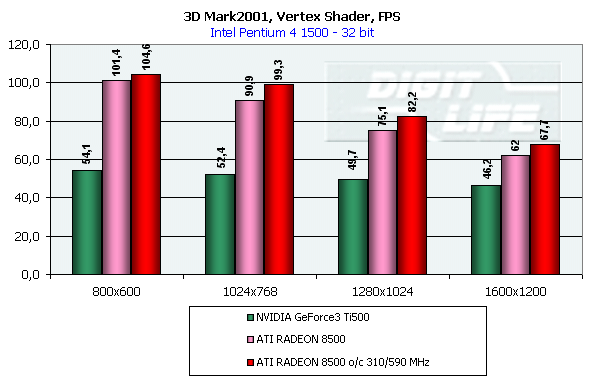 The efficiency of the Ti 500 falls quite slow as the resolution grows; it means that it mainly depends on the geometrical performance of the chip. On the contrary, the RADEON is limited by the shading speed! Even an intensive synthetic test couldn't beat the TCL block of the RADEON - its performance is superb. The RADEON is at least twice smarter than the Ti 500 here. If we compare this test with the DirectX SDK one where the RADEON was edged out by the GeForce3 Ti 500, the less synthetic scene from the 3D Mark 2001 allows the former to gain the ground back. Pixel shaderTaking into consideration that too low resolutions make the performance dependent on the geometry and too high ones - on the memory bandwidth, we will carry out this test at 1024x768: The RADEON is again ahead, but not so confidently. Its advantage corresponds to the speed difference of the competitors. On the whole, it performs good enough: in the real applications you won't see a theoretically possible twice worse efficiency of the RADEON. SpritesHere we will give only the lowest resolution because in others nothing changes cardinally: The RADEON outscores the Ti 500 due to its geometrical performance. Shading of flat sprites is quite simple, and their displaying rate is limited by the geometrical aspect - there are a lot of sprites, and before shading it is necessary to transform a great deal of coordinates. Summarizing the synthetic tests from the 3D Mark 2001 I should note that the RADEON gets the advantage thanks to its well balanced architecture. Later we will see whether this trend will keep in real games. Stay with us. [ Part III ] Write a comment below. No registration needed!
|
Platform · Video · Multimedia · Mobile · Other || About us & Privacy policy · Twitter · Facebook Copyright © Byrds Research & Publishing, Ltd., 1997–2011. All rights reserved. |


