 |
||
|
||
| ||
|
||
|
||
| ||
By Andrey Vorobiev and SomeBody
Else
IntroductionMuch had been spoken and written since the announcement of GeForce256 chip by NVIDIA about such technologies, that essentially improve videocard rendering quality, as Hardware Transform and Lighting (HW T&L), Cube Environment Mapping (CEM), DOT3 Product Bumpmapping (DOT3). And even though ATI RADEON card support all these functions, yet they have not been actually used in games, but the first such occurances begin to happen. In some demo programs the rendering speed of GeForce chips isn't good, therefore I have decided to find out the behavior of almost all GeForce cards gamma in games of the nearest future, i.e. with HW T&L, CEM, DOT3 support, but excluding DirectX 8 features like vertex and pixel shaders. These can be games aimed at DirectX 7 or OpenGL usage with extensions from videocard manufacturers, in particular from NVIDIA. I at once shall tell you that in this article there's no info about such chipsets as ATI RADEON and S3 Savage2000, that have HW T&L as well. It is so because cards on these GPUs do not work with a number of test tools (for example X-Isle, Gothic Chapel) used in the present article. I'm generally interested HW T&L speed, as one of the most important characteristics for future games with average quantity of polygons and with new CEM, DOT3 and other effects. Having defined this metric, it is possible to approximately assume geometrical scene complexity of future games. At once I want to tell, that for the moment of writing of this article I consider 30000-55000 polygons on the scene as the average quantity of polygons, low - everything that is lower than this threshold (almost all nowadays games), and high - 60000-90000 polygons per frame. It is a rather subjective approach, but it will be easier to express geometrical scene complexity. Games with lots of triangles (100000 and above) should appear later, but not earlier than the end of the year. I shall not pay much attention to pixel and vertex shaders, as main API for shaders is DX8, and there are few games/demos indicating these features (and those existing usually use a reference rasterizer, i.e. calculate a frame by software). The major minus of GF chips is that they do not support pixel shaders in complete version 1.0 and this version is considered as minimum for DX8. So with release of games using DX8 shaders, GF (as well as all other today chips, including competing ATi Radeon) probably will be off the 3D industry. But still there's a year until this can happen or maybe some 8-9 months. And then X-Box will be released, new videocards from NVIDIA and its competitors on chips of following generations and only then DX8 should get wide and deserved distribution. If there will be a possibility to test perfomance of DX8 applications, I shall try to renew the article. In due course testing of videocards on the next NVIDIA chips (NV20) in the same conditions is also possible, but it will be only after the release of these chips on real videocards. Some theoryThe theory will not be long, as actual speed almost always differs from theoretical to the worse and each case should be observed separately. The thing is not only in some chip perfomance uprating by their manufacturers (though it probably happens), but in impossibility of creation of acceptable "perfect" conditions to get the maximum perfomance in the actual applications. In some synthetic tests it is possible to get close to the peak speed of the chip, but this perfomance will not have anything in common with actual game situations. Therefore I have also tasked myself to find out the actual perfomance, using last developments in the field of game engines and to assume probable complexity of geometry in the future games of this year. It's not wise to measure T&L speed on modern games as the polygon complexity there is in the best case about 20 thousand polygons in the latest games, and the average is 4-8 thousand triangles per frame. Therefore it was necessary to use some benchmarks and demo programs. Knowing theoretical speed of the transformation and lighting block of all NVIDIA chips (see table), it is possible to assume that the average perfomance of GeForce chip in comparison with newer products (GF2GTS, GF2Pro, GF2Ultra) makes about half from their perfomance, depending on the chip. So the actual speed of GeForce256 should be approximately twice less than for the best representatives of newer generation.
As the support of HW T&L, CEM, DOT3, vertex and pixel shaders (partially in OpenGL extensions) has appeared on GeForce for the first time, we have the right to expect not too good speed of their usage. But for games of the nearest future it can be quite enough, as the high-detailed geometry is only planned. And users now have many videocards that do not support new features and it slows any innovations in games. This year should slightly advance us to the best geometrical detailing of games and wider application of such effects as DOT3, CEM. The first occurances have already begun to happen last year: Sacrifice, Giants and other. Almost all games under OpenGL use HW T&L, and the majority of games under DX7, released recently, also know how to use HW T&L. But, I shall repeat once again that low game world detalisation is used till now, excluding some very rare exceptions and there's little benefit of using HW T&L. I'm sceptic about necessity of high-detailed graphics in network 3D shooters, like Quake III and Unreal Tournament and I do not consider > = 60 FPS vitally necessary for all other games, but in network games the high speed is really necessary for the serious player. And for the majority of 3D arcade, non-network FPS and TPS, RPG, strategies, autosimulators, aviasimulators about 40 average FPS with minimum above 25 is quite enough. This speed will suit the majority of people, excluding some perfomance-mad :) or rich gamers. From this position I shall also try to consider operation of NVIDIA's videocards of the last and today generation in the future games of 2001. What can videocards on GeForce chips lack in the near future?
Major factor limiting speed of GeForce (and other chips too) under condition of sufficient CPU speed in the future games will be a ratio of HW T&L and actual fillrate capabilities, and therefore I shall devote tests to the definition of actual HW T&L Block speed for GeForce cards, with allowance for adverse conditions. Actual speedI have selected 800x600 and 1024X768, 1280X1024 resolutions for testing as they are frequently used in different games. Color depth was both 16 and 32 bits, where it was possible. Following demos and benchmarks were selected for testing:
Following configurations were used to calculate speed metrics:Main system based on Pentium III
Following videocards were tested with this configuration:
The additional system based on Intel Celeron
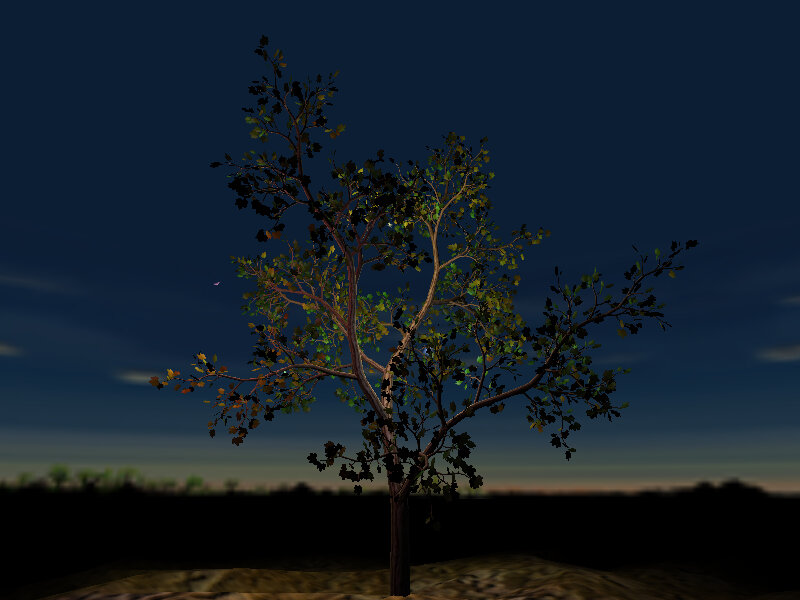
Now let's do some business at last. I have moved X-Isle, as a main benchmark to the end of the article, I think no offence :). Let's begin from an almost synthetic benchmark. "Almost", because it's still closer to reality than synthetic tests like from 3DMark2000, for example. TreeMarkSettings:I have selected three different settings for testing:
The testing was conducted only in 16-bit color due to complete (and strange) refusal of TreeMark to be tested in TrueColor on the main test system. Results: These conditions are quite acceptable for all chips the serie - average number of polygons and rather small number of light sources. In all cases framerate exceeds 35-40 FPS, and only GeForce256 videocard with SDR memory can't handle the resolution of 1280X1024. GeForce2 MX still benefits over GF256 DDR. But don't forget some artificiality of the test don't trust it completely ;).  That's more complex - more than 60000 polygons in a frame, only cards of the average level and above have passed this test without noticeable efforts. The "national" card on the GF2MX chip appreciablly overtakes GeForce256 with DDR memory in this test, that speaks about the greater perfomance of its T&L Block. But still it could pass 35 FPS barrier only in modes lower than 1280X1024. And the cards of the previous generation can not handle such geometrical complexity anymore - they hardly get close to 35 FPS in lowest resolution tested. "Complete" versions of GeForce2 do not show problems.  Well we see that GeForce's T&L engine has no power for such complex conditions. The number of light sources is twice more, and it seriously influences perfomance, polygons are more than 100000. In this mode the speed of all cards is obviously unsufficient. And the limit of actual maximum perfomance of GeForce2 is situated somewhere here - less than 100000 triangles per frame with 6-8 hardware light sources. We take 1024X768 as main resolution as the most acceptable, both widespread and speed-sufficient in many cases. We calculate actual HW T&L speed using this benchmark: Setting 1
Setting 2
Setting 3
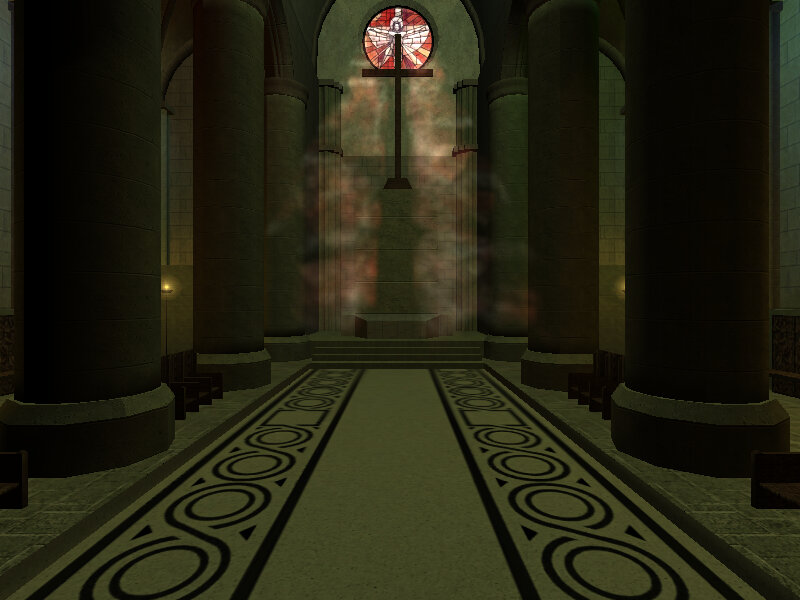
Explanations:You can see that adding 4 light sources and globally increasing scene complexity in the third configuration brings appreciable speed fall. The rather low value of T&L-ed polygons per second in the first case can be explained as when the number of polygons is lower than average, the fillrate and memory bandwidth begin to play the major role and the scene complexity influence is lesser. The doubling of number of light sources brings 1.5X speed decrease. In the third configuration the fillrate almost does not limit the speed and, as a result, GF2 MX considerably benefits over both representatives of the first generation of chips, and their speeds differ from each other unsignificantly. As well, the speeds of "elder" cards are proportional to clock rate of their GPUs. Alien Technology demo - Gothic ChapelThis demo program does not provide adjustments, therefore it was used "as is". The engine from FUN labs does not give possibility to use 16-bit color, therefore we are limited to 32-bit. This demo does not have a built-in benchmark (for average FPS) therefore it was necessary to use the Intel Graphics Performance Toolkit utility. With the help of it the instantaneous FPS was measured during one demo cycle, and then the average framerate was calculated. Thus it is necessary to take into account, that FPS calculation with the help of Intel GPT results in lowering the results for some 5-10%. The measurements were conducted in the one most popular resolution - 1024X768X32. Results: The darkest column in the diagram displays minimum framerate, the lightest - maximum, and that in the middle - average FPS. It seems that 3D engine from FUN labs is unsufficiently optimized, as results shown with its help are surprisingly low. More or less sufficient speed is given only with GeForce2 Ultra, the most productive for today! And minimum FPS is very low even in this case. No sense in speaking about other candidates. Most likely, this demo should have shown only practical capabilities of GeForce chips and FUN labs was not going to optimize the engine. I have also drawn a graph of framerate averaged per each ten seconds of running the demo on the basis of data about FPS.  You can see the slight speed fall at the moment of appoaching the figure of angel, rendered using cubic overlay of environment maps. Almost all videocards show identical tendencies of FPS change, only GeForce2 MX has dropped out of this orderly pattern. Probably, it's due to some novelty of the chip and poor "raw" drivers for it. But, despite all this, the card on the most widespread now and rather inexpensive chip has won over the competitor - the expensive and equipped with much faster memory GeForce256 DDR. Calculations:
Explanations:Do not forget that data is underestimated for 5-10%. You can notice the influence of actual fillrate on the example of maximum FPS - GeForce256 with DDR memory and GeForce2 GTS differ approximately by the same value as the memory bandwidths for these videocards. While for GeForce2 MX that showed the best average result in comparison with GeForce256 DDR, the maximum accessible framerate is lower. The rather low general perfomance can be explained by using of CEM, but effects of refraction and reflection were applied only to a figure of angel, whose number of polygons makes a small part of total. Therefore I say about the poor optimization of 3D-engine of this demo program. Besides, the number of polygons in the demo almost does not depend on time that together with very different average and maximum FPS speaks that the speed is limited not by HW T&L Block perfomance of tested videocards, but by some other value like fillrate with allowance of bandwidth limiting. 3DMark2000I have selected of the most complex settings for videocards for testing. Only with them HW T&L Block is actually loaded. High Detail mode was used for both game tests. Test 1: 53000 polygons, 5 light sources, 2,8 MBytes of textures Test 2: 37000 polygons, 8 light sources, 3,4 MBytes of textures Results: The facts that card on GeForce2 MX lost to every other, except for GeForce256 SDR, and the considerable improvement of speed metrics after lowering test resolutions speaks about that in this test the perfomance is seriously limited to memory bandwidth. The acceptable speed for "low" cards is reached in low resolution - 800X600, for videocards with DDR memory and 1024x768. GeForce2 Ultra had no problems.  In comparison with 16 bits the perfomance has fallen by 1,5 times in average, that again proves my saying about small influence of HW T&L Block perfomance and the considerable influence of fillrate. The level of gaming resolutions has fallen below 800X600 for the lowest models and only DDR memory helped GeForce256 DDR avoid it. GeForce2 GTS and GeForce2 Ultra show more cheerful results - 800X600 and 1024X768, accordingly. And now to the second game test.  Interesting that all videocards display close metrics, except for 1280X1024 resolution. Adding that testing on the "alternate" configuration with Celeron 450 processor gave little more than 20 frames per second, and this almost did not depend on resolution, it is possible to say that speed is limited by CPU. The special influence of HW T&L block was not noticed. The speed is sufficient everywhere and always. GeForce2 MX slightly benefits over the GeForce256 DDR competitor at the expense of the greater speed of the hardware geometrical calculations.  Increasing color depth to 32 bits make GeForce2 Ultra metrics reduce very unsignificantly, and for lower cards the speed fall reaches 1.5X. Unsufficiency of local video memory bandwidth also has effect. Here GeForce256 DDR anticipates the main contender - the card on based on GeForce2 MX. Calculations:1024X768X16 and 1024X768X32 are accepted as test resolution, as the average and the most acceptable for the given test. The actual speed of HW T&L engine according to 3DMark2000: Test 1 - 1024X768X16
Test 1 - 1024X768X32
Test 2 - 1024X768X16
Test 2 - 1024X768X32
Explanations:I think, that the general perfomance lowering in the second test in comparison with first is coupled to increase of light sources. It is also interesting that the smaller number of polygons per scene in the second test does not allow to show full capabilities of hardware T&L. By results of 3DMark2000 it is possible to say that even at the greatest possible geometrical complexity in these tests the perfomance of HW T&L does not play such an important role. Therefore all GeForce chips and cards based on them, will quite endure the average geometrical detailing. The T&L block will not limit speed even with 8 hardware light sources per scene in average. The thing is that in game tests of this benchmark the light sources do not light all scene triangles at once, but have a restricted operative range as against the majority of synthetic tests. And the most interesting test at last. X-Isle
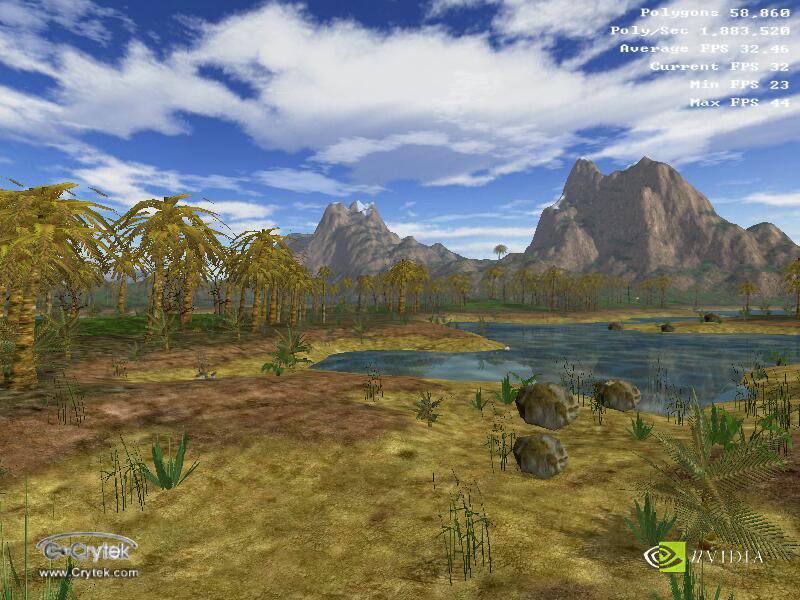
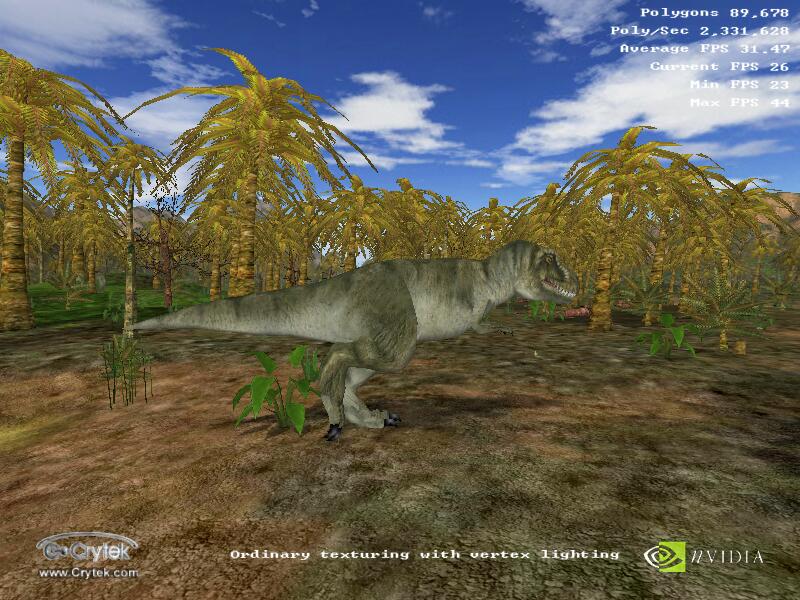
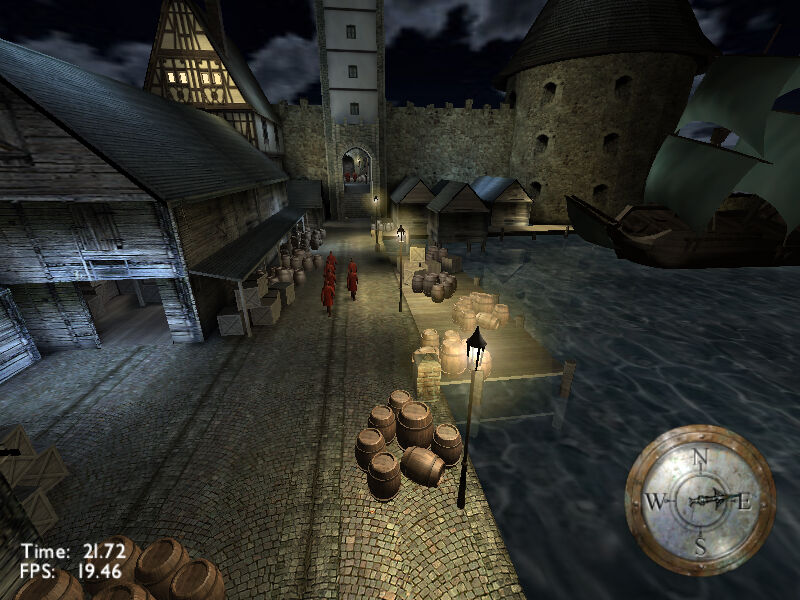
There were no special adjustments for 1.02 version demo (I mean before my patch appeared), except for choice of screen resolution and some other trivialities. First, the average FPS for all test cycle calculated by the program:  Once more I shall tell about the main limitation by fillrate. But the most interesting thing is that the bandwidth does not influence perfomance so seriously as in the last tests! Or how will you explain close results of GeForce256 SDR and GeForce256 DDR? And the results of "younger" GeForce2 favourably differ from them to better. The thing is in something else. Let's look closer at this later, for now we shall look at results in 16-bit color: Only GeForce2 Ultra could show normal speed in all tested resolutions. Its younger brother, GeForce2 GTS, could not sustain only 1280X1024. The videocards on GeForce 256 chip have shown awfully low speed, completely poor for the normal game. GeForce2 MX hardly endured 800X600X16. That's what I call a game engine of the new generation!  Nothing to tell here, cards of the lowest level "sank" deeper, and the "national" GeForce2 MX has joined them with results below 30 FPS in average. The "elder" representatives had losses as well - their minimum valid game resolutions were pushed step back down to 800X600 and 1024X768 for GF2 GTS and GF2 Ultra accordingly. At the first sight these are very low results hardly acceptable for the normal game. But we shall not draw a conclusion yet, and we shall calculate the preliminary results of T&L perfomance: Calculations (also for the average resolution of 1024x768):1024X768X16
1024X768X32
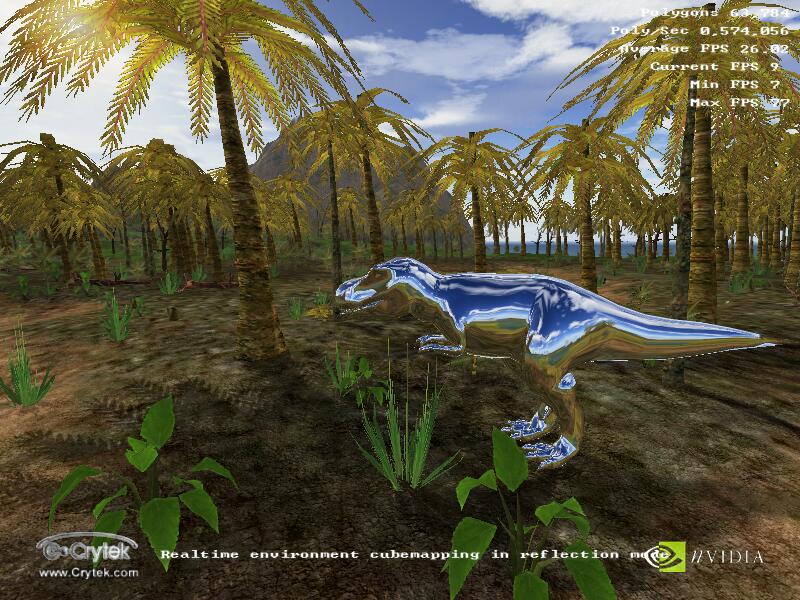
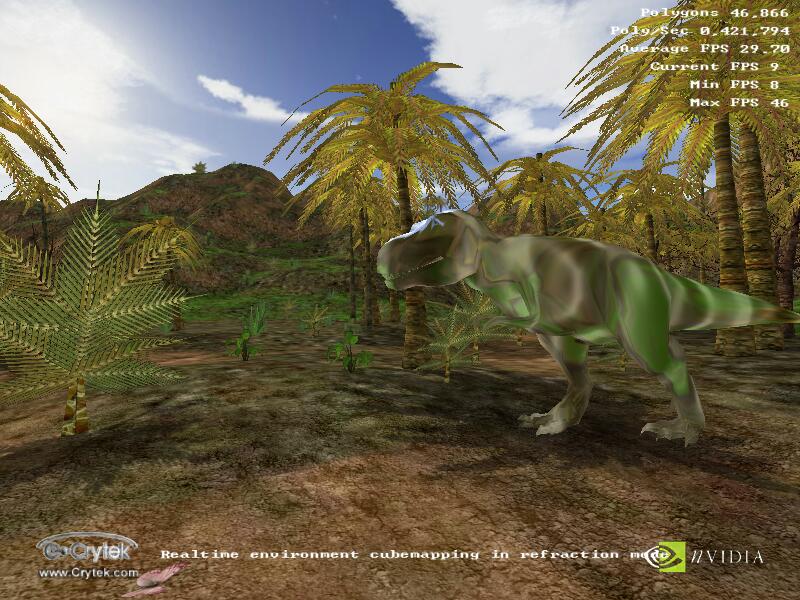
Seem not enough for GeForce256, taking into account data of the last tests where they were always close to GeForce2 MX. Let's try to clear things up. During testing I was surprised with one interesting fact - at testing systems on GeForce 256 chips, the speed was usually quite decent, but at appearance of T-Rexes with effects of reflection and refraction the speed dropped below 10 FPS at once. Having noticed that the moments with application of cubic texturing in the benchmark occupied almost half of all time I have decided to draw the graph of instantaneous FPS for all cards to reveal pattern fall-offs for GeForce 256 chips.  Voila! At first the speed of GeForce2 MX was even lower than speed of GeForce256 SDR. And only then, after first T-Rex with CEM effect cards based on GeForce256 chips hardly handled those 10 FPS. In traffic interruptions between CEM textured T-Rexes the speed was resetting to normal value. I can not precisely tell what is a reason of such results, it is hardly a defect of drivers, GF256 exists more than a year and such oversight would have been corrected. Maybe there is something in CryENGINE, but they write in a supporting text file about speed fall-offs on GeForce256 cards, so that it's most likely that chips of GeForce2 line were modified by NVIDIA to increase the CEM speed. It was necessary to calculate average scene complexity to meter HW T&L perfomance. The benchmark itself didn't give data number of triangles, therefore it was necessary to get it some way. While using Intel GPT, the demo was very slow with many graphic artefacts, and consequently I have decided to meter the average geometrical complexity "manually": Approximately each 10 seconds I wrote number of polygons in a frame and later calculated the average. These measurements are certainly a little rough, but still there's nothing except them, so they will do. I got 58000 polygons per scene in average. And here's approximate graph of geometrical scene
complexity.  The number of polygons during the test varies in limits 35-90 thousand polygons per frame at their average quantity about 58000. There were few graphic fall-offs, the complexity of geometry is well distributed throughout all benchmark. Probably, it's due to the good implementation of geometrical Level Of Depth (LOD). The high peak in middle of the graph is well coupled to speed in the previous graph - during decrease of the number of polygons down to 35 thousand speed considerably increases (the high peak for all videocards). Having the possibility to compare the perfomance of HW T&L with and without CEM separately from each other to receive the actual speed of T&L and its fall-offs during CEM enabling, I have made such table (using the second system based on Celeron CPU in 800X600X16 resolution):
Now all is understandable. You can see that the speed on GeForce256 SDR in usual modes was quite normal and made up 30-45 FPS, and in the moments with T-Rexes with CEM reflection and refraction the speed was reduced up to 9 frames per second, that is absolutely unacceptable for any player. From conducted calculation it is visible, that average FPS disregarding CEM effects made up 37 FPS that is even higher than the lowest boundary selected by me. Thus the speed of the HW T&L block makes hardly more than 2000000 polygons per second, and in modes with CEM drops down to 500000 polygons per second, i.e. by 4 times. To see speed fall-offs and average FPS with allowance for CEM and without it look at this graph:  The legend: instantaneous framerate - red line, average framerate with allowance for CEM - black and without this effect - dark blue. Hidden X-Isle settingsDuring testing with the help of X-Isle benchmark I have found some adjustments hidden by developers from users for some unknown reason. Probably, they have put them away until better times that is up to the following version. After some changes in the executable file, I have "opened" these additional settings and has decided to test the increase of perfomance using them. You can get the patch opening these adjustments hidden by developers in Crytek X-Isle 1.02 directly from here. But do not forget that these settings are unofficial and also that some of them do not work in general, preventing the test even from starting (they are marked with the exclamation sign), and some simply do not show visible effect (interrogative sign). So I have warned you. Those settings that work allow to change/disable some graphic features. Additional settings did not vary during usual tests. This test was conducted in 800X600X16 resolution on the second system based on Celeron CPU.  All visibly inoperable settings display identical results, but those working are rather interesting:
And the last item in graphics is the set of adjustments to support the high, almost maximum speed - it changes the settings that render positive influence on speed to the detriment of quality. By this optimization the average speed on my system has increased by 3,7 times and has made up almost 84 FPS. It is possible to increase FPS more, but this I leave to you for your own experiments :). But I can say that settings for this engine, providing the maximum perfomance for network players, have been found. ConclusionOn the basis of data about the T&L speed of videocards based on almost all chips of GeForce line I can draw a conclusion about the good perfomance of cards of the average and high level and about the acceptable of cards of the lowest price category for games of 2001. The summary table of average results
* - the value of average number of polygons per frame was calculated according to 40 FPS in average. ** - perfomance in relation to GeForce256 SDR At usage of no more than average 40000-50000 number of polygons per frame and 4-5 hardware light sources in the future games of intermediate period the speed of videocards based on GeForce256 and GeForce2 MX GPU will be sufficient for games in the majority of genres. At usage of new effects, such as reflection and refraction with the help of the Cube Environment Mapping, active usage of pixel shaders in OpenGL, the speed for the first GeForce and for the "national" GeForce2 MX can seriously fall and can be acceptable only at 25000-30000 polygons per frame or even lower, depending on the number of applied effects. Some technologies can be applied without fear - for example, DOT3 bumpmapping renders smaller influence on perfomance and allows to use high enough scene complexity. T&L perfomance of GeForce2 chips theoretically and practically is 1,5-2 times greater, therefore they are capable of processing geometry with the number of polygons simultaneously calculated per frame approximately 1,5-2 times greater. We receive about 75000-90000 polygons at inexact usage of HW T&L possibilities and also with some new effects, and 40000-50000 polygons at their wide application. But at usage of such number of polygons close to 100 thousand, the reduced perfomance of some system parameters can show up, i.e. CPU speed that may simply not be able to prepare data for HW T&L and also little AGP bandwidth through which this geometrical data is transmitted sometimes. Poor video memory bandwidth seriously limits possibilities of all GeForce chips. Almost in all cases this limitation was well noticable, but especially in 32-bit modes - there the perfomance is limited in the greater degree by effective fillrate rather than by speed of GPU's HW T&L block. Thus, the actual average speed of HW T&L engine on GeForce256 in modern 3D game engines makes no more than 1,5-2 millions of really textured, lighted and clipped polygons per second. At usage of many light sources and different effects the speed drops almost twice (8 light sources in comparison with 4-5), and in case of CEM - even four times. The actual T&L speed for GeForce2 reaches 2,5-4 million polygons per second. Major speed fall-offs like CEM were not noticed GeForce256. But the limitation of fillrate, CPU speed and small number of triangles even in the last applications sometimes does not allow HW T&L of GeForce2 to show all its power. The GeForce2 MX noticably outstands from the line of GeForce2, the cards on its basis are the most inexpensive among all tested, an additional brake for them is the rather low bandwidth of a local video memory, therefore their perfomance is much closer to GeForce256 DDR and GeForce256 SDR than to cards on GeForce2 chips. But in average, the little superiority over older chips is still present. I will assume that a large part of games of the intermediate period from the beginning of 2001 and to the wide usage of DX8 shaders will be oriented to GeForce256 and GeForce2 MX perfomance as the compulsory minimum. GeForce2 chips, beginning from GTS, will show themselves better in these conditions and will allow the player to not feel temporary speed fall-offs in gameplay. Write a comment below. No registration needed!
|
Platform · Video · Multimedia · Mobile · Other || About us & Privacy policy · Twitter · Facebook Copyright © Byrds Research & Publishing, Ltd., 1997–2011. All rights reserved. |


