 |
||
|
||
| ||
By Maxim
Lyadov
Some general explanations of technical terms can be found in our Sound FAQ. For more information refer to Personal Computer Audio Quality Measurements. For quantitative assessment of technical parameters of sound quality was used the SpectraLab 4.32.14 program (http://www.soundtechnology.com/). Spectrograms of harmonic distortion and noise were received with application of the reference sinusoidal 1 KHz signal to an input. The test sinusoidal signal with -3 dB amplitude was received in the wav-editor CoolEdit 2000 with a sinusoidal generator Generate/Tones. For measuring characteristics which are received with the signal in the external loopback (from a linear output to a linear input) we used a 10 cm cable made of separately shielded mic cables (d=6 mm). On its ends there are gold plated minijacks of Taiwanese production. A bit of theoryThe SpectraLab program is based on the FFT (Fast Fourier Transform). Here is a formula of the direct Fourier transform: (1) where A - signal amplitude, e.g. 1 Vrms, It serves a base for a formula of the discrete Fourier transform:  (2) where We can choose both a narrow frequency range for more precise examination and the whole bandwidth available which is, according to Kotelnikov theorem, can't exceed a half of the sampling frequency. For maximum performance N is chosen to be equal to the power of 2 (a series from 28 to 216 is usually proposed). What methodical errors do we receive? The most unpleasant thing is leakage. On applying a sinusoid instead of the ideal picture: 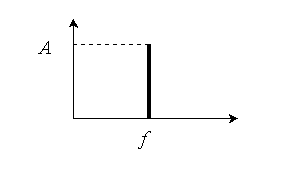 we get a bit different one: 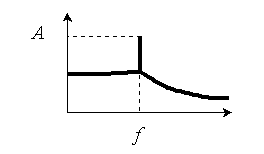 The leakage is a cost of realtime measurements. Even an ideal file with a pure sinusoid is distorted; it makes impossible to define a true value of noise spectral distribution on a real signal on the graph. Methods of FFT results representation (smoothing windows)
Depending on the aims results can be represented
in accordance with one of the methods specified in the table:
You can see that in ordinary life two methods - Hanning and Uniform - are sufficient. The principle of operation of all these methods lies in a selection of a such complex function which would give an optimal mode of amplitude and frequency dependence. Program modesThe Mode menu is intended for switching modes:  Real Time, Recorder, Post Process (in last one there is a possibility of FFT overlap for more precise measurements). 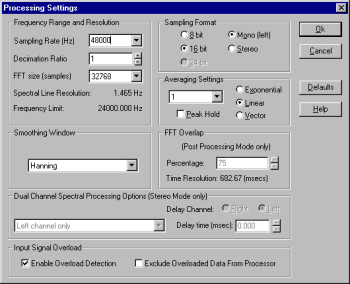 In Recorder mode open a test file - a 1 KHz sinusoid. Press F4 button or choose Option/Settings in the menu in order to set parameters. Note that if the processing frequency differs from sampling one, it will cause harmonic distortions from oversampling. ATTENTION! It's not recommended to use a test file of 1 KHz 44100 Hz sinusoid included in the SpectraLAB for measurement cards' characteristics in 48,000 Hz sampling mode. Averaging Settings - rounding on series of measurements. FFT size - N from the formula (2). Peak Hold - is necessary only to show the limit since measurement of distortions and noise in this mode is incorrect. Decimal Ratio - allows to reduce selection of frequencies. In order to eliminate AFC "pulsation" at the maximum FFT size you should reduce this parameter down to 32768 (I suppose that since numerical integration is too sensitive to a step, division by 216 in formula (2) worsens the accuracy and stability of the numerical method). Test signal choosingLet's create a standard sinusoidal 1 KHz 0 dB signal (amplitude is measured relative to the maximum signal without overload for 16-digit grid). A signal for tests normalized to "0" is not very good choice. In reality, nobody normalized music material in such a way - there is always some headover. One of the reasons is the following: an upper bit carries information on a half of the signal amplitude, errors in the course of reading of CD-DA are interpolated via a Reed-Solomon double cascade code, and with the signal normalized to 0 clicks will happen more and more often with time. For more real characteristics it's rational to use a file with -3 dB level. 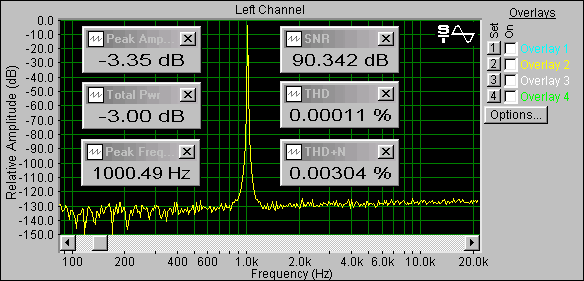 An even noise spectrum with nearly complete absence of harmonics is the best reference signal. Measured parametersTHD (Total Harmonic Distortion) is equal to a square root of a ratio of the sum of powers of all harmonics except the main one to a power of the main oscillation. 1 KHz signal of maximum amplitude is traditionally applied. It defines non-linearity and usually is strongly dependent on frequency. It's measured in percents. For digital equipment uneven increase of THD is typical when a digital signal comes out of digit capacity of a digital grid (for example, in case if high positions of volume regulators in a mixer or in case of incorrect algorithms). SNR (Signal to Noise Ratio) shows how much an amplitude of an output signal is greater than a mean-square noise power. It's calculated by subtraction of the above values in decibels, that is why it is dimensional quantity. SNR is important for analog devices and ADC/DAC. Since a level of noise influence on a human being greatly depends on the noise spectrum, a normal grid of A-weighting is used in order to take into consideration subjective perception. "A-weighting" must be specified next ot the parameter. Digital noise doesn't obey to the geometrical composition low as analog one. For joint assessment of noise and distortions the THD+N is measured. A real signal consists of frequencies which can differ ten times. Due to non-linearity of an audio track parasitic modulation harmonics can appear. It makes sound unpleasant and unnatural. InterModulation Distortion (IMD) is used to take it into account. AFC (amplitude-frequency characteristic) is the variation in signal level as the frequency as varied. The plot is drawn by measuring the output amplitude when a harmonic signal (usually it is swept sine) with a constant amplitude is applied. Ideally, it should be a straight line. Here it is not an absolute correspondence to the reference signal that matters, but a deviation from the most even part. It allows to judge how accurate a signal amplitude is delivered at different frequencies. If necessary, it's corrected with a multiband equalizer. Unfortunately, analog equalizers bring in much more unpleasant phase distortions than frequency distortions do. Note that digital equalizers which work not in real time do not bring in phase distortions. Power of quantization noise in course of sampling can be reduced by several dB at the expense of oversampling and following filtering of inaudible frequencies, what is widely used in codecs and DACs. I have mentioned it in order to explain a technological necessity of installation of high order filter (what implies drop of AFC at high frequencies). But it's difficult to create an ideal filter (cheap ad effective) that is why developers often get in the audible range. Influence of such engineering solutions must be accurately estimated in each definite case. Application of this method and correctness of measurement resultsIn the article SB Live! and home studio you can find a comparison of audio track parameters of the SBLive! sound card received on the Audio Precision measuring complex with the parameters of professional and semi-professional cards. The data we received with the SpectraLab 4.32.14 differ from those in the article by no more than 1.5%. Anyway, our aim is not to obtain absolute values, but is to compare sound cards' parameters according to the same method in the same conditions. The results conform to independent acoustic expert estimation on high quality audio equipment. We are aimed at development and improvement of this measuring method. Comments from competent experts are welcome. |
Write a comment below. No registration needed!
|
Article navigation: |
| blog comments powered by Disqus |
| Most Popular Reviews | More RSS |
 |
Comparing old, cheap solutions from AMD with new, budget offerings from Intel.
February 1, 2013 · Processor Roundups |
 |
Inno3D GeForce GTX 670 iChill, Inno3D GeForce GTX 660 Ti Graphics Cards A couple of mid-range adapters with original cooling systems.
January 30, 2013 · Video cards: NVIDIA GPUs |
 |
Creative Sound Blaster X-Fi Surround 5.1 An external X-Fi solution in tests.
September 9, 2008 · Sound Cards |
 |
The first worthwhile Piledriver CPU.
September 11, 2012 · Processors: AMD |
 |
Consumed Power, Energy Consumption: Ivy Bridge vs. Sandy Bridge Trying out the new method.
September 18, 2012 · Processors: Intel |
| Latest Reviews | More RSS |
 |
Retested all graphics cards with the new drivers.
Oct 18, 2013 · 3Digests
|
 |
Added new benchmarks: BioShock Infinite and Metro: Last Light.
Sep 06, 2013 · 3Digests
|
 |
Added the test results of NVIDIA GeForce GTX 760 and AMD Radeon HD 7730.
Aug 05, 2013 · 3Digests
|
 |
Gainward GeForce GTX 650 Ti BOOST 2GB Golden Sample Graphics Card An excellent hybrid of GeForce GTX 650 Ti and GeForce GTX 660.
Jun 24, 2013 · Video cards: NVIDIA GPUs
|
 |
Added the test results of NVIDIA GeForce GTX 770/780.
Jun 03, 2013 · 3Digests
|
| Latest News | More RSS |
Platform · Video · Multimedia · Mobile · Other || About us & Privacy policy · Twitter · Facebook
Copyright © Byrds Research & Publishing, Ltd., 1997–2011. All rights reserved.