 |
||
|
||
| ||
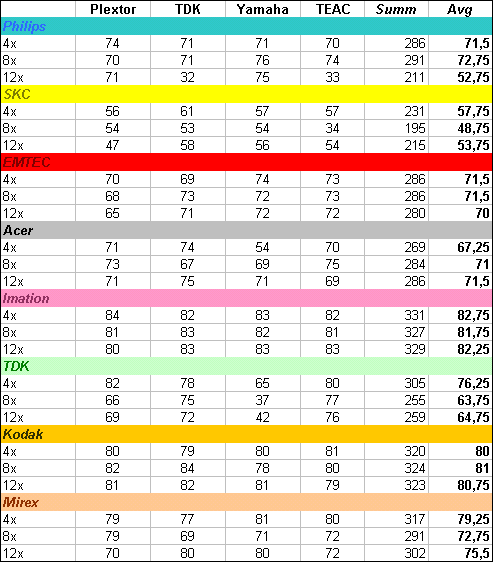
Combined diagramsThe following diagrams are based on the averaged test results of all CD-R discs.
If it's better for you to work with a table, here it is:  [ Back to article ]
Write a comment below. No registration needed!
|
Platform · Video · Multimedia · Mobile · Other || About us & Privacy policy · Twitter · Facebook Copyright © Byrds Research & Publishing, Ltd., 1997–2011. All rights reserved. |